Microstructure and Cerebral Blood Flow
within White Matter of the Human Brain: A
TBSS Analysis
Stéphanie Giezendanner1, Melanie Sarah Fisler1, Leila Maria Soravia1, Jennifer Andreotti1, Sebastian Walther2, Roland Wiest3, Thomas Dierks1, Andrea Federspiel1
*
1Center for Translational Research, University Hospital of Psychiatry and Psychotherapy, University of Bern, Bern, Switzerland,2University Hospital of Psychiatry and Psychotherapy, University of Bern, Bern, Switzerland,3Support Center for Advanced Neuroimaging (SCAN), Institute for Diagnostic and Interventional Neuroradiology, University Hospital Inselspital and University of Bern, Bern, Switzerland
Abstract
Background
White matter (WM) fibers connect different brain regions and are critical for proper brain function. However, little is known about the cerebral blood flow in WM and its relation to WM microstructure. Recent improvements in measuring cerebral blood flow (CBF) by means of arterial spin labeling (ASL) suggest that the signal in white matter may be detected. Its impli-cations for physiology needs to be extensively explored. For this purpose, CBF and its rela-tion to anisotropic diffusion was analyzed across subjects on a voxel-wise basis with tract-based spatial statistics (TBSS) and also across white matter tracts within subjects.
Methods
Diffusion tensor imaging and ASL were acquired in 43 healthy subjects (mean age = 26.3 years).
Results
CBF in WM was observed to correlate positively with fractional anisotropy across subjects in parts of the splenium of corpus callosum, the right posterior thalamic radiation (including the optic radiation), the forceps major, the right inferior fronto-occipital fasciculus, the right inferior longitudinal fasciculus and the right superior longitudinal fasciculus. Furthermore, radial diffusivity correlated negatively with CBF across subjects in similar regions. More-over, CBF and FA correlated positively across white matter tracts within subjects.
Conclusion
The currently observed findings on a macroscopic level might reflect the metabolic demand of white matter on a microscopic level involving myelination processes or axonal function. How-ever, the exact underlying physiological mechanism of this relationship needs further evaluation. OPEN ACCESS
Citation:Giezendanner S, Fisler MS, Soravia LM, Andreotti J, Walther S, Wiest R, et al. (2016) Microstructure and Cerebral Blood Flow within White Matter of the Human Brain: A TBSS Analysis. PLoS ONE 11(3): e0150657. doi:10.1371/journal. pone.0150657
Editor:Hengyi Rao, University of Pennsylvania, UNITED STATES
Received:July 23, 2015
Accepted:February 16, 2016
Published:March 4, 2016
Copyright:© 2016 Giezendanner et al. This is an open access article distributed under the terms of the Creative Commons Attribution License, which permits unrestricted use, distribution, and reproduction in any medium, provided the original author and source are credited.
Data Availability Statement:All relevant data are within the paper and its Supporting Information files.
Funding:This work was supported by a grant from the Swiss National Science Foundation
(32003B_124947).
Introduction
Brain white matter (WM) consists of axons connecting neurons and of neuroglial cells that
support and protect neurons [1]. The myelination of axons provides an electrical insulation
that enhances the impulse conduction and supports axonal integrity [2–4]. Intact white matter
microstructure appears crucial for proper brain functioning and is altered in psychiatric
disor-ders and neurodegenerative diseases [5–9]. However, little is known about the perfusion of
white matter, e.g. the cerebral blood flow, and how it is related to the microstructure of white
matter [10,11].
Magnetic resonance imaging (MRI) enables the assessment of microstructure and
physiol-ogy of white matter non-invasively and in vivo [12]. On the one hand, diffusion tensor imaging
(DTI) offers a measure of different white matter microstructural properties [13]. On the other
hand, arterial spin labeling (ASL) is used to quantify cerebral blood flow (CBF) in the human
brain [14]. Yet, the measurement of blood perfusion in WM with ASL was claimed to be
chal-lenging since the blood perfusion of white matter is lower, more heterogeneous and the ASL labelled bolus takes longer to arrive and therefore the T1 decay of the signal is more advanced
than that of grey matter (GM) [10,15,16]. However, with the implementation of
pseudo-con-tinuous ASL (pCASL) at 3T, the signal-to-noise (SNR) ratio as well as the efficiency of the
tag-ging was shown to be increased [17]. Recent studies indicate that white matter CBF can be
reliably detected using pCASL at 3T [15,16].
Regarding the relationship between cerebral blood flow and white matter microstructure, clinical studies provide accumulating evidence that WM health is closely related to its perfu-sion with blood. In Alzheimer’s disease and multiple sclerosis, reduced brain perfuperfu-sion was associated with an increase in WM lesions, hyperintensities or decreased anisotropic diffusion
across subjects [18,19]. Additionally, cerebrovascular diseases were related to decreased
aniso-tropic diffusion, white matter hyperintensities and cognitive decline across the elderly [20–25].
These findings suggest that certain WM regions might be particularly vulnerable to
hypoperfu-sion due to its blood supply via long penetrating arterioles [26]. In summary, pathologies
which impede proper brain perfusion tend to affect WM health.
However, little is known about white matter blood perfusion and its relation to white matter microstructural properties across healthy subjects and across fiber tracts. Notably, neuroana-tomic studies of the brain vascular system indicate that blood supply patterns in white matter are regionally different, explaining the variations in vulnerability to perfusion or oxygen
defi-ciency [27]. Moreover, white matter fibers vary in size and density according to their function,
activation and location within the brain [28–32]. Recent studies indicate that WM
mainte-nance is an active and energy-demanding process [33,34]. Considering the above mentioned
relationship between WM health and cerebral perfusion and the physiological properties of WM, we hypothesized to find a positive correlation between measures of WM anisotropic dif-fusion properties and WM perdif-fusion. Intriguingly, Aslan and colleagues reported an inverse relationship between anisotropic diffusion and WM perfusion on a tract-specific basis within
subjects [11]. In particular, tracts with higher anisotropic diffusion were shown to be less
per-fused [11]. However, this study investigated a limited number of WM tracts using tractography
and averaged diffusion metrics along the fiber tracts. Thus, the specific regional relationship between WM integrity and WM perfusion across subjects has not yet been assessed
conclusively.
skeleton across subjects [35]. Furthermore, we aimed to assess the tract-specific relationship
between CBF and anisotropic diffusion of water within subjects [11]. According to the study of
Aslan and colleagues (2011), we hypothesized to find an inverse correlation between WM per-fusion and anisotropic difper-fusion across fiber tracts within subjects. To test this hypothesis, we performed an atlas-based ROI analysis within subjects.
Materials and Methods
Participants
A total of 43 right-handed subjects were studied (15 men and 28 women) with an age range between 20 and 46 years (mean = 26.30, SD = 5.29 years). Procedures were approved by the local ethics committee (of the Kanton Bern, Switzerland) and are in accordance with the Decla-ration of Helsinki. The full KEK Commission Board Bern specifically approved this study and assigned the KEK-Nr: 196–09. All participants provided written informed consent prior to the examination. Subjects were not paid for participation. The Exclusion criteria included contra-indications for MRI scanning (metallic objects, pregnancy), acute or chronic medical condi-tion, neurological or severe psychiatric diseases, current drug or alcohol abuse, regular medication or contraceptives.
MRI Data Acquisition
Magnetic resonance imaging was performed on a 3 T Siemens Magnetom Trio Scanner (Erlangen, Germany) equipped with a standard radio-frequency head coil.
Anatomical high-resolution T1-weighted sequence. For structural images, a high-resolu-tion 3D T1-weighted imaging protocol modified driven equilibrium Fourier transform
(MDEFT) [36] was used, resulting in 176 sagittal slices of 1.0 mm thickness, 256 × 256 mm2
field of view (FOV), and a matrix size of 256 × 256, resulting in a voxel size of 1 × 1 × 1 mm3.
Further scan parameters were 7.92 ms repetition time (TR) 2.48 ms echo time (TE) and 910 ms
inversion time (TI) for an optimized contrast-to-noise ratio [36].
DTI data acquisition. Diffusion tensor imaging encompassed the following parameters:
FOV = 256 × 256 mm2, matrix = 128 × 128, axial slices = 55, slice thickness = 2 mm, gap = 0
mm, voxel size = 2 × 2 × 2 mm3, TE/TR = 93/7500 ms. DTI was performed with a spin echo
planar imaging (EPI) using two 180° pulses at b-value of 0 s/mm2and at a maximal b-value of
1300 s/mm2along 42 non-collinear directions.
pCASL MRI data acquisition. For the measurement of CBF a pseudo continuous arterial
spin labeling (pCASL) technique with the following parameters was used [17,37]: TR/
TE = 3500/18 ms, FOV = 230 × 230 mm2, matrix size = 64 × 64 (Isocenter of the readout slice
was 90 mm above labeling plane), balanced labeling with mean Gz of 0.6 mT/m and 60
Han-ning window-shaped RF pulses (RF duration 600μs with 900μs gap, a flip angle (FA) = 25°,
and bandwith 3,004 Hz/pixel), total labeling duration (τ) = 1.72 s and post-labeling delay (ω)
(PLD) = 1.1 s. 13 axial slices, voxel size = 3.6 x 3.6 x 6.5 mm3, 6.5 mm slice thickness and 0.5
mm gap. All ASL and DTI slices were positioned along the AC-PC line and were recorded (Sie-mens Erlangen, Germany). The number of timeseries (pairs of control and labeling images)
varied between subjects (seeS5andS6Figs). In order to assess the quality of the signal in WM
across PLD we additionally recorded five subjects with the same ASL setting with three
differ-ent PLD values: 1100 ms, 1525 ms (according to [11]) and 1900 ms (according to“ASL white
paper”[38]). SNR and CBF values were subsequently compared across PLDs (seeS16andS17
MRI Data Analysis
DTI data processing. Preprocessing of the FA data was carried out using TBSS [35], part
of FSL 5.0 [39]. First, diffusion images were corrected for head movement and eddy currents.
Then, FA images were created by fitting a tensor model to the raw diffusion data using FDT
and then brain-extracted using BET [40]. All subjects' FA data were then aligned into 1 × 1 × 1
mm MNI space using the nonlinear registration tool FNIRT [41,42], which uses a b-spline
representation of the registration warp field [43]. Next, the mean FA image was created and
thinned to create a mean FA skeleton representing the centers of all tracts common to the group. This skeleton was then thresholded at a FA value of 0.3 in order to minimize partial vol-uming effects. Each subject's aligned FA data was then projected onto this skeleton and the resulting data fed into voxel-wise cross-subject statistics. Additionally to the FA images, further putative indices of tissue microstructure were calculated such as the mean diffusivity (MD), radial diffusivity (RD) and axial diffusivity (AD).
Partial volume estimates based on anatomical high-resolution T1-weighted sequence.
The intensities of the three-dimensional T1-weighted scans were used to automatically seg-ment brain tissue into cerebrospinal fluid (CSF), GM and WM by a robust method treating the
partial volume affected voxels as outliers of the pure tissue distribution [44]. This trimmed
minimum covariance determinant method enabled a rigorous treatment of the partial volume
estimates (PVE) in each voxel [45]. For the creation of GM and WM masks, the respective
tis-sue was subtracted from all other contaminations, resulting in GM or WM masks consisting of 100% GM or WM tissue respectively. The resulting GM and WM masks were then trans-formed into ASL space. Finally these masks were thresholded at 40% and 70% respectively to
generate binary masks for the use in subsequent analyses (seeS1 FigandPartial volume
correction).
ASL data processing. First, the raw pCASL data were motion-corrected using MCFLIRT
in FSL 5.0 [46], which loads the time-series and uses the middle volume as an initial template
image (seeS3 Figfor motion parameter estimation). Control-tag pairwise differences were
computed to yield a mean difference map for each subject. These difference maps were
normal-ized by the equilibrium magnetization (M0) of arterial blood estimated via the magnetization
of CSF.
CBF quantification
For the quantification of CBF a variational Bayesian approach accounting for the differences in
acquisition time across the slices as implemented in FSL 5.0 [47] was used (BASIL). The
cali-bration of ASL images in order to obtain CBF maps in absolute units of ml/100g/min was per-formed using the following equation.
CBF¼ lDM
2aM0T1 b
1
e w=T1b e ðtþwÞ=T1bÞ
Post-labeling delay time (ω) = 1100 ms, bolus duration (τ) = 1720 ms, the blood tissue
parti-tion coefficient (λ) = 0.9 [g/ml] [48] and the inversion efficiency assumed to be (α) = 85%.ΔM
is the difference between the control and the label signal. For 3.0 Tesla the decay time for the
labeled blood (T1b) = 1650 ms, the tissue longitudinal relaxation time of white matter = 1084
ms [49].M0are the equilibrium magnetization images, which werefirst calculated for CSF and
The signal-to-noise (SNR) calculation with the PVE corrected CBF images were done as
described in Aslan et al [50] using as the signal level the CBF image and as the noise level the
CBF variance image. The latter was used to calculate the standard error and was divided by the square root of the number of pairs (in our experiment this was 50, 100, 150 or 200). More in detail, the SNR was calculated for each voxel and for each subject. It served as a basis to calcu-late the SNR in different ROI’s (e.g. WM and GM masks). SNR was averaged over all the voxels for each of these different masks separately.
Partial volume correction. The low resolution of ASL data typically means that there is partial voluming of GM, WM and CSF. Since GM and WM have varying kinetics–with WM having a lower CBF and longer arrival times–a normal analysis will provide a CBF that are ambiguous (e.g. a combination of the two tissue types). Thus, the contributions of different tis-sue types were corrected for by exploiting PVE as obtained from high resolution T1 images (seePartial Volume Estimates based on Anatomical High-resolution T1-weighted Sequence
above) that were transformed to same resolution of ASL images [51,52]. The resulting CBF
images are therefore corrected for possible contributions from partial volume effects.
Multimodal data and fusion. Inter-scan registrations were conducted using FLIRT
(FMRIB's Linear Image Registration Tool,www.fmrib.ox.ac.uk/fsl) of FSL 5.0. FLIRT is a fully
automated robust and accurate tool for linear (affine) intra- and inter-modal brain image
regis-tration [46,53]. For the statistical analysis, the CBF maps, the perfusion variance and the SNR
maps were registered to the FA images using an affine 12 parameter model provided by the FLIRT algorithm. As mentioned in 2.3.1. GM probability maps were co-registered to the FA images using an affine 12 parameter model provided by the FLIRT algorithm. The skeletons of the CBF, SNR, perfusion variance and GM maps were obtained by applying the non-FA option in TBSS including the nonlinear warps and skeleton projection from the FA maps to these maps.
Statistical analysis. Statistical analysis was carried out with FSL Randomise program, which is based on a non-parametric approach using permutation test theory with a standard
general linear model (GLM) design matrix [54,55]. The GLM examined the association of
microstructural properties such as FA, MD, AD and RD values with CBF values on a voxel-wise basis in the WM skeleton across subjects. Covariates such as age, gender the number of ASL time series and mean relative displacement were entered into the analyses as explanatory variables, while individual maps of variance in the ASL data, maps of the partial voluming of
grey matter and CBF maps were entered as voxel-dependent regressors into the model [56]. All
covariates were demeaned before running the randomise program. The permutation testing was performed using 5,000 Monte Carlo random permutations to generate random permuta-tion maps. This approach allows for inference on the statistical maps when the null distribupermuta-tion is unknown and offers a solution to the problem of multiple testing. A threshold-free cluster enhancement (TFCE) option was employed in order to enhance the cluster-like structures in
images without having to define an initial cluster-forming threshold [57]. Using this setup the
voxel-wise relation between microstructural properties and CBF values across subjects were then assessed, testing the significance corrected for multiple comparisons (TFCE corrected
p<0.05) or uncorrected for multiple comparisons (TFCE uncorrectedp<0.05). From the
results of the voxel-wise analyses, the skeletal regions showing significant effects were located and labelled anatomically by mapping the statistical map to the John Hopkins University
(JHU)-ICBM-DTI-81 WM labels atlas and the JHU-WM tractography atlas in MNI space [58,
59]. In the tables, only clusters greater than 50 voxels per WM region were shown. For the
For visualization purposes we use the FSL“tbss_fill”command: a command that visualizes the results not on the TBSS skeleton (i.e. the true representation of actual analysis) but on a “thickened”skeleton (i.e. convolution of the TBSS skeleton with a sphere of radius 3 mm).
Descriptive statistics. For comparison purposes, the mean values of diffusion and
perfu-sion measures were extracted in GM and WM across subjects and listed inTable 1. The
crea-tion of GM and WM masks is described in the supplementary material (seeS1 Fig). Four
subjects who presented particularly low CBF in GM (less than 38 ml/100g/min) were excluded
from the subsequent statistical analyses (seeS4 Fig). The six motion parameters at each time
point were converted to a time course measure of the relative RMS voxel displacement. Finally, the temporal average of this time course displacement signal was used to represent overall sub-ject motion for the session. This metric is termed the mean relative displacement (MRD), and
is expressed in mm (seeS3 Fig). This metric was used as a covariate in the statistical analyses.
Results
Descriptive results of microstructural and ASL-related properties
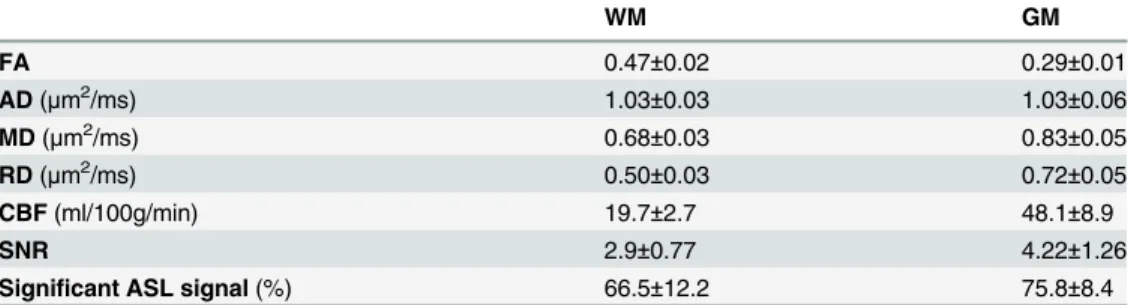
Table 1summarizes CBF, FA, AD, RD, MD and SNR of CBF as well as the proportion of
signif-icant ASL signal in the WM and GM across subjects (seeMethodsof Supplementary Material).
Notably in WM, the mean CBF was found to be 19.7 ml/100g/min with a mean signal to noise ratio of 1.33 and a mean proportion of voxels with a significant ASL signal of 66.5%. The latter indicates that in 66.5% of WM voxels the difference of the control and label image was
signifi-cantly different from zero and thus the ASL signal was reliably detected [15]. In the
supplemen-tary material, the proportion of significant ASL signal in WM and GM is displayed within one subject across 200 ASL signal averages and across subjects with differing numbers of averaged
ASL signal (seeS5andS6Figs). Moreover,S2 Figshows the SNR and the CBF in GM and WM
as well as the GM and WM masks along the axial slice of a subject.S3 Figshows the mean
rela-tive displacement as the relarela-tive voxel displacement RMS in mm across the ASL timeseries.S7
Figdisplays the effects of the different numbers of averages on CBF and SNR in GM and WW.
Correlation of microstructural properties with CBF across subjects
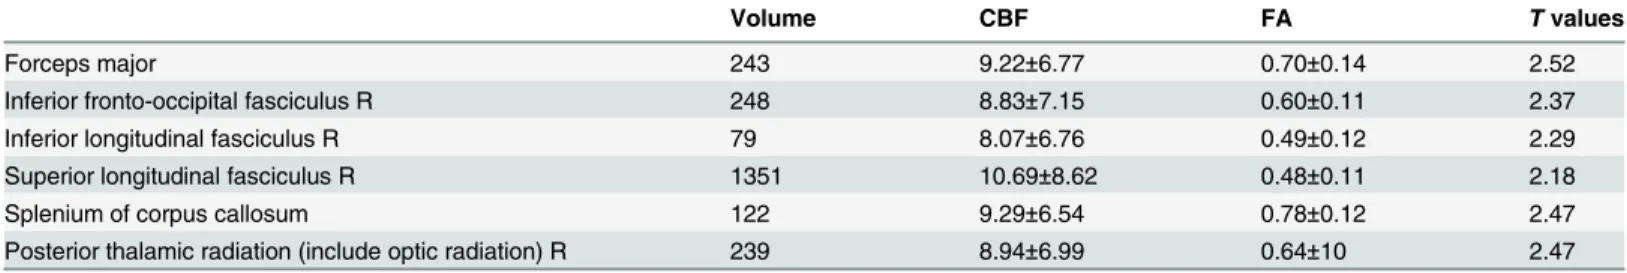
The statistical analyses probing for a relationship between CBF and white matter properties across subjects were co-varied for age, gender, the number of ASL time series, mean relative displacement (MRD), the variance in the ASL data and the partial volume effects of grey mat-ter. Results of the TBSS analysis showed a significant positive correlation (TFCE correctedp<0.05) between fractional anisotropy and CBF values across subjects in parts of the splenium
of corpus callosum, the right posterior thalamic radiation (include optic radiation), the forceps major, the right inferior fronto-occipital fasciculus, the right inferior longitudinal fasciculus
Table 1. Summary of mean±standard deviations in WM and GM of FA, AD (μm2/ms), MD (μm2/ms),
RD (μm2/ms), CBF, SNR and ASL signal (%) across subjects (n= 43).
WM GM
FA 0.47±0.02 0.29±0.01
AD(μm2/ms) 1.03±0.03 1.03±0.06
MD(μm2/ms) 0.68±0.03 0.83±0.05
RD(μm2/ms) 0.50±0.03 0.72±0.05
CBF(ml/100g/min) 19.7±2.7 48.1±8.9
SNR 2.9±0.77 4.22±1.26
Significant ASL signal(%) 66.5±12.2 75.8±8.4
and the right superior longitudinal fasciculus (Fig 1,Table 2). Notably, the SNR in the brain
regions displayed inFig 1is significantly greater than 2.0 for CBF values [t(38) = 6.25;
p<0.0001; seeS14 Fig].]. Furthermore, the difference of control and label image within the
brain regions displayed inFig 1is significantly greater than 2.0 [t(38) = 2.75; p<0.005; seeS15
Fig]. The positive relationship between CBF and FA across subjects is additionally displayed
for each WM region separately inS8 Fig. The proportion of voxels displaying a significant ASL
signal within the significant cluster of this analysis was 70.1%.
Fig 1. A) Regions of significant positive correlation between CBF and FA across subjects overlaid on the MNI template (in grey) at x = 54, y = 115, z = 99 (TFCE correctedp<0.05). Regions of significant positive correlation between CBF and FA across subjects are indicated in red (tbss_fill was used here which “thickened”the TBSS results). B) The scatterplot shows the mean FA and CBF values extracted from each subject in the significant regions indicated in.
doi:10.1371/journal.pone.0150657.g001
Table 2. Summary of the regions including volume (mm), FA, CBF (ml/100g/min) andtvalues where a significant positive relationship between
CBF and FA values was found across subjects. The values were extracted by masking the respective skeletons with the JHU WM labels and tracts and the significant regions (TFCE correctedp<0.05). The values are listed as mean±standard deviation.
Volume CBF FA Tvalues
Forceps major 243 9.22±6.77 0.70±0.14 2.52
Inferior fronto-occipital fasciculus R 248 8.83±7.15 0.60±0.11 2.37
Inferior longitudinal fasciculus R 79 8.07±6.76 0.49±0.12 2.29
Superior longitudinal fasciculus R 1351 10.69±8.62 0.48±0.11 2.18
Splenium of corpus callosum 122 9.29±6.54 0.78±0.12 2.47
Posterior thalamic radiation (include optic radiation) R 239 8.94±6.99 0.64±10 2.47
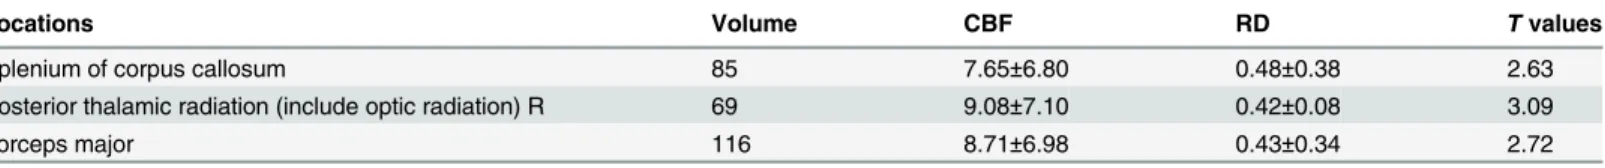
In addition, TBSS analysis demonstrated a significant negative correlation between CBF and
radial diffusivity (TFCE correctedp<0.05) in parts of the splenium of corpus callosum, the
right posterior thalamic radiation (include optic radiation) and the forceps major (Fig 2and
Table 3). When not correcting for multiple comparisons, CBF was significantly correlated with FA (positively), RD (negatively) and MD (negatively) within broad areas of the whole WM
skeleton (TFCE uncorrectedp<0.05) (seeS9,S10andS11Figs).
In addition,Fig 3indicates the relationship between mean FA and mean RD, MD and AD
within the regions that showed a significant positive correlation between microstructural
prop-erties and cerebral blood flow values across subjects (Fig 1). The mean values inFig 3were all
extracted from the regions of a significant positive correlation between mean FA and mean CBF values across subjects.
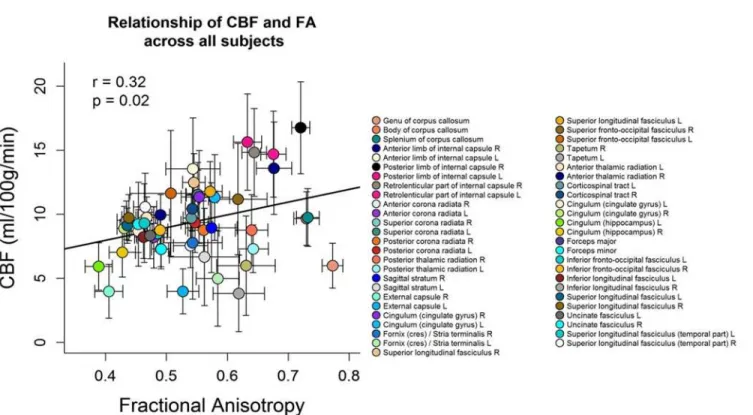
Correlation of microstructural properties with CBF across tracts
Fig 4shows the scatter plot between FA and CBF for the group-averaged data. Each symbol represents data from one WM region averaged over all subjects. The mean FA values of the 51 different WM regions were positively correlated with the mean CBF values across subjects
(Pearson’sr= 0.32,p= 0.02). High FA (>0.6) and high CBF (>12 ml/100g/min) were found
Fig 2. A) Regions of significant negative correlation between CBF and RD values overlaid on the MNI template at x = 60, y = 72, z = 89 (TFCE correctedp<0.05). Regions of significant positive correlation between CBF and RD across subjects are indicated in red (tbss_fill was used here which“thickened”the TBSS results). B) The plot displays the mean RD and CBF values, extracted from each subject in the significant regions indicated in red.
in tracts containing projection fibers which are characterised by mainly large diameter fibers and fast conduction velocity such as the right anterior limb of internal capsule, the bilateral posterior limb of internal capsule and the bilateral retrolenticular part of internal capsule. The internal capsule contains both ascending and descending projection fibers that connect the cor-tex with the spinal cord, such as the corticospinal tract which carries motor information from
the primary motor cortex to the lower motor neurons in the spinal cord [60]. Low FA (<0.5)
and low CBF (<8 ml/100g/min) were found in long association fibers characterized by mainly
small diameter fibers such as the right external capsule, the bilateral cingulum (hippocampus),
the forceps minor and major [61]. The external capsule connects cortical areas with the
puta-men, caudate nucleus, and claustrum [28,62]. The cingulum has fibers projecting from the
cin-gulate gyrus to the entorhinal cortex in the brain, allowing for communication between
components of the limbic system [28]. While the forceps minor connect the frontal lobe areas
through the genu of the corpus callosum, the forceps major associates the occipital areas of both hemispheres through the splenium of the corpus callosum. Additional analyses within each subject showed that in 21 subjects out of 39 the association between CBF and FA across
white matter regions was significantly positive (seeS1 Table).
Discussion
The current study presents the investigation of white matter cerebral blood flow and its rela-tionship to white matter microstructural integrity across subjects, exploring CBF and DTI
Table 3. Summary of the regions including volume (mm), RD (μm2/ms), CBF (ml/100g/min) andtvalues where a significant negative relationship
between CBF and RD values was found across subjects.The values were extracted by masking the respective skeletons with the JHU WM labels and tracts and the significant regions (TFCE correctedp<0.01). The values are listed as mean±standard deviation.
Locations Volume CBF RD Tvalues
Splenium of corpus callosum 85 7.65±6.80 0.48±0.38 2.63
Posterior thalamic radiation (include optic radiation) R 69 9.08±7.10 0.42±0.08 3.09
Forceps major 116 8.71±6.98 0.43±0.34 2.72
doi:10.1371/journal.pone.0150657.t003
Fig 3. The scatterplot displays the mean RD, AD and MD as a function of the mean FA values across subjects, all extracted from the significant regions indicated in red inFig 1.A) The correlation between FA and RD was negative (Pearson’sr= -0.93,p<0.0001). B) The correlation between FA and
AD was positive (Pearson’sr= 0.55,p<0.001). C) The correlation between FA and MD was negative (Pearson’sr= -0.66,p<0.0001).
metrics (FA/MD/AD/RD). Since anisotropic diffusion measured with DTI was shown to be sensitive to barriers and obstacles imposed by microstructural properties such as cell mem-branes, myelin sheaths and microtubules, it was suggested to represent a putative surrogate of microstructural integrity (Beaulieu, 2002). Voxel-wise analysis demonstrated a positive associ-ation of white matter CBF and FA across subjects in circumscribed white matter regions. Thus, subjects who had higher CBF tended to have higher fractional anisotropy in parts of the sple-nium of corpus callosum, the right posterior thalamic radiation (include optic radiation), the forceps major, the right inferior fronto-occipital fasciculus, the right inferior longitudinal
fas-ciculus and the right superior longitudinal fasfas-ciculus (Fig 1andTable 2). Subsequent analyses
demonstrated a negative correlation between CBF in white matter and RD in parts of the sple-nium of corpus callosum, the right posterior thalamic radiation (including the optic radiation) and the forceps major (but no relationship with MD or AD, when correcting for multiple
com-parisons) (Fig 2andTable 3). These findings could not be explained by age, sex, number of
ASL image averages, mean relative displacement (mm), voxel-wise variance in perfusion signal or voxel-wise partial voluming of grey matter. Furthermore, the tract-specific analysis of the relationship between FA and CBF within subjects showed that fiber tracts that had a higher
CBF tended to have a higher anisotropic diffusion (Fig 4andS1 Table).
Our voxel-wise analyses were intended to identify specific locations of a correlation between CBF and anisotropic diffusion of water in white matter tracts across subjects. In order to increase sensitivity, objectivity and interpretability of analysis of multi-subject diffusion imag-ing studies, correlation analysis was limited to an alignment-invariant tract representation (TBSS skeleton). Notably, the identified white matter regions indicated that especially posterior and right-hemispheric white matter structures were the regions with most voxels displaying a
Fig 4. Scatterplot between FA and CBF values.Each symbol represents data from one WM region averaged over all subjects. The error bars indicate the standard deviation over all subjects. The mean FA over all subjects was positively correlated with mean CBF of all subjects across WM regions (Pearson’s
r= 0.32,p= 0.02). The legend on the right side refers to the different WM regions.
positive correlation (Fig 1,Table 2). However, the stringent corrections for multiple compari-sons that are required in this type of analyses may have dismissed regions that showed a less strong association. Indeed, when not correcting for multiple comparisons, positive correlations between white matter CBF and FA as well as negative correlations between white matter CBF
and RD across subjects were observed in widespread WM areas in both hemispheres (seeS9
andS10Figs). Furthermore, uncorrected results for multiple comparisons also showed that
white matter CBF was negatively related to MD and AD in circumscribed regions (seeS11and
S12Figs). We thus suggest that the positive relationship between CBF and white matter
micro-structural integrity most probably does not only apply to the listed regions inTable 2, but
might hold for the whole WM skeleton although to a lesser extent. Nevertheless, the association seems to be stronger in the right hemisphere, which might relate to known anatomic and func-tional lateralization of the human brain. There is evidence that funcfunc-tional differences in
inter-hemispheric coordination might relate to the brain's hierarchical subdivisions [63]. Further,
asymmetry of myelination was documented in posterior superior temporal lobes indicating a
left hemisphere dominance for rapid sensory signal processing [64,65]. Since we analysed
right-handers with 90–95% probability of left hemispheric language dominance [66], the right
hemisphere might display more inter-individual variance in microstructural and functional properties. Indeed, increased right hemispheric inter-individual variance was observed for FA in the current study and might have contributed to stronger associations between CBF and FA across subjects.
Since anisotropic diffusion is based on different microstructural white matter properties (Beaulieu, 2002), the current methods are not suited to disentangle the exact underlying micro-structural properties that contributed to the observed positive relationship between anisotropic
diffusion and CBF in white matter across subjects [67]. Nevertheless, different diffusion metrics
such as RD, MD and AD may provide additional indications about the nature of the relation-ship between CBF and underlying microstructural characteristics in white matter. The positive association between white matter CBF and FA was primarily characterized by a negative corre-lation between white matter CBF and radial diffusivity, in the absence of a significant correla-tion with axial diffusivity or mean diffusivity. When plotting the mean FA values against the mean radial diffusivity, mean diffusivity and axial diffusivity which were extracted from the regions with a significant positive association between white matter CBF and FA across
sub-jects, all values are significantly associated with FA (Fig 3). However, radial diffusivity was
most strongly related to FA compared with mean diffusivity or axial diffusivity (Fig 3A).
Intriguingly, the observation of increased radial diffusivity in absence of axial diffusivity alter-ations has been found in well controlled animal studies of experimentally induced myelin loss
[68,69]. Thus, the current results of a significant relationship between white matter perfusion
and white matter microstructural integrity might be associated with myelination properties of white matter.
Little is known about the neurophysiological mechanisms that may underlie the observed relationship between CBF and microstructural integrity in white matter across subjects. Yet, recent findings on the metabolism of central nervous system white matter indicate that white matter is not only a passive insulator. On the first sight, myelin seems to be an energy-efficient mechanism, by speeding up the process of signal conduction with its insulating characteristics. However, the synthesis of myelin and the maintenance of oligodendrocyte resting potential
were shown to outweigh the energy savings by saltatory impulse propagation [70]. Recent
stud-ies indicate that the axonal energy metabolism is supported by glycolytic oligodendrocytes [34,
71]. The exact mechanism is not yet fully understood but it seems that oligodendrocytes might
was found to be essential for long-term axonal integrity [34]. In summary, recent evidence indicates that myelinating glial cells enable preservation of long-term axonal integrity by detec-tion of axonal energy needs and providing the necessary metabolites.
Interestingly, myelination is affected by the underlying neuronal electrical activity and
increases with the activity of a neuron [32]. Fibers with larger axonal diameter tend to have a
higher myelination in order to function optimally. Fibers with large axons usually have an
increased energy demand to propagate action potentials [72,73]. It is thus possible that axons
with more myelin, larger diameter and more widely spaced nodal gaps might necessitate a
higher metabolic support by oligodendrocytes, depending on their activity [33]. A compelling
study in healthy elderly adults observed an increase in cerebral blood flow of the whole brain after complex cognitive training which was subsequently followed by increases in anisotropic
diffusion [74]. The authors suggested that the task-related activations of the cortex might have
increased myelination, since myelination processes were found to be triggered by neural
activ-ity [75,76]. Moreover, variations of anisotropic diffusion have been associated with
inter-indi-vidual differences in brain activity, cognitive and motor activity performance [29,77–79].
Thus, it is conceivable that individual variation in neuronal activity might have contributed to the currently observed findings of a positive association between FA and CBF in the centre of white matter tracts with least well perfused WM across subjects. However, the exact mecha-nism contributing to a positive association between CBF and anisotropic diffusion across sub-jects can’t be determined with the current data.
In addition, the current results suggest a positive association between FA and CBF across
white matter regions (Fig 4). In 21 subjects out of 39 the association between CBF and FA
across white matter regions was significantly positive (seeS1 Table). Furthermore, when
aver-aging the tract-specific FA and CBF values across subjects, the association between mean FA
and mean CBF values across white matter regions remains positive (Fig 4).
However, the current tract-specific results were at odds with the findings of Aslan and
col-leagues [11], who demonstrated that tracts with a lower FA tended to have a higher perfusion
on average. We suggest that diverging findings might have arisen due to different methodologi-cal approaches, such as the correction for PVE, the quantification of CBF, the post-processing of DTI images and the statistical analyses. Although both studies analysed the relationship between white matter CBF and white matter microstructural integrity, they may not be compa-rable regarding the differing methodological approaches.
Considering the quality of WM perfusion data, a previous study claimed that the measure-ment of CBF in WM was challenging due to limited image resolution and due to signal loss
resulting from long transit times in WM [10]. In white matter, a mean perfusion of 19.7
±2.7ml/100g/min across all subjects was observed which was in accordance with previous
stud-ies [11,80]. Van Osch and colleagues further showed that in WM a significant perfusion signal
was detected in 70% of voxels after 75 averaged ASL images using background suppressed pseudo-continuous ASL, implemented at 3 Tesla with multislice 2D readout after 1525
milli-seconds providing evidence for a reliable detection of ASL signal in WM [15]. In comparison,
the current study observed a significant ASL signal in 70% of WM voxels after 140 averaged ASL images and in 84% after 200 averaged ASL images in one subject using pseudo-continuous
ASL without background suppression (seeS5 Fig). Since differences in the amount of
signifi-cant ASL signal did depend on the number of acquired volumes within the pCASL frame and
the number of acquired volumes differed among subjects, the boxplots inS6 Figshow the
pro-portion of significant perfusion signal for all the subjects as a function of their number of
aver-aged ASL images in GM and in WM (seeS6 Fig). Across subjects, 66.5±12.2% of WM voxels
Several potential limiting factors need to be considered. The choice of post-label delay (PLD) time used in the present study should be discussed in detail, as it could influence the val-ues of CBF in WM. The choice of label duration (i.e. 1.72 sec) and the PLD (i.e. 1.1 sec) sug-gests that signal arriving after 2.82 seconds would be missed. Arrival times in WM are expected to be shorter than this which would not affect the estimation of CBF in WM in this study. However, a shorter than normally recommended PLD could result in greater SNR as signal would be subject to less T1 decay. Moreover, perfusion will be highly dependent on the arrival time of blood: only arrival times less than the PLD will fall in the region of the kinetic curve that would be minimally sensitive to arrival time. For pCASL arrival times exceeding 1 second
would be quite normal and even longer in WM [81].
In order to investigate the effect of PLD on ASL signal in white matter, we performed
addi-tional ASL measurements in five subjects with three different PLD times (seeS16 Fig). We
used the same MRI setting for ASL measurement with PLD = 1100 ms, 1525 ms and 1900 ms. We observed that PLD did not significantly affect CBF values within the same white matter
regions as presented inFig 1. We additionally calculated the SNR of ASL signal in the same
white matter regions as mentioned above for each PLD (seeS17 Fig) and again found no
signif-icant effect of the chosen PLD neither on SNR nor on the ASL. Thus, the additional analyses showed that CBF, SNR and variance were not affected substantially by longer PLD keeping all
other MRI settings constant (seeS16 Fig). Although the recommendations of sequence settings
for optimal data acquisition to measure CBF in WM involve higher PLD values than used in
the present study [38], we observed ASL signal significantly different from zero and sufficiently
high SNR within the significant regions which could not be significantly increased merely by
choosing a longer PLD (SeeS5andS6Figs, andS17 Fig). This is in accordance with the
find-ings of Van Osch and colleagues showing that 10 min scanning resulted in significant perfusion signal in 70% of WM voxels, but increasing the labeling and delay time did not lead to a higher
percentage [15].
Limitations included the fact that for the quantification of CBF with ASL data, certain stan-dard parameters such as the blood-water partition coefficient, arterial blood relaxation time
and labeling efficiency might have been influenced by the tissue type (WM/GM) [48],
subjec-tive factors such as scanner stability, brain region, gender and age, sleep wake cycles, psychoac-tive substances etc. E.g. sex might differentially contribute to partial voluming effects due to the differences in head size between men and women and consequently affect the results. The
scat-terplot inS13 Figshows the relationship between CBF and FA in white matter for men and
women separately. Although post-hoc analyses showed that gender did not significantly affect the linear regression model between CBF and FA, such nuisance variables were included if pos-sible as covariates in the TBSS analyses (age, sex, number of ASL averages). On the other hand, other nuisance variables were fixed such as the time of MRI to morning hours, or asking the subjects to refrain from psychoactive substances (coffee, alcohol) for at least 12 h before
mea-surement. Since ASL has an inherently lower spatial resolution (~3,6 x 3,6 x 7mm3) than DTI
(~2 x 2 x 2 mm3) and high-resolution T1-weighted data (1 x 1 x 1 mm3), partial voluming
effects might have occurred in the current study. Thus, partial voluming effects were dealt with in different ways. First, a rigorous estimation of partial voluming with a fast and robust param-eter estimation for statistical partial volume models was implemented and used for ASL data (seeS1 Fig) [45]. Second, the calibration of CBF was corrected for partial voluming effects. Since grey and white matter have very different kinetics a normal quantification will provide a CBF that is something of a combination of the two tissue types (WM tends to have lower CBF and longer arrival time than GM). With BASIL it was possible to correct the perfusion estima-tion for the different tissue types using Bayesian inference method for the kinetic model
“core”of WM tracts, since TBSS projects the local highest FA values onto an alignment
invari-ant tract representation (the FA skeleton) [35]. The mean FA skeleton was thresholded at a FA
value of 0.3 (seeDTI data processing), ensuring that voxels which are primarily grey matter or
cerebrospinal fluid are successfully excluded and that the FA skeleton does not extend to the
outermost edges of the cortex [35]. Fourth, we corrected for GM partial voluming on a
voxel-wise basis in all the statistical analyses carried out with TBSS by entering grey matter masks as
individual voxel-wise regressors into the statistical model (seeStatistical analysis). A further
limitation consists of the assumptions on the basis of anisotropy and the underlying micro-structural properties such as myelination and axonal diameter which are difficult to verify within the current DTI parameters. Additional high-resolution and multishell high-angular resolution schemes as well as track-density imaging may provide more information about
axo-nal density, axon diameter distribution and mean axoaxo-nal diameter [82].
In conclusion, the current study provided evidence that the blood perfusion in white matter is positively related to anisotropic diffusion across subjects. The coupling between WM perfu-sion and WM microstructure might be explained by individual differences in microstructural properties such as myelination. The physiology of white matter could be of interest in clinical research such as schizophrenia or multiple sclerosis.
Supporting Information
S1 Fig. Segmentation of GM and WM and registration to ASL space.Whole brain (grey scale), grey matter (green) and white matter (blue) masks are shown within the resolution of the T1-weighted image (A, B, C) and after registration to the ASL image (D, E, F, G, H). The masks are shown before (E, F) and after the application of a threshold (G, H). The threshold that was applied to the grey matter mask was 0.4, whereas it was 0.7 for the white matter mask. (DOCX)
S2 Fig. CBF quantification and SNR.The left column shows the axial view of one subject’s brain in the resolution of an ASL image at z = 4 including the respective colour scales. The right column displays the plots for all the values of the x axis of the same brain at z = 4 and y = 74. The first two rows depicts the GM and WM probability maps as extracted after segmen-tation. Fourth and fifth rows shows cerebral blood flow (CBF) in ml/100g/min for GM and for WM. Six and seventh rows shows the signal to noise ratio (SNR) for the whole slice and for WM. The ability to detect WM perfusion signal in the current ASL data was assessed and pre-sented in the supplementary material according to a previous study (van Osch et al., 2009). On one hand, we probed for the development of the significant perfusion signal in GM and WM as a function of 200 signal averages within a subject. On the other hand each subjects´ significant perfusion signal in WM and GM as a function of the number of signal averages was assessed.
Significant perfusion signal was defined as a significantly (p<0.05) different signal from zero
for the ASL difference images (control-label) implemented with a non-parametric one-sample t-test in Randomise program of FSL 5.0 (Andersson and Robinson, 2001).
(DOCX)
S3 Fig. Motion parameter estimation.The relative voxel displacement root mean square (RMS) in mm (average of rotation and translation parameter differences) is shown as a func-tion of the ASL timeseries. This frame displacement RMS was averaged over the number of subjects (n) within the session.
(DOCX)
(MRD) in mm. The 39 subjects that are included in the statistical analyses are displayed in light green. The 4 subjects that were excluded from the statistical analyses because of their low CBF in GM are displayed in light pink.
(DOCX)
S5 Fig. ASL signal as a function of the number of averaged CBF images.The percentage of grey (dashed line) and white matter (solid line) voxels that show the presence of a statistically significant signal as a function of ASL averages within one subject. The percentage of voxels that show a statistically significant ASL signal larger than 0 for grey matter and white matter is shown as a function of the number of 200 averaged ASL images within one subject. 80% of GM voxels reach a significant ASL signal after 50 averaged ASL images and 93% of GM voxels after 200 averaged ASL images. WM has a lower percentage of voxels with significant ASL signal with 50% after 50 averaged ASL images, but finally reaches 84% after 200 averaged ASL images.
(DOCX)
S6 Fig. Proportion of significant voxels.The percentage of grey matter (left) and white matter (right) voxels that show the presence of a statistically significant signal as a function of number of averaged ASL images. The percentage of voxels with significant ASL signal in relation to the number of ASL signal averages for WM and GM. In 6 subjects 50 timeseries were recorded, in 27 subjects 100, in one subject 150 and in 5 subjects 200 timeseries were acquired. It can be seen that with a higher number of ASL signal averages also the proportion of voxels with a sig-nificant ASL signal increases.
(DOCX)
S7 Fig. CBF and SNR as a function of ASL averages.This figure shows ASL related metrics in function of the number for ASL images. In the top row, CBF is shown for GM (left) and for WM (right) as a function of the number for ASL images. The bottom row shows the signal to noise ratio for GM (left) and WM (right) as a function of the number for ASL images. (DOCX)
S8 Fig. Plots of subregions ofFig 1.Scatter plots of the mean FA and mean CBF values across subjects within the subregions of the significant positive correlation between CBF and FA
across subjects (seeFig 1,Table 2). The subregions were based on John Hopkins University
(JHU) WM labels and tracts atlases. Since these atlas labels do not cover the whole region of the observed significant relationship between CBF and FA across subjects, the values might
dif-fer slightly from the plot inFig 1.
(DOCX)
S9 Fig. TBSS results uncorrected for multiple comparisons for FA.A) Regions of significant positive correlation between CBF and FA values overlaid on the MNI template at x = 83,
y = 109, z = 98 (TFCE p<0.05). B) The scatterplot displays the mean FA and CBF values,
extracted from each subject in the significant regions indicated in red (tbss_fill was used here
which“thickened”the TBSS results).
(DOCX)
S10 Fig. TBSS results uncorrected for multiple comparisons for RD.A) Regions of signifi-cant negative correlation between CBF and RD values overlaid on the MNI template at x = 104,
y = 104, z = 84 (TFCEp<0.05). B) The scatterplot displays the mean RD and CBF values,
extracted from each subject in the significant regions indicated in red (tbss_fill was used here
which“thickened”the TBSS results).
S11 Fig. TBSS results uncorrected for multiple comparisons for MD.A) Regions of signifi-cant negative correlation between CBF and MD values overlaid on the MNI template at
x = 104, y = 104, z = 84 (TFCEp<0.05). B) The scatterplot displays the mean MD and CBF
values, extracted from each subject in the significant regions indicated in red (tbss_fill was used
here which“thickened”the TBSS results).
(DOCX)
S12 Fig. TBSS results uncorrected for multiple comparisons for AD.A) Regions of signifi-cant negative correlation between CBF and AD values overlaid on the MNI template at
x = 117, y = 104, z = 99 (TFCEp<0.05). B) The scatterplot displays the mean AD and CBF
values, extracted from each subject in the significant regions indicated in red (tbss_fill was used
here which“thickened”the TBSS results).
(DOCX)
S13 Fig. Relationship between CBF and FA across subjects: effect of gender.Significant
pos-itive correlation between mean CBF and FA values (TFCE corrected p<0.05) as it is shown in
Fig 1shown for women (in red) and men (in blue) separately. A post-hoc analysis of variance of linear model fits showed that the comparison of the two models (model 1 where CBF is modelled by FA values only and model 2 where CBF values are modelled by FA values and gen-der) did not differ significantly (p = 0.211, F (36, 37) = 1.62).
(DOCX)
S14 Fig. SNR signal characteristics.This figure shows the SNR for pure GM, pure WM and for the ASL signal that was extracted for the regions of significant positive correlation between
CBF and FA values (regions fromFig 1). The tissue classes were corrected for possible
con-founding effects originated by partial volume effects. (DOCX)
S15 Fig. Control-label difference.This figure shows the difference values from the subtraction between control and label images for pure GM, pure WM and for the ASL signal that was extracted for the regions of significant positive correlation between CBF and FA values (regions fromFig 1). The tissue classes were corrected for possible confounding effects originated by partial volume effects. These difference values are the input parameters for the CBF quantifica-tionΔM in the equation of page 7.
(DOCX)
S16 Fig. CBF values for 3 different postlabel delay values.This figure shows the CBF values for the additional measure on five subjects with three different values of post-label delay time (1100 ms, 1525 ms and 1900 ms). The CBF values in deep WM shows week dependency on PLD demonstrating that the extracted CBF values with short PLD are slightly underestimated as compared to CBF values with higher PLD, however. Testing the linear model that CBF esti-mation depends on PLD yields the slope not to be different from zero [t(38) = 1.155; p = 0.188] (in WM–PVE corrected) and [t(38) = 1.259; p = 0.174] in corpus callosum.
(DOCX)
S17 Fig. SNR values for 3 different postlabel delay values.This figure shows the SNR for the additional measure on five subjects with three different values of post-label delay time (1100 ms, 1525 ms and 1900 ms). The SNR values of WM (PVE) shows no dependency on PLD. Testing the linear model that SNR depends on PLD yields the slope not to be different from zero [t(38) = .487; p = 0.627].
S1 Table. Relationship of CBF and FA across white matter regions for all subjects. Relation-ship between FA and CBF across fiber tracts for each subject. Pearson’s R with p-value is reported. A positive correlation is observed in all subjects—in 21 from 39 subjects the positive correlation is significant. The WM regions are based on the John Hopkins University (JHU)-ICBM-DTI-81 WM labels atlas (48 labels) and the JHU-WM tractography atlasv (20 tracts) in
MNI space [58,59]. Since the ASL image did not cover the lower parts of the brain, the values
which are displayed comprise the following 51 WM regions: the genu of corpus callosum, the body of corpus callosum, the splenium of corpus callosum, the bilateral anterior limb of inter-nal capsule, the bilateral posterior limb of interinter-nal capsule, the bilateral retrolenticular part of internal capsule, the bilateral anterior corona radiata, the bilateral superior corona radiata, the bilateral posterior corona radiata, the bilateral posterior thalamic radiation, the bilateral sagittal stratum, the bilateral external capsule, the bilateral cingulum (cingulate gyrus), the bilateral for-nix (cres) / Stria terminalis, the bilateral superior longitudinal fasciculus, the bilateral superior fronto-occipital fasciculus, the bilateral tapetum, the bilateral anterior thalamic radiation, the bilateral corticospinal tract, the bilateral cingulum (cingulate gyrus), the bilateral cingulum (hippocampus) the forceps major and minor, the bilateral inferior fronto-occipital fasciculus, the bilateral inferior longitudinal fasciculus, the bilateral superior longitudinal fasciculus, the bilateral uncinate fasciculus, the bilateral superior longitudinal fasciculus (temporal part). (DOCX)
Acknowledgments
This work was supported by a grant from the Swiss National Science Foundation (32003B_124947).
Author Contributions
Conceived and designed the experiments: LMS SW AF. Performed the experiments: MSF LMS SW AF RW SG JA TD. Analyzed the data: MSF LMS SW AF RW SG JA TD. Contributed reagents/materials/analysis tools: MSF LMS SW AF RW SG JA TD. Wrote the paper: MSF LMS SW AF RW SG JA TD.
References
1. Nolte N. The Human Brain. Mosby, MO, USA1999.
2. Nave KA. Myelination and the trophic support of long axons. Nature reviews Neuroscience. 2010; 11 (4):275–83. doi:10.1038/nrn2797PMID:20216548
3. Hartline DK. What is myelin? Neuron glia biology. 2008; 4(2):153–63. doi:10.1017/ S1740925X09990263PMID:19737435
4. Hartline DK, Colman DR. Rapid conduction and the evolution of giant axons and myelinated fibers. Cur-rent biology: CB. 2007; 17(1):R29–35. PMID:17208176
5. Johansen-Berg H. Behavioural relevance of variation in white matter microstructure. Current opinion in neurology. 2010; 23(4):351–8. doi:10.1097/WCO.0b013e32833b7631PMID:20581685
6. Walther S, Hugli S, Hofle O, Federspiel A, Horn H, Bracht T, et al. Frontal white matter integrity is related to psychomotor retardation in major depression. Neurobiology of disease. 2012; 47(1):13–9. doi:10.1016/j.nbd.2012.03.019PMID:22426387
7. Bracht T, Federspiel A, Schnell S, Horn H, Hofle O, Wiest R, et al. Cortico-cortical white matter motor pathway microstructure is related to psychomotor retardation in major depressive disorder. PloS one. 2012; 7(12):e52238. doi:10.1371/journal.pone.0052238PMID:23284950
8. Federspiel A, Begre S, Kiefer C, Schroth G, Strik WK, Dierks T. Alterations of white matter connectivity in first episode schizophrenia. Neurobiology of disease. 2006; 22(3):702–9. PMID:16624566
10. van Gelderen P, de Zwart JA, Duyn JH. Pittfalls of MRI measurement of white matter perfusion based on arterial spin labeling. Magnetic resonance in medicine: official journal of the Society of Magnetic Resonance in Medicine / Society of Magnetic Resonance in Medicine. 2008; 59(4):788–95.
11. Aslan S, Huang H, Uh J, Mishra V, Xiao G, van Osch MJ, et al. White matter cerebral blood flow is inversely correlated with structural and functional connectivity in the human brain. NeuroImage. 2011; 56(3):1145–53. doi:10.1016/j.neuroimage.2011.02.082PMID:21385618
12. Haller S, Pereira VM, Lazeyras F, Vargas MI, Lovblad KO. Magnetic resonance imaging techniques in white matter disease: potentials and limitations. Topics in magnetic resonance imaging: TMRI. 2009; 20(6):301–12. doi:10.1097/RMR.0b013e318207a5a9PMID:21187723
13. Basser PJ, Mattiello J, LeBihan D. MR diffusion tensor spectroscopy and imaging. Biophysical journal. 1994; 66(1):259–67. PMID:8130344
14. Williams DS, Detre JA, Leigh JS, Koretsky AP. Magnetic resonance imaging of perfusion using spin inversion of arterial water. Proceedings of the National Academy of Sciences of the United States of America. 1992; 89(1):212–6. PMID:1729691
15. van Osch MJ, Teeuwisse WM, van Walderveen MA, Hendrikse J, Kies DA, van Buchem MA. Can arte-rial spin labeling detect white matter perfusion signal? Magnetic resonance in medicine: official journal of the Society of Magnetic Resonance in Medicine / Society of Magnetic Resonance in Medicine. 2009; 62(1):165–73.
16. Wu WC, Lin SC, Wang DJ, Chen KL, Li YD. Measurement of cerebral white matter perfusion using pseudocontinuous arterial spin labeling 3T magnetic resonance imaging—an experimental and theo-retical investigation of feasibility. PloS one. 2013; 8(12):e82679. doi:10.1371/journal.pone.0082679 PMID:24324822
17. Wu WC, Fernandez-Seara M, Detre JA, Wehrli FW, Wang J. A theoretical and experimental investiga-tion of the tagging efficiency of pseudocontinuous arterial spin labeling. Magnetic resonance in medi-cine: official journal of the Society of Magnetic Resonance in Medicine / Society of Magnetic Resonance in Medicine. 2007; 58(5):1020–7.
18. Amann M, Achtnichts L, Hirsch JG, Naegelin Y, Gregori J, Weier K, et al. 3D GRASE arterial spin label-ling reveals an inverse correlation of cortical perfusion with the white matter lesion volume in MS. Multi-ple sclerosis. 2012; 18(11):1570–6. doi:10.1177/1352458512441984PMID:22466702
19. Kimura N, Nakama H, Nakamura K, Aso Y, Kumamoto T. Effect of white matter lesions on brain perfu-sion in Alzheimer's disease. Dementia and geriatric cognitive disorders. 2012; 34(3–4):256–61. doi:10. 1159/000345184PMID:23183589
20. Maclullich AM, Ferguson KJ, Reid LM, Deary IJ, Starr JM, Seckl JR, et al. Higher systolic blood pres-sure is associated with increased water diffusivity in normal-appearing white matter. Stroke; a journal of cerebral circulation. 2009; 40(12):3869–71. doi:10.1161/STROKEAHA.109.547877PMID:19850898
21. Kennedy KM, Raz N. Pattern of normal age-related regional differences in white matter microstructure is modified by vascular risk. Brain research. 2009; 1297:41–56. doi:10.1016/j.brainres.2009.08.058 PMID:19712671
22. Nitkunan A, Charlton RA, McIntyre DJ, Barrick TR, Howe FA, Markus HS. Diffusion tensor imaging and MR spectroscopy in hypertension and presumed cerebral small vessel disease. Magnetic resonance in medicine: official journal of the Society of Magnetic Resonance in Medicine / Society of Magnetic Reso-nance in Medicine. 2008; 59(3):528–34.
23. ten Dam VH, van den Heuvel DM, de Craen AJ, Bollen EL, Murray HM, Westendorp RG, et al. Decline in total cerebral blood flow is linked with increase in periventricular but not deep white matter hyperin-tensities. Radiology. 2007; 243(1):198–203. PMID:17329688
24. Bastos-Leite AJ, Kuijer JP, Rombouts SA, Sanz-Arigita E, van Straaten EC, Gouw AA, et al. Cerebral blood flow by using pulsed arterial spin-labeling in elderly subjects with white matter hyperintensities. AJNR American journal of neuroradiology. 2008; 29(7):1296–301. doi:10.3174/ajnr.A1091PMID: 18451090
25. Roman GC, Erkinjuntti T, Wallin A, Pantoni L, Chui HC. Subcortical ischaemic vascular dementia. Lan-cet neurology. 2002; 1(7):426–36. PMID:12849365
26. Brown WR, Thore CR. Review: cerebral microvascular pathology in ageing and neurodegeneration. Neuropathology and applied neurobiology. 2011; 37(1):56–74. doi:10.1111/j.1365-2990.2010.01139.x PMID:20946471
27. Moody DM, Bell MA, Challa VR. Features of the cerebral vascular pattern that predict vulnerability to perfusion or oxygenation deficiency: an anatomic study. AJNR American journal of neuroradiology. 1990; 11(3):431–9. PMID:2112304
29. Scholz J, Klein MC, Behrens TE, Johansen-Berg H. Training induces changes in white-matter architec-ture. Nature neuroscience. 2009; 12(11):1370–1. doi:10.1038/nn.2412PMID:19820707
30. Hihara S, Notoya T, Tanaka M, Ichinose S, Ojima H, Obayashi S, et al. Extension of corticocortical afferents into the anterior bank of the intraparietal sulcus by tool-use training in adult monkeys. Neurop-sychologia. 2006; 44(13):2636–46. PMID:16427666
31. Ullen F. Is activity regulation of late myelination a plastic mechanism in the human nervous system? Neuron glia biology. 2009; 5(1–2):29–34. doi:10.1017/S1740925X09990330PMID:19785923
32. Demerens C, Stankoff B, Logak M, Anglade P, Allinquant B, Couraud F, et al. Induction of myelination in the central nervous system by electrical activity. Proceedings of the National Academy of Sciences. 1996; 93(18):9887–92.
33. Saab AS, Tzvetanova ID, Nave KA. The role of myelin and oligodendrocytes in axonal energy metabo-lism. Current opinion in neurobiology. 2013; 23(6):1065–72. doi:10.1016/j.conb.2013.09.008PMID: 24094633
34. Lee Y, Morrison BM, Li Y, Lengacher S, Farah MH, Hoffman PN, et al. Oligodendroglia metabolically support axons and contribute to neurodegeneration. Nature. 2012; 487(7408):443–8. doi:10.1038/ nature11314PMID:22801498
35. Smith SM, Jenkinson M, Johansen-Berg H, Rueckert D, Nichols TE, Mackay CE, et al. Tract-based spatial statistics: voxelwise analysis of multi-subject diffusion data. NeuroImage. 2006; 31(4):1487– 505. PMID:16624579
36. Deichmann R, Schwarzbauer C, Turner R. Optimisation of the 3D MDEFT sequence for anatomical brain imaging: technical implications at 1.5 and 3 T. NeuroImage. 2004; 21(2):757–67. PMID: 14980579
37. Dai W, Garcia D, de Bazelaire C, Alsop DC. Continuous flow-driven inversion for arterial spin labeling using pulsed radio frequency and gradient fields. Magnetic resonance in medicine: official journal of the Society of Magnetic Resonance in Medicine / Society of Magnetic Resonance in Medicine. 2008; 60 (6):1488–97.
38. Alsop DC, Detre JA, Golay X, Gunther M, Hendrikse J, Hernandez-Garcia L, et al. Recommended implementation of arterial spin-labeled perfusion MRI for clinical applications: A consensus of the ISMRM perfusion study group and the European consortium for ASL in dementia. Magnetic resonance in medicine: official journal of the Society of Magnetic Resonance in Medicine / Society of Magnetic Resonance in Medicine. 2014.
39. Smith SM, Jenkinson M, Woolrich MW, Beckmann CF, Behrens TE, Johansen-Berg H, et al. Advances in functional and structural MR image analysis and implementation as FSL. NeuroImage. 2004; 23 Suppl 1:S208–19. PMID:15501092
40. Smith SM. Fast robust automated brain extraction. Human brain mapping. 2002; 17(3):143–55. PMID: 12391568
41. Andersson JLR, Jenkinson M, Smith S. Non-linear optimisationwww.fmrib.ox.ac.uk/analysis/ techrep2007a.
42. Andersson JLR, Jenkinson M, Smith S. Non-linear registration, aka Spatial normalisation FMRIB tech-nical report TR07JA2www.fmrib.ox.ac.uk/analysis/techrep2007b.
43. Rueckert D, Sonoda LI, Hayes C, Hill DLG, Leach MO, Hawkes DJ. Non-rigid registration using free-form defree-formations: Application to breast MR images. IEEE Trans Med Imaging. 1999; 18(8):712–21. PMID:10534053
44. Manjon JV, Tohka J, Garcia-Marti G, Carbonell-Caballero J, Lull JJ, Marti-Bonmati L, et al. Robust MRI brain tissue parameter estimation by multistage outlier rejection. Magnetic resonance in medicine: offi-cial journal of the Society of Magnetic Resonance in Medicine / Society of Magnetic Resonance in Med-icine. 2008; 59(4):866–73.
45. Tohka J, Zijdenbos A, Evans A. Fast and robust parameter estimation for statistical partial volume mod-els in brain MRI. NeuroImage. 2004; 23(1):84–97. PMID:15325355
46. Jenkinson M, Bannister P, Brady M, Smith S. Improved optimization for the robust and accurate linear registration and motion correction of brain images. NeuroImage. 2002; 17(2):825–41. PMID:12377157
47. Chappell M, Groves AR, Whitcher B, Woolrich MW. Variational Bayesian inference for a non-linear for-ward model. IEEE Transactions on Signal Processing. 2009; 57(1):223–36.
48. Herscovitch P, Raichle ME. What is the correct value for the brain—blood partition coefficient for water? Journal of cerebral blood flow and metabolism: official journal of the International Society of Cerebral Blood Flow and Metabolism. 1985; 5(1):65–9.
50. Aslan S, Lu H. On the sensitivity of ASL MRI in detecting regional differences in cerebral blood flow. Magnetic resonance imaging. 2010; 28(7):928–35. doi:10.1016/j.mri.2010.03.037PMID:20423754
51. Chappell MA, Groves AR, MacIntosh BJ, Donahue MJ, Jezzard P, Woolrich MW. Partial volume correc-tion of multiple inversion time arterial spin labeling MRI data. Magnetic resonance in medicine: official journal of the Society of Magnetic Resonance in Medicine / Society of Magnetic Resonance in Medi-cine. 2011; 65(4):1173–83.
52. Asllani I, Borogovac A, Brown TR. Regression algorithm correcting for partial volume effects in arterial spin labeling MRI. Magnetic resonance in medicine: official journal of the Society of Magnetic Reso-nance in Medicine / Society of Magnetic ResoReso-nance in Medicine. 2008; 60(6):1362–71.
53. Jenkinson M, Smith S. A global optimisation method for robust affine registration of brain images. Medi-cal image analysis. 2001; 5(2):143–56. PMID:11516708
54. Andersson MJ, Robinson J. Permutation Tests for Linear Models. Aust N Z J Stat. 2001; 43(1):75–88.
55. Nichols TE, Holmes AP. Nonparametric Permutation Tests for Functional Neuroimaging: A Primer with Examples. Human brain mapping. 2002; 15:1–25. PMID:11747097
56. Oakes TR, Fox AS, Johnstone T, Chung MK, Kalin N, Davidson RJ. Integrating VBM into the General Linear Model with voxelwise anatomical covariates. NeuroImage. 2007; 34(2):500–8. PMID:17113790
57. Smith SM, Nichols TE. Threshold-free cluster enhancement: addressing problems of smoothing, threshold dependence and localisation in cluster inference. NeuroImage. 2009; 44(1):83–98. doi:10. 1016/j.neuroimage.2008.03.061PMID:18501637
58. Mazziotta JC, Toga AW, Evans A, Fox P, Lancaster J. A probabilistic atlas and reference system for the human brain: International Consortium for Brain Mapping (ICBM). Phil Trans R Soc Lond B. 2001; 356(1412):1293–322.
59. Mori S, Wakana S, Nagae-Poetscher LM, Van Zijl PCM. MRI Atlas of Human White Matter. Amster-dam: Elsevier; 2005. 284 p.
60. Pendlebury S, Blamire A, Lee M, Styles P, Matthews P. Axonal injury in the internal capsule correlates with motor impairment after stroke. Stroke; a journal of cerebral circulation. 1999; 30(5):956–62. PMID: 10229727
61. Aboitiz F, Scheibel AB, Fisher RS, Zaidel E. Fiber composition of the human corpus callosum. Brain research. 1992; 598(1–2):143–53. PMID:1486477
62. Schmahmann JD, Pandya D. Fiber pathways of the brain: Oxford University Press; 2009.
63. Stark DE, Margulies DS, Shehzad ZE, Reiss P, Kelly AM, Uddin LQ, et al. Regional variation in inter-hemispheric coordination of intrinsic hemodynamic fluctuations. The Journal of neuroscience: the offi-cial journal of the Society for Neuroscience. 2008; 28(51):13754–64.
64. Anderson B, Southern BD, Powers RE. Anatomic asymmetries of the posterior superior temporal lobes: a postmortem study. Neuropsychiatry Neuropsychol Behav Neurol. 1999; 12(4):247–54. PMID: 10527109
65. Lebel C, Beaulieu C. Lateralization of the arcuate fasciculus from childhood to adulthood and its relation to cognitive abilities in children. Human brain mapping. 2009; 30(11):3563–73. doi:10.1002/hbm. 20779PMID:19365801
66. Knecht S, Drager B, Deppe M, Bobe L, Lohmann H, Floel A, et al. Handedness and hemispheric lan-guage dominance in healthy humans. Brain. 2000; 123 Pt 12:2512–8. PMID:11099452
67. Wheeler-Kingshott CA, Cercignani M. About "axial" and "radial" diffusivities. Magnetic resonance in medicine: official journal of the Society of Magnetic Resonance in Medicine / Society of Magnetic Reso-nance in Medicine. 2009; 61(5):1255–60.
68. Song SK, Sun SW, Ju WK, Lin SJ, Cross AH, Neufeld AH. Diffusion tensor imaging detects and differ-entiates axon and myelin degeneration in mouse optic nerve after retinal ischemia. NeuroImage. 2003; 20(3):1714–22. PMID:14642481
69. Song S- K, Sun S- W, Ramsbottom MJ, Chang C, Russell J, Cross AH. Dysmyelination revealed through MRI as increased radial (but unchanged axial) diffusion of water. NeuroImage. 2002; 17 (3):1429–36. PMID:12414282
70. Harris JJ, Attwell D. The energetics of CNS white matter. The Journal of neuroscience: the official jour-nal of the Society for Neuroscience. 2012; 32(1):356–71.
71. Funfschilling U, Supplie LM, Mahad D, Boretius S, Saab AS, Edgar J, et al. Glycolytic oligodendrocytes maintain myelin and long-term axonal integrity. Nature. 2012; 485(7399):517–21. doi:10.1038/ nature11007PMID:22622581
73. Ramon F, Joyner R, Moore J. Propagation of action potentials in inhomogeneous axon regions. Mem-branes, Ions, and Impulses: Springer; 1975. p. 85–100.
74. Chapman SB, Aslan S, Spence JS, Hart JJ, Bartz EK, Didehbani N, et al. Neural Mechanisms of Brain Plasticity with Complex Cognitive Training in Healthy Seniors. Cerebral cortex. 2013.
75. Bradl M, Lassmann H. Oligodendrocytes: biology and pathology. Acta neuropathologica. 2010; 119 (1):37–53. doi:10.1007/s00401-009-0601-5PMID:19847447
76. Gyllensten L, Malmfors T. Myelinization of the optic nerve and its dependence on visual function—a quantitative investigation in mice. Journal of embryology and experimental morphology. 1963; 11:255– 66. PMID:13963537
77. Jann K, Federspiel A, Giezendanner S, Andreotti J, Kottlow M, Dierks T, et al. Linking brain connectivity across different time scales with electroencephalogram, functional magnetic resonance imaging, and diffusion tensor imaging. Brain connectivity. 2012; 2(1):11–20. doi:10.1089/brain.2011.0063PMID: 22574926
78. Tuch DS, Salat DH, Wisco JJ, Zaleta AK, Hevelone ND, Rosas HD. Choice reaction time performance correlates with diffusion anisotropy in white matter pathways supporting visuospatial attention. Pro-ceedings of the National Academy of Sciences of the United States of America. 2005; 102(34):12212– 7. PMID:16103359
79. Walther S, Federspiel A, Horn H, Wiest R, Dierks T, Strik W, et al. White matter integrity associated with volitional motor activity. Neuroreport. 2010; 21(5):381–5. doi:10.1097/WNR.0b013e328337ca29 PMID:20164815
80. Ye FQ, Berman KF, Ellmore T, Esposito G, van Horn JD, Yang Y, et al. H(2)(15)O PET validation of steady-state arterial spin tagging cerebral blood flow measurements in humans. Magnetic resonance in medicine: official journal of the Society of Magnetic Resonance in Medicine / Society of Magnetic Reso-nance in Medicine. 2000; 44(3):450–6.
81. Liu P, Uh J, Devous MD, Adinoff B, Lu H. Comparison of relative cerebral blood flow maps using pseudo-continuous arterial spin labeling and single photon emission computed tomography. NMR Biomed. 2012; 25(5):779–86. doi:10.1002/nbm.1792PMID:22139764