www.biogeosciences.net/13/1105/2016/ doi:10.5194/bg-13-1105-2016
© Author(s) 2016. CC Attribution 3.0 License.
Influence of mesoscale eddies on the distribution of nitrous oxide in
the eastern tropical South Pacific
Damian L. Arévalo-Martínez1, Annette Kock1, Carolin R. Löscher1,2, Ruth A. Schmitz2, Lothar Stramma1, and Hermann W. Bange1
1GEOMAR Helmholtz Centre for Ocean Research Kiel, Düsternbrooker Weg 20, 24105 Kiel, Germany
2Institute of Microbiology, Christian Albrechts University of Kiel, Am Botanischen Garten 1–9, 24118 Kiel, Germany
Correspondence to:Damian L. Arévalo-Martínez ([email protected])
Received: 5 May 2015 – Published in Biogeosciences Discuss.: 19 June 2015
Revised: 3 February 2016 – Accepted: 11 February 2016 – Published: 23 February 2016
Abstract.Recent observations in the eastern tropical South Pacific (ETSP) have shown the key role of meso- and subme-soscale processes (e.g. eddies) in shaping its hydrographic and biogeochemical properties. Off Peru, elevated primary production from coastal upwelling in combination with slug-gish ventilation of subsurface waters fuels a prominent oxy-gen minimum zone (OMZ). Given that nitrous oxide (N2O)
production–consumption processes in the water column are sensitive to oxygen (O2)concentrations, the ETSP is a region
of particular interest to investigate its source–sink dynamics. To date, no detailed surveys linking mesoscale processes and N2O distributions as well as their relevance to nitrogen (N)
cycling are available. In this study, we present the first mea-surements of N2O across three mesoscale eddies (two mode
water or anticyclonic and one cyclonic) which were identi-fied, tracked, and sampled during two surveys carried out in the ETSP in November–December 2012. A two-peak struc-ture was observed for N2O, wherein the two maxima
coin-cide with the upper and lower boundaries of the OMZ, indi-cating active nitrification and partial denitrification. This was further supported by the abundances of the key gene for ni-trification, ammonium monooxygenase(amoA), and the gene
marker for N2O production during denitrification, nitrite
re-ductase(nirS). Conversely, we found strong N2O depletion
in the core of the OMZ (O2< 5 µmol L−1)to be consistent
with nitrite (NO−
2) accumulation and low levels of nitrate
(NO−
3), thus suggesting active denitrification. N2O depletion
within the OMZ’s core was substantially higher in the centre of mode water eddies, supporting the view that eddy activ-ity enhances N-loss processes off Peru, in particular near the shelf break where nutrient-rich, productive waters from
up-welling are trapped before being transported offshore. Analy-sis of eddies during their propagation towards the open ocean showed that, in general, “ageing” of mesoscale eddies tends to decrease N2O concentrations through the water column in
response to the reduced supply of material to fuel N loss, al-though hydrographic variability might also significantly im-pact the pace of the production–consumption pathways for N2O. Our results evidence the relevance of mode water
ed-dies for N2O distribution, thereby improving our
understand-ing of the N-cyclunderstand-ing processes, which are of crucial impor-tance in times of climate change and ocean deoxygenation.
1 Introduction
Nitrous oxide (N2O) is an atmospheric trace gas which
strongly affects Earth’s climate both by contributing to the greenhouse effect and by its role as a major ozone-depleting substance (Ravishankara et al., 2009; Myhre et al., 2013). The ocean is a net source of N2O to the atmosphere,
ac-counting for about one-third of the total natural source (Myhre et al., 2013); therefore, the investigation of its for-mation pathways under changing oceanic regimes is rel-evant for any future predictions of how the nitrogen (N) cycle will react to future climate change. N2O is mainly
produced by microbial nitrification and denitrification, with particularly high yields under low-oxygen (O2) conditions
formed and maintained by the close coupling between ele-vated primary production fuelled by coastal upwelling and weak ventilation of intermediate waters (Karstensen et al., 2008). Hence, elevated production of N2O in subsurface
low-O2 waters in conjunction with their transport towards the
surface makes the ETSP a “hotspot” for emissions of this climate-relevant gas to the atmosphere (Arévalo-Martínez et al., 2015). However, even though N2O production in low-O2
waters could supply as much as 25–50 % of the global ocean source (Suntharalingam et al., 2000), it has been shown that when O2 concentrations fall below about 5 µmol L−1
(in the OMZ’s core) N2O consumption through
denitrifica-tion (NO−
3 →NO−2 →NO→N2O→ N2)takes place, and
therefore these waters may act as a net sink for this gas (Codispoti and Christensen, 1985; Löscher et al., 2015b). Hence, OMZs have a significant role in the marine N cy-cle not only due to their influence on the subsurface produc-tion of climate-relevant trace gases such as N2O (Paulmier et
al., 2008; Codispoti, 2010; Capone and Hutchins, 2013) but also because of their contribution to the loss of bioavailable fixed N (Kalvelage et al., 2013; Dalsgaard et al., 2014). Fur-ther ocean deoxygenation as well as expansion of the OMZs worldwide could in turn increase the volume of waters in which N loss takes place (Stramma et al., 2010; Deutsch et al., 2011), thereby intensifying N limitation of primary pro-duction and reducing the ocean’s ability to sequester atmo-spheric CO2(Falkowski, 1997).
Recent observations have shown the important role of mesoscale processes in the distribution of hydrographic and biogeochemical properties of the ETSP (Stramma et al., 2013, 2014; Bourbonnais et al., 2015; Löscher et al., 2015a; Thomsen et al., 2015). Along the Peruvian coast, instabilities of the main current flow lead to the formation of non-linear mesoscale eddies which propagate offshore from the site of formation, significantly contributing to the cross-shelf trans-port of heat, mass, momentum, and biogeochemical proper-ties (Chelton et al., 2007; Chaigneau et al., 2008). Likewise, offshore propagation of mesoscale eddies has been shown to increase the spatial extent of the high-productivity area of the coastal upwelling (Correa-Ramirez et al., 2007; Chelton et al., 2011), implying their relevance in the export of car-bon to the open ocean. Provided that downward transport of organic matter is an essential control of the marine N cycle (Kalvelage et al., 2013), it is of interest to investigate po-tential changes in N2O distribution within mesoscale eddies.
Although such mesoscale features in the OMZ off Peru have been associated with N-loss processes (Altabet et al., 2012; Stramma et al., 2013), to date no detailed surveys linking mesoscale eddies and N2O as well as their relevance to N
cycling are available.
The main goal of this study is to present the first set of N2O
measurements collected across three mesoscale eddies which were tracked during the R/V Meteorcruises M90 and M91
in November–December 2012. Furthermore, we use a com-bination of N2O concentrations and abundance of selected
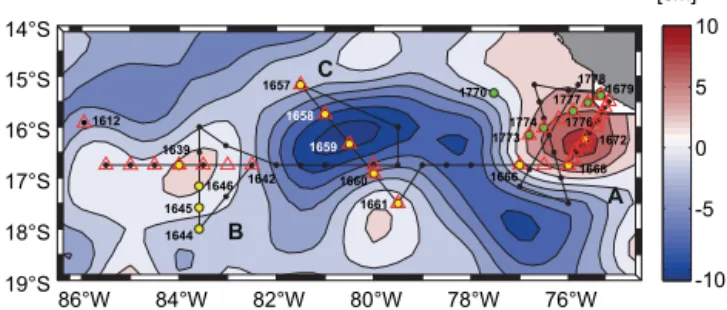
86°W 84°W 82°W 80°W 78°W 76°W 19°S
18°S 17°S 16°S 15°S 14°S
B C
A 0 5 10
-5
-10 [cm]
1646
1645
1644 1639
1657
1658 1659
1661
1666 1668
1672 1679
1773
1774 1776
1777 1778 1770
1660 1642 1612
Figure 1.Map of sampling locations in the ETSP. Aviso sea level
height anomaly for 21 November 2012 is shown (anticyclonic ed-dies are depicted in red, and cyclonic in blue). The cruise track and CTD stations with bottle sampling from the M90 cruise are shown in black. Open triangles indicate the hydrographic stations shown in Fig. 2. Sampling stations within the mode water eddies A and B as well as the open-ocean cyclonic eddy C are highlighted in yellow, whereas the cross-shelf section carried out during the M91 cruise is displayed in green. Station 1770 from the M91 cruise was used for the molecular work shown in Fig. 5.
molecular markers (key genes) for its main formation path-ways to elucidate the causes of the observed distribution. Fi-nally, we compare the N2O concentrations within the centre
of “young” and “old” mesoscale eddies in order to identify the net effect of their “ageing” (offshore propagation).
2 Eddy surveys
The fieldwork was conducted in November–December 2012 during the R/VMeteorcruises M90 and M91, which covered
the open ocean and shelf areas off Peru (5–25◦S, 75–86◦W).
Detailed physical and biogeochemical surveys of mesoscale eddies were carried out within 14–18◦S and 75–84◦W on
16 to 25 November and on 19 to 23 December. Based on near-real-time satellite data of sea level height anomalies (SSHAs) from Aviso (http://aviso.altimetry.fr/), it was pos-sible to identify two mode water (anticyclonic) eddies at the shelf break (eddy A) and in the open ocean (eddy B), as well as one cyclonic eddy (eddy C) in the open ocean. Likewise, SSHA data were used to track and revisit eddy A in order to investigate its property’s distribution after it started to move westward across the shelf break (Fig. 1).
2.1 Oceanographic and biogeochemical measurements Ocean velocities were recorded by means of two RDI Ocean Surveyor acoustic Doppler current profilers (ADCPs), which provided velocity data down to about 700 and 1200 m depth (75 and 38 kHz, respectively). Discrete water sampling as well as profiling of hydrographic properties was carried out by means of a Sea-Bird CTD–Rosette equipped with 10 L Niskin bottles and double sensors for temperature, conduc-tivity, and O2. Seawater samples for discrete O2
8 10 12 14 16 18
77°W 76°W 75°W
600 400 200 0
5 10 15 20 25
8 10 12 14 16 18
85°W 84°W 83°W
600 400 200 0
5 10 15 20 25
8 10 12 1416 18 17°S 16°S 600 400 200 0
5 10 15 20 25
8 10 12 14 16 18 20
76°30’W 76°W 75°30’W 600
400 200 0
5 10 15 20 25
(a) (b) (c) (d)
1666 1667 1668 - 1678 1636 1637 1638 1639 1640 1641 1642 1661 16601654 1659 1658 1657 1773 1774 1775 1776 1777 1778
200
5 5
15 15
77°W 76°W 75°W
600 400 200 0
0 100 200 300
200
5
15
15
85°W 84°W 83°W
600 400 200 0
0 100 200 300
200 5 5 15 15 17°S 16°S 600 400 200 0
0 100 200 300
200
5
5
15 15
76°30’W 76°W 75°30’W 600
400 200 0
0 100 200 300
26.0 26.6 27.0 0 0 0 0
77°W 76°W 75°W
600 400 200 0
–0.5 0 0.5
0 0 0 0 0 00 0 0 26.0 26.6 27.0
85°W 84°W 83°W
600 400 200 0 0 0.5 0 0 0 0 0 26.0 26.0 27.0 17°S 16°S 600 400 200 0 0 0.5 0 0 0 0 26.0 26.0 27.0
76°30’W 76°W 75°30’W 600
400 200 0
0 0.5
–0.5 –0.5 –0.5
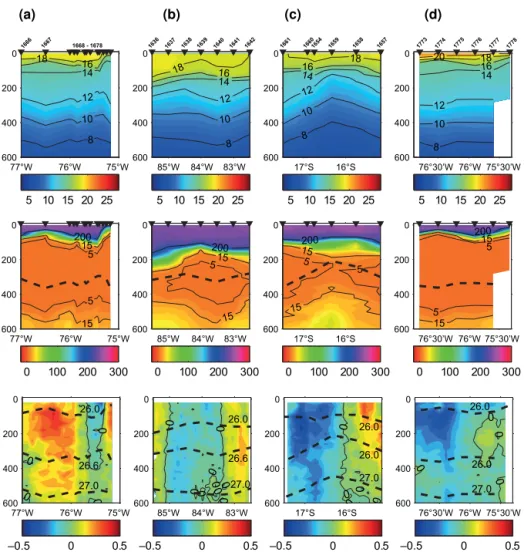
Figure 2.Hydrographic conditions at the time of sampling in the ETSP (0-600 m depth). Temperature in◦C (upper panels), O2in µmol kg−1
(middle panels), and zonal(a, c, d)as well as meridional.(b)velocity in m s−1(lower panels) for eddies A, B, and C during the M90 cruise
(November 2012;a–c), as well as for eddy A during the M91 cruise (December 2012;d) are shown. Locations of CTD profiles are marked
by black triangles (cf. Fig. 1), and the isopycnalσθ=26.6 kg m−3near the core of the OMZ is included in the O2sections as a black dashed line. Dashed lines in the velocity plots indicate potential density.
the CTD/Rosette system. O2 concentrations of these
sam-ples were determined by the Winkler method (Hansen, 1999) and were used to calibrate the O2sensors. The overall
preci-sion of the O2discrete measurements was±0.45 µmol L−1. Nitrate (NO−
3), nitrite (NO−2), and phosphate (PO−43)
con-centrations were measured on board by means of a QuAA-tro auto-analyser (SEAL Analytical GmbH, Germany) with an overall precision of ±0.1 µmol L−1 (NO−3 and NO−2)
and ±0.02 µmol L−1 (PO34−). The N deficit (or N∗) was
computed as [NO−
3]+[NO−2] −16× [PO−43]. Chlorophyll
a (Chl a) concentrations were determined by the acetone
extraction method followed by fluorometric analysis with a Trilogy® laboratory fluorometer (Welschmeyer, 1994).
Turbidity was measured by means of a factory-calibrated WET Labs fluorometer–turbidity sensor with sensitivity up to 0.01 NTU (nephelometric turbidity units). Discrete N2O
samples were collected at 22 stations with emphasis on the
upper 1000 m of the water column. For this purpose, bubble-free, triplicate samples were collected in 20 mL brown glass flasks and sealed with rubber butyl septa and metallic caps to avoid any gas exchange. Subsequently, a headspace was cre-ated in each flask by injecting 10 mL of helium (99.999 %, AirLiquide GmbH, Düsseldorf, Germany). Microbial activ-ity within the samples was prevented by adding 50 µL of a 1:3 dilution from a saturated mercuric chloride (HgCl2)
< 1000 ppb were calibrated at the department of atmospheric chemistry of the Max Plank Institute for Biogeochemistry (Jena, Germany) against the NOAA 2006 scale, whereas for N2O > 1000 ppb the gas molar fraction was determined by
means of high-resolution measurements of a calibrated off-axis integrated cavity output spectroscopy (OA-ICOS) anal-yser (precision better than 0.3 ppb; Arévalo-Martínez, et al., 2013). Calculation of the N2O concentrations was done as
described by Walter et al. (2006). In order to obtain back-ground N2O concentrations for the ETSP at the time of
sam-pling, we used data from Kock et al. (2016). For this, we computed a mean profile by averaging water column con-centrations of N2O from stations located in the open ocean
(86◦W section) between 6 and 16◦S. We did not include
near-coastal stations for the background profile calculation due to the high variability that can be observed, since this hampers any attempts of obtaining a “typical” profile (see Kock et al., 2016). Our designation of particular stations to eddy cores and edges was based on the SSHA data and fol-lows the criteria defined by Stramma et al. (2013). Eddy core anomalies for oceanographic and biogeochemical parameters were computed as the difference between stations located at or near the centre of the eddy and stations outside of it.
2.2 Molecular genetic methods
Nucleic acids samples were collected by filtering up to 1 L of seawater (exact volumes were recorded, and the filtration time was lower than 20 min) onto polycarbonate membrane filters with a pore size of 0.2 µm (Millipore). Immediately after collection, samples were frozen at−80◦C until further processing. Nucleic acids were extracted using the AllPrep DNA/RNA Mini Kit (Qiagen, Hildesheim, Germany) with additional 15 min cell lysis (10 mg mL−1lysozyme in 10 mM
Tris-EDTA, pH 8) and shock freezing in liquid nitrogen be-fore extraction. Quantitative (q) PCR followed protocols in
Löscher et al. (2014) except that a ViiA7 qPCR system (Life Technologies, Carlsbad, CA, USA) was used. The sensitivity level for the detection of ammonium monooxygenase(amoA)
and hydrazine oxidoreductase(hzo)genes with this method
is 4 copies L−1, whereas for the nitrite reductase(nirS)gene
it is 1 copy L−1.
3 Hydrographic and biogeochemical setting
The properties of the eddies investigated during the M90 (November 2012) and M91 (December 2012) cruises were described in detail by Stramma et al. (2013), and therefore only the main features are briefly mentioned here. Eddy A was centred at about 16◦S, 76◦W, with the highest intensity
(zonal and meridional velocities) in the upper 600 m. As a typical mode water eddy, lifting (deepening) of the seasonal (main) pycnocline could be observed (McGillicuddy Jr. et al., 2007), whereby O2was lower and temperature and salinity
were higher in the centre of the eddy than at its edges (Fig. 2).
Shoaling of the mixed-layer depth in the centre of eddy A coincided with a high Chlamaximum at about 50 m depth
and an up to 30 % reduction in O2concentrations. The outer
western side of cross-shelf sections across eddy A also re-vealed the influence of coastal upwelling near the shelf break in the upper 180 m. However this feature was detached from the eddy itself as is shown by temperature, O2, and
veloc-ity distributions (Fig. 2). Meridional velocveloc-ity distributions as well as temperature, salinity, and density fields suggest that eddy A enclosed waters from the Peru–Chile Undercur-rent (PCU) at the time of formation near the shelf (Stramma et al., 2013). Eddy B was centred in the open ocean at about 17◦S, 83◦30′W. Although the velocity distribution was
sim-ilar to that of eddy A (strong in the upper 600 m), rotational speeds were lower and the temperature, salinity, and density anomalies were weaker than in eddy A. Moreover, in com-parison with eddy A, the depth of uplifting isopycnals and the mixed-layer depth were deeper in eddy B (Fig. 2). As a consequence, the Chlamaximum as well as the temperature
and O2 anomalies could be found 100 m deeper in eddy B
than in eddy A. A trajectory analysis indicated that eddy B was formed near the shelf about 5 months before the time of sampling (i.e. 3 months older than eddy A); however a precise location could not be determined with our methods (Stramma et al., 2013). Eddy C was centred in the open ocean at 16◦15′S, 80◦15′W, with maximum velocities at ca. 50 m
depth and a positive density anomaly over the upper 600 m. In contrast to the anticyclonic eddies A and B, temperature and salinity of eddy C were lower, and density was higher in the centre than at its edges (Fig. 2), although the magnitude of the anomalies was similar to those of eddy A (Stramma et al., 2013). Furthermore, O2concentrations were higher in
the centre of the eddy than at the edges, and the size of the O2anomaly in the OMZ was larger than for eddy A,
indicat-ing ventilation of the OMZ with waters from below the main thermocline. Eddy C was formed at the coast, but unlike the anticyclones it moved westward without staying at the shelf (Stramma et al., 2013).
4 Results and discussion 4.1 Depth distribution of N2O
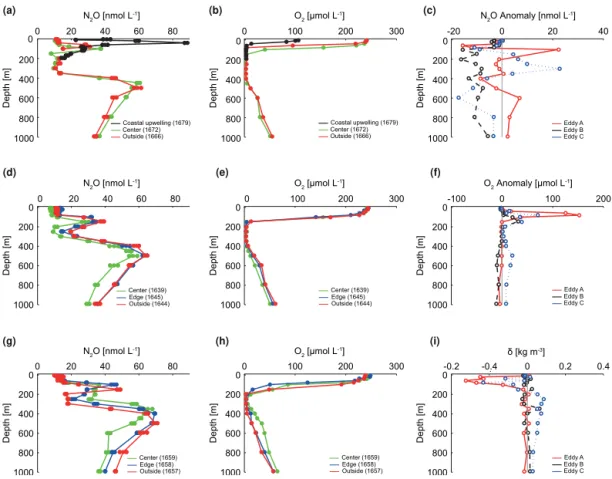
N2O concentrations in the water column featured a two-peak
structure with maxima N2O concentrations at the upper and
lower boundaries of the OMZ, and depletion at the OMZ’s core (Fig. 3). Such a pattern has been previously reported for the ETSP (Farías et al., 2007) and similar systems with prominent OMZs (Bange et al., 2001; Bange et al., 2010), and it is generally ascribed to alternating activity of micro-bial N2O production–consumption pathways along the
ver-tical O2 gradients (Codispoti and Christensen, 1985; Ji et
al., 2015). Although elevated N2O concentrations were
ob-served in near-surface waters (up to 88 nmol L−1) of the
0 20 40 60 80 0
200
400
600
800
1000
Depth [m]
N2O [nmol L-1]
0 20 40 60 80
0
200
400
600
800
1000
Depth [m]
0 20 40 60 80
0
200
400
600
800
1000
Depth [m]
0 100 200 300
0
200
400
600
800
1000
Depth [m]
0 100 200 300
0
200
400
600
800
1000
Depth [m]
0 100 200 300
0
200
400
600
800
1000
Depth [m]
0 20 40
0
200
400
600
800
1000
Depth [m]
0 100 200
0
200
400
600
800
1000
Depth [m]
0 0.2 0.4
0
200
400
600
800
1000
Depth [m]
N2O [nmol L-1]
O2 [μmol L-1]
O2 [μmol L-1]
N2O Anomaly [nmol L-1]
-20
O2 Anomaly [μmol L-1]
-100
N2O [nmol L-1] O
2 [μmol L
-1] δ [kg m-3]
-0.2 -0.4 Coastal upwelling (1679)
Center (1672) Outside (1666)
Coastal upwelling (1679) Center (1672) Outside (1666)
Center (1639) Edge (1645) Outside (1644)
Center (1639) Edge (1645) Outside (1644)
Center (1659) Edge (1658) Outside (1657)
Center (1659) Edge (1658) Outside (1657)
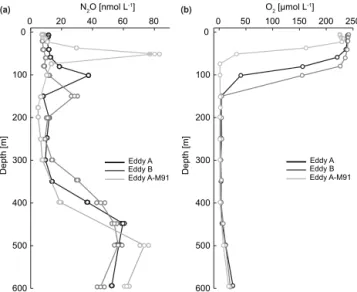
Eddy A Eddy B Eddy C
Eddy A Eddy B Eddy C
Eddy A Eddy B Eddy C
(a) (b) (c)
(d) (e) (f)
(g) (h) (i)
Figure 3.Vertical of distribution of N2O and O2across the mode water eddies A(a–b)and B(d–e), and the cyclonic eddy C(g–h)during the
M90 cruise in November 2012. Selected depth profiles of N2O and O2are shown in(a, d, g)and(b, e, h), respectively. Black lines/symbols in (a)and(b) indicate the northwesternmost station of eddy A, at which the influence of coastal upwelling was observed. Numbers in
parentheses indicate the station numbers (cf. Fig. 1). For N2O the standard deviation from triplicate samples is depicted by circles around the concentration values at each depth. N2O, O2, and density (δ)core anomalies for the eddies sampled during M90 are shown in(c),(f),
and(i), respectively.
eddy was already detached from the coast, and thus these high concentrations could be rather associated to coastal up-welling. In agreement with the distribution of physical prop-erties (Fig. 2), the vertical extent of the low-N2O waters from
the OMZ’s core was shifted to shallower depths within the centre of mode water eddies A and B. Moreover, shallower minima of N2O were observed in the upper OMZ for stations
located in the centre of eddy A (150 m, σθ =26.3 kg m−3)
compared to eddy B (250 m, σθ =26.5 kg m−3), whereas
in both cases the second N2O maxima were only slightly
displaced towards deeper depths. N2O concentrations at the
boundaries of the OMZ in the centre of eddy A were similar to those at its edge, whereas for eddy B the N2O
concentra-tions in the centre were markedly lower than at its edge and outside of it. This is reflected by stronger (negative) N2O
anomalies in eddy B than in eddy A (Fig. 3). Even though the highest velocities for both eddies could be measured until about 600 m depth (σθ =26.7 kg m−3), the O2, temperature,
and salinity anomalies in eddy B persisted at deeper depths, which could explain why the N2O concentrations at the
cen-tre of eddy B were generally lower through the water column (see Fig. 3 and Fig. S1 in the Supplement). The lowest N2O
concentration anomalies were found at the core of the OMZ (defined as the depth range with O2<∼5 µmol L−1)both at
the coastal and opocean stations (Fig. 3), suggesting en-hanced N2O depletion within the centre of eddies A and B.
Recently, Stramma et al. (2013) reported the occurrence of active N-loss processes at the core of the OMZ within the centre of both eddies A and B based on the co-occurrence of pronounced NO−
2 maxima as well as O2and NO−3 minima.
In their work, Stramma et al. (2013) argued that nutrient sub-duction along with reduced productivity might have reduced the flux of organic matter that could fuel N cycling when the eddies moved towards the open ocean. According to this, a comparatively lower consumption of N2O by
denitrifica-tion within the OMZ in the centre of eddy B should dimin-ish the differences between profiles inside and outside. How-ever, this effect was not visible in the N2O distribution, and,
conversely, N2O concentrations were generally lower in the
depth-integrated N2O concentration in the OMZ within the
open-ocean eddy B was only 6 % lower than in coastal eddy A, ob-served differences were as high as 25 % when the entire wa-ter column (5–1000 m) was considered. Integrated concen-trations of O2were generally lower in eddy A than in eddy B
(37.6±1.7 mol m−2 and 46.9±7.2 mol m−2, respectively), suggesting the potential for enhanced N2O production at
the oxic–suboxic boundaries of eddy A (see also Sect. 4.2). However, the extent to which these O2concentration
differ-ences could explain the observed differdiffer-ences in N2O
concen-trations cannot be quantitatively assessed from our data, in particular because of the sampling station density and the fact that we did not carry out N2O production rate measurements.
Hence, although Stramma et al. (2013) reported a reduction in organic matter turnover for the open-ocean eddy B during the M90 cruise, this was not evident for N2O, which
prob-ably reflects either (1) dissimilarities of the water masses in both eddies at the time of formation (see also Sect. 4.3) or (2) slower denitrification rates at the edges of eddy B than in its centre. A decreased pace of denitrification could explain the higher N2O concentration in the OMZ from stations
out-side of eddy B than those in its centre because it would imply slower N2O consumption (transformation to N2).
Vertical distribution of N2O in eddy C was similar to that
of the two anticyclonic eddies, with doming of isopycnals in its centre causing a shift of the upper and lower N2O maxima,
albeit in this case towards shallower depths. We found ele-vated N2O concentrations at the boundaries of the OMZ and
only a slight decrease at 150–400 m depth, where O2
con-centrations fell below 5 µmol L−1(Fig. 3). Nonetheless, the
N2O minimum was less pronounced than for eddies A and B
at the core of the OMZ, where the strongest (positive) anoma-lies could be found (Fig. 3). Our results are consistent with the observations of Stramma et al. (2013), who reported el-evated O2concentrations as well as low NO−2 accumulation
at the centre of eddy C, suggesting lower activity of N-loss processes than in eddies A and B. Although upon formation cyclonic eddies tend to increase subsurface production just as mode water eddies do, this effect is not long-lasting and the net downwelling of nutrients ultimately leads to decreased primary productivity (McGillicuddy Jr. et al., 2007). Thus, the diminished supply of organic matter which could fuel N loss within the OMZ’s core might have contributed to the relatively higher N2O concentrations in the OMZ of eddy C
than in eddies A and B. Analysis of SSHA data showed, how-ever, that stations assumed to be located at the edge and out-side of eddy C were actually influenced by another anticy-clonic eddy (see Fig. 1) and therefore are not representative of the mean conditions at the ETSP. Hence, more detailed (higher temporal and spatial resolution) studies of the distri-bution of N2O within cyclonic eddies are needed in order to
elucidate their role in the water column distribution of this gas in the ETSP.
Both our maximum and minimum of N2O concentrations
along the vertical O2gradients were well within the range of
previous observations in the ETSP (Farías et al., 2007, 2009; Ryabenko et al., 2012; Kock et al., 2016), and no statistically significant differences (two-sample t test, p values > 0.05, α=0.05) were found between our N2O values at the centre
of the three eddies and a mean open-ocean profile along the 86◦W section (Fig. S2). If only stations at about 16◦S are
considered, however, it can be seen that N2O depletion at
the core of the OMZ was stronger at the centre of eddies A and B than outside of them (Fig. S2). Hence, although the influence of eddies on the N2O distribution in the ETSP as
a whole seems to be masked by the high variability of the large-scale distribution of N2O (see Kock et al., 2016), the
negative N2O anomalies within the core of the OMZ at the
centre of anticyclonic eddies suggest a locally enhanced sink for this gas.
Given that enhanced concentrations of N2O can be found
within the upper oxycline of the ETSP (e.g. Fig. 3), shoaling of the thermocline within mode water eddies would mean higher N2O concentrations for a given depth as compared to
a background profile. Likewise, coastal upwelling waters off Peru are a known source of extremely high N2O
concentra-tions to the surface (Arévalo-Martínez et al., 2015). How-ever, since the observed eddies were detached from the coast at the time of sampling, the eddy-driven shoaling of waters with relatively high N2O concentrations did not contribute
to surface fluxes to the atmosphere in this location. In sup-port of this, we observed that even in coastal stations, where a rapid decrease in O2concentrations (OMZ starts at about
15 m depth) was followed by a narrow peak of N2O between
10 and 40 m depth (Fig. 3), there was not any appreciable variation of N2O concentrations at the surface. Independent
verification of our bottle data derives from surface (∼6 m) underway measurements performed during the same cruises (Arévalo-Martínez et al., 2015), which also did not show any enhancement of N2O concentrations during the several
cross-eddy sections carried out as part of the M90 and M91 cruises. Hence, although mesoscale eddies seem to influence the ver-tical distribution of N2O, they do not have a direct impact on
its surface distribution and emissions to the atmosphere since they are “trapped” below the mixed layer.
4.2 N2O cycling within coastal eddy A
SSHA data from December 2012 indicated that coastal mode water eddy A was still centred near the shelf break at about 16◦30′S, 76◦30′W. The O
2distribution along a cross-shelf
section between 16◦9′S, 76◦50′W and 15◦23′S, 75◦20′W
revealed O2 minima (< 5 µmol L−1)not only in the centre
of eddy A but also in the vicinity of the shelf break due to coastal upwelling. (Fig. 4). An intermediate-depth low-N2O
layer was consistent with the location of these low-O2
wa-ters, and it reached its maximum extension (70–400 m depth) close to the western side of the eddy A centre. Although a strong maximum of N2O (up to 80 nmol L−1)could be
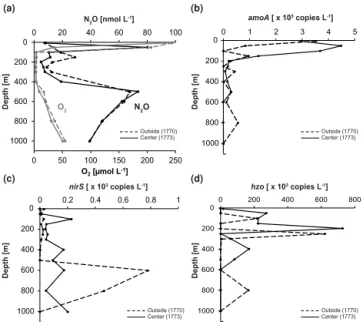
Figure 4.Cross-shelf distribution of N2O(a), NO−2 (b), NO3−(c), and N∗(d)along eddy A in December 2012 (16.2◦S, 76.9◦W to 15.3◦S
75.2◦W; see Fig. 1). Contours in(a)represent O
2concentrations (in µmol L−1). The white dashed lines indicate the approximate location of the eddy centre according to SSHA data. Numbers above panels(a)and(b)are the station numbers (cf. Fig. 1).
0 50 100 150 200 250
0
200
400
600
800
1000
0 20 40 60 80 100
O2[µmol L-1]
0
200
400
600
800
1000
0 1 2 3 4 5
0
200
400
600
800
1000
0 0.2 0.4 0.6 0.8 1
0
200
400
600
800
1000
0 200 400 600 800
Depth [m]
Depth [m]
Depth [m]
Depth [m]
amoA [ x 105 copies L-1]
nirS [ x 103 copies L-1] hzo [ x 103 copies L-1]
N2O [nmol L
-1]
N2O
O2
Outside (1770) Center (1773)
Outside (1770) Center (1773)
Outside (1770) Center (1773)
Outside (1770) Center (1773)
(a) (b)
(d) (c)
Figure 5.Vertical distribution of N2O and O2concentrations(a),
as well as gene abundance ofamoA(b),nirS(c), andhzo(d)within
the centre (solid lines) and outside (dashed lines) of eddy A in De-cember 2012 (M91 cruise). The numbers in parentheses indicate the station numbers (cf. Fig. 1).
centre of the eddy, the subsequent and sharp decrease in O2
concentrations led to a marked decrease in N2O.
The observed NO−
3 and N∗ minima, as well as the
pro-nounced secondary nitrite maximum (Codispoti and Packard,
1980), were consistent with the N2O distribution, suggesting
the occurrence of N-loss processes, particularly in the cen-tre of eddy A. Abundances of thehzo gene, the functional
gene marker for anaerobic ammonium oxidation (anammox) (Schmid et al., 2008), were generally higher through the wa-ter column within the centre of eddy A, with a maximum at about 50–200 m depth (i.e. shallower than outside of the eddy; see Fig. 5). Although anammox does not reflect N2O
consumption, it does provide an indication of active N loss within the OMZ of the eddy at the time of sampling (Dals-gaard et al., 2012; De Brabandere et al., 2014), which is in line with the observations from previous studies in the ETSP (Altabet et al., 2012; Stramma et al., 2013; Bourbonnais et al., 2015).
Nitrification, as indicated by the depth distribution of gene abundances ofamoA, the functional key gene for archaeal
ammonium oxidation (Rotthauwe et al., 1997), was observed within eddy A and was stronger in the upper 200 m for the centre of the eddy, whereas below 200 m it was of similar magnitude for stations outside and in the centre (Fig. 5). This would explain the comparatively high shallow-depth maxi-mum of N2O within the centre of eddy A (Fig. 4). N2O
pro-duction by archaeal ammonia oxidation has previously been identified to be important in subsurface waters in the ETSP (Löscher et al., 2012). The deeper N2O maximum, however,
cannot be explained by nitrification alone as e.g. Kalvelage et al. (2011) showed a decrease of nitrification rates below the upper oxycline. Furthermore, the linear correlation of1N2O
2003), is not present in that depth range, and geochemical tracer studies suggest a mixed N2O production from
nitrifi-cation and denitrifinitrifi-cation (Löscher et al., 2012; Ryabenko et al., 2012).
Based on the structure of the vertical profiles ofamoAand nirS gene abundances, we could also infer that N2O
max-ima at the boundaries of the OMZ resulted not only from nitrification but also partially from production during early stages of denitrification. Our observations support the results of Castro-González and Farías (2004), who used N2O
pro-duction experiments in the ETSP to show that denitrifiers produce increasing N2O:N2ratios as the O2concentrations increase due to the well-known sensitivity of the N2O
re-ductase to O2 (Dalsgaard et al., 2014). In order to roughly
estimate the N2O:N2ratios in the upper oxycline of eddy A, we used the observed N2O concentrations and N∗as an
in-dicator of N loss. As a result we found that, for example, within the centre of eddy A there was a three-fold increase in the N2O:N2ratio for an O2concentration decrease of about 85 % (229.1 µmol L−1at 20 m to 32.36 µmol L−1at 50 m). A
similar pattern was observed for stations located outside of the eddy, although the ratios were slightly higher due to the generally higher N2O concentrations (Fig. 5). Furthermore,
we also observed that in the upper 600 m depth the poten-tial for N2O production via partial denitrification (as inferred
fromnirSabundances) was higher in the centre of the eddy
than outside (Fig. 5). Nevertheless, within the OMZ’s core it was evident that N2O consumption was stronger in the
centre of the eddy, suggesting that, even though the genes for N2O production by denitrification were present, they
were probably inhibited due to further low O2
concentra-tions (∼3 µmol L−1). It is also likely, however, that under
denitrifying conditions N2O depletion occurs at a faster rate
than production, masking the N2O production signal.
Ele-vated NO−
2 concentrations (11 µmol L−1)along with
close-to-detection-limit NO−
3 concentrations in the OMZ further
suggest that complete – and more intense – denitrification took place in the OMZ core at the eddy centre (Codispoti and Christensen, 1985; Codispoti et al., 1986). Thus, in gen-eral, in the centre of the eddy a higher N2O maxima at the
upper boundary of the OMZ resulted from enhanced nitrifi-cation and partial denitrifinitrifi-cation, whereas stronger N2O
de-pletion at the OMZ’s core resulted from enhanced, complete denitrification. Although at depths below 600 m bothamoA
andnirSgene abundances were higher outside of the eddy,
N2O concentrations remained similar to those in the centre
and O2 was still lower in the eddy’s centre (Fig. 5).
Nev-ertheless, vertical profiles of the same eddy 1 month before showed that N2O concentrations below 600 m were higher in
the centre (cf. Fig. 3). Thus, it could be that increasing vari-ability beneath the lower boundary of the OMZ was caused by decreasing intensity (velocity) of the eddy below 600 m (Fig. 2). Overall, the net effect of anticyclonic eddy A was an enhancement of N-loss processes within its centre, thereby
making the OMZ’s core an even stronger sink for N2O than
it would be under “mean” conditions.
4.3 Effect of eddy ageing on N2O
Westward propagation of mesoscale eddies implies that prop-erties of the waters which were “enclosed” within its centre at the time of formation are transported offshore (Chelton et al., 2007). Gruber et al. (2011), for example, suggested that this transport leads to a net reduction of primary productiv-ity in coastal upwelling regions due to nutrient subduction and advection. Since the export of organic matter is the most important factor fuelling the N cycling in the OMZ (Capone and Hutchins, 2013; Babbin et al., 2014), changes in the dis-tribution of the main production–consumption pathways of N2O are likely to occur under the influence of mesoscale
eddies along their transit to open waters. In the following we compare the vertical distributions of N2O and relevant
biogeochemical parameters within the centre of the young coastal eddy A during the M90 cruise, and the old open-ocean eddy B. Likewise, we include data of a second survey of eddy A during the M91 cruise (hereafter eddy A-M91). For the comparison we focus on the upper 600 m of the wa-ter column since the largest physical and biogeochemical anomalies were observed at this depth range (see Stramma et al., 2013). The cyclonic eddy C is not considered for this analysis given its relatively minor importance for N-loss pro-cesses.
Figure 6 depicts the vertical distribution of N2O from
sta-tions located at or near the centre of the eddies A, B, and A-M91. As can be seen, despite the pronounced N2O
max-ima at the upper and lower oxyclines in eddy A-M91, in general, the N2O concentrations within this eddy were lower
than in eddy A and eddy B. Integrated concentration of N2O
within the centre of eddy A was 24 % higher than in eddy B (Table 1). This difference can be partially attributed to the fact that N-cycling processes tend to decrease after subsur-face nutrients are consumed and/or subducted, and primary production progressively decreases towards the open ocean. This is supported by higher O2and NO−3 concentrations in
eddy B than in eddy A, as well as the comparatively lower NO−
2 concentrations in eddy B, which suggests an overall
de-crease in organic matter respiration in the open-ocean eddy. Although the examination of temperature–salinity plots from both cruises suggests the presence of a single water mass within the OMZ of eddies A and B (Fig. S3), with our meth-ods it was not possible to determine the exact time and lo-cation of formation of both eddies. Thus, it cannot be ruled out that the differences in the biogeochemical conditions at the time of formation also contributed to the observed dif-ferences in N2O. In a recent study, Thomsen et al. (2015)
0 20 40 60 80 0
100
200
300
400
500
600
N2O [nmol L
-1]
0 50 100 150 200 250 0
100
200
300
400
500
600
Depth [m]
O2 [µmol L
-1]
Depth [m]
(a) (b)
Eddy A Eddy B Eddy A-M91
Eddy A Eddy B Eddy A-M91
Figure 6.Vertical distribution of N2O(a)and O2(b)within the
cen-tre of the anticyclonic eddies A, B, and A-M91. For N2O the stan-dard deviation from triplicate samples is depicted by circles around the concentration values at each depth.
Table 1.Comparison of physical and biogeochemical properties of
mode water eddies in the ETSP during the M90 (November 2012) and M91 (December 2012) cruises. N2O, O2, NO−
3, NO−2, and se-lected functional gene markers are expressed as integrated concen-trations/abundances over the water column.
A(M90) A(M91) B(M90)
Vertical extent (m)a 0–600 0–600 0–600
Radius (km)a 52.0 – 48.8
Volume (1012m3)a 5.2 – 4.7
N2O (mol m−2) 0.034 0.016 0.026
O2(mol m−2) 36.4 10.8 42.9
NO−
3 (mol m−2) 14.8 12.4 15.8
NO−
2 (mol m−2) 1.6 2.6 0.52
amoA(108copies m−2) 19.54 598.5 379.3 nirS(108copies m−2) 0.37 57.9 0.23 hzo(108copies m−2) 4.27 101 773 2.9
aValues taken from Stramma et al. (2013) refer to the depth range wherein the
strongest anomalies were observed.
eddies (A and B) are reflected in the vertical distribution of N2O, the extent to which the observed differences in N2O
concentrations are the result of either decaying N cycling or the properties of the water masses at the time of formation remains an open question.
In comparison with eddy A-M91, the integrated concen-tration of N2O in the centre of eddy A was 53 % higher
(Ta-ble 1). This marked decrease of N2O in the coastal mode
water eddy A only 1 month after the first sampling points to-wards an enhancement of N-loss processes within the OMZ of this eddy. In agreement with this observation, eddy A-M91 featured the lowest O2 and NO−3 content, as well as
the highest NO−
2 values among the three eddies considered
(Table 1). Our observations are also in line with the results of Bourbonnais et al. (2015), who reported the occurrence of intense N loss (up to∼44 µmol L−1)within in eddy A,
as well as an increase in the vertical expansion of the N-deficient waters in eddy A-M91. A substantial increase in water-column-integrated abundances of bothamoAandnirS
genes was observed in the centre of eddy A-M91 with re-spect to eddies A and B, reflecting the comparatively higher N2O concentrations found at the boundaries of the OMZ (cf.
Fig. 6). It seems, however, that enhanced N2O production by
nitrification and partial denitrification in eddy A-M91 was outpaced by high N2O consumption in the core of the OMZ
with further decreasing O2concentrations, which in turn
re-sulted in values even lower than those of the open-ocean eddy B. Furthermore, sharp differences in hzogene
abun-dances among the three eddies, with A-M91 featuring con-siderably higher values (Table 1), serve as evidence that N-loss activities in the ETSP were comparatively stronger in coastal eddies at the time of sampling. Likewise this also suggests that strengthening of eddy A (increased velocity) while it stayed stationary on the shelf between the two sur-veys (M90 and M91) might have led to an N-cycling intensi-fication through the water column.
4.3.1 Changes in N cycling
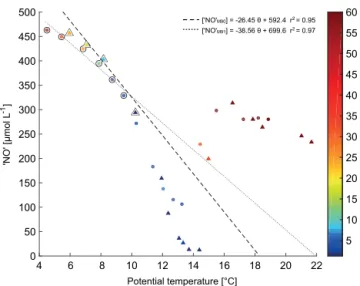
In order to provide a quantitative estimate of the amount of denitrification that took place in eddy A, as well as to as-sess how it changed between the two surveys, in this section we present estimates of nitrate deficit (1N) by means of the
“NO” approach (Naqvi and Gupta, 1985). “NO” is used as a quasi-conservative water mass tracer (Broecker, 1974) and is defined here as [O2]+9.1[NO−3] (Bange et al., 2000). A plot of “NO” versus potential temperature (θ )from stations
lo-cated at the centre of eddy A during M90 and M91 is shown in Fig. 7. For both cruises we obtained a good correlation between “NO” andθ after excluding data points from the
surface to the upper limit of the OMZ (O2∼20 µmol L−1),
as well as those from the OMZ’s core (O2 < 5 µmol L−1).
Hence, the obtained regression lines (“NO”M90, “NO”M91,
Fig. 7) represent conditions which are expected when the OMZ is not affected by denitrification (Naqvi and Gupta, 1985). We calculated1N by using “NO”M90 and “NO”M91
according to the following expression (Bange et al., 2000): ([“NO”x]−[O2]/9.1−[NO−3]−[NO−2], wherexis the
corre-sponding regression line for each cruise.
After integrating1N over the depth range of the OMZ, we
obtained values of 8.9 and 0.02 mol m−2for eddy A during
M90 and M91, respectively.1N from M90 was significantly
higher than most estimates available for a similar OMZ in the Arabian Sea (Naqvi and Gupta, 1985; Howell et al., 1997; Bange et al., 2000), and it was only comparable with values up to 7.3 mol m−2found by Naqvi and Gupta (1985) at about
how-Potential temperature [°C]
4 6 8 10 12 14 16 18 20 22
'NO' [μmol L
-1]
0 50 100 150 200 250 300 350 400 450 500
5 10 15 20 25 30 35 40 45 50 55 60 ['NO'M90] = -26.45θ+ 592.4 r2 = 0.95 ['NO'M91] = -38.56θ+ 699.6 r2 = 0.97
[μmol L-1]
Figure 7.“NO” vs. potential temperature (θ )for stations located at
the centre of eddy A during M90 (November 2012; circles) and M91 (December 2012; triangles). The color bar represents the O2 con-centrations (scale has been truncated at 60 µmol L−1). “NO” values from non-denitrifying waters (O2> 5 µmol L−1
)are highlighted in black and were used for the linear least-squares regressions.
ever, markedly lower than both1N from M90 and1N from
previous work in the OMZ of the Arabian Sea (minimum
1N=1.0 mol m−2; Bange et al., 2000). This suggests not only strong denitrification activities within mesoscale eddies formed off the Peruvian coast but also high short-term vari-ability as they move offshore. These results are in agreement with recent work in the ETSP, in which an isotopic approach was used to show the occurrence of intense N loss by both denitrification and anammox in the OMZ within mesoscale eddies (Bourbonnais et al., 2015). A pronounced Chl aand
turbidity maximum in the centre of eddy A-M91 suggest a potentially increased supply of organic matter which, upon sinking, could stimulate N loss through anammox and den-itrification (Kalvelage et al., 2013; De Brabandere et al., 2014). Therefore it is likely that N loss still took place in the coastal eddy A during M91, albeit at rates comparatively lower than those during M90 and the time period elapsed be-tween the two cruises. Our results are in agreement with the work of Löscher et al. (2015a), who reported enhanced N2
-fixation rates in the centre of mode water eddies, as well as co-occurrence of N2fixation and N loss, suggesting a
spa-tial link between both processes in the ETSP. As part of the same study, Löscher et al. (2015a) also found that in general N2-fixation rates tended to be lower during M91, most likely
indicating a decline of biological production during ageing of the eddy. Hence, although N2-fixation rates were lower
within the mode water eddy A during M91, its occurrence, together with the fact that during M91 we most likely sam-pled the eddy after a period of intense N cycling, might help to explain the alleviation on the N deficit between the M90
and M91 cruises. Under the spatial constraints of our sur-vey, one could infer that the N loss during M91 (as deter-mined both by the N* and “NO” methods) does not neces-sarily reflect enhanced denitrification within the eddy at the time of sampling (December) but rather the remaining signal of denitrification during early stages of the eddy which were partially captured when we sampled it in November. How-ever, given that we might have sampled different portions of the eddy despite a consistent definition of centre (i.e. based on SSHA data), a direct comparison remains speculative and further studies employing methods with higher temporal and spatial resolution would be required to assess the temporal variability of N loss and N2O consumption in the OMZ of
mesoscale eddies.
In order to roughly estimate the amount of N loss through denitrification which was driven by coastal eddy A between November and December 2012 (27 days), we used our
1N values and a calculated area of 8.5×10⁹m2. This re-sulted in a daily loss flux of 0.04 Tg-N day−1, which if scaled
to an annual basis would be comparable with values reported for the Arabian Sea by Mantoura et al. (1993) but lower than most estimates for the same area (Naqvi, 1987; Howell et al., 1997; Bange et al., 2000) and for the eastern tropical South and North Pacific (20–33 and 20–29 Tg-N yr−1, respectively;
Codispoti and Richards, 1976; Codispoti and Packard, 1980; DeVries et al., 2012). However, a direct comparison with those studies is not entirely realistic since the mean lifes-pan of mesoscale eddies off Peru is typically not longer than a few months (Chaigneau, et al., 2008). Therefore the in-tense N loss observed within the eddies might represent a transient state which at times contributes significantly to the total N loss in the ETSP. Since denitrification can also be a source of N2O (Codispoti and Christensen, 1985; Bakker
et al., 2014), we estimated the N2O production from
deni-trifying waters within the OMZ’s core (O2< 5 µmol L−1)of
eddy A. For this, we calculated the depth-integrated1N2O
(N2Omeasured−N2Oequilibrium)over the OMZ for both
pro-files at the centre of eddy A (M90 and M91). Using the eddy area and time span between cruises as shown above, we obtained a N2O daily yield of 1.3×10⁻⁵Tg-N2O day−1 (or 8.0×10⁻⁶Tg-N day−1). Scaling this value to an annual
basis resulted in a N2O yield of 4.5×10⁻³Tg-N2O yr−1 (or 2.9×10⁻³Tg-N yr−1), which is markedly lower than
previous values for the Arabian Sea (Mantoura et al 1993; Bange et al., 2001). Accordingly, our estimated N2O
pro-duction from denitrification is considerably low in compar-ison with our estimated denitrification rates from eddy A in November–December 2012 (0.02 %), suggesting faster N2O
consumption than production within the OMZ of eddy A for the period of sampling. N2O production in the OMZ of the
Arabian Sea has been reported to amount to at least 2 % of the mean denitrification rates (Bange et al, 2001). However this value is not entirely comparable with ours since in that study a whole basin (1.95×10¹²m2)is considered and our time
pointed out that our denitrification rates and N2O yields from
the OMZ assume a given size and permanence period of the eddy in coastal waters and, moreover, do not take into con-sideration the progressive decrease in N-loss activities within the eddy centre as it moves away from the coast. Therefore, our values are only contentious and are meant to highlight the need for combined biogeochemical–physical studies which account for the annual variability in occurrence, abundance, and spatial extent of mesoscale anticyclonic eddies off Peru, given their importance for N-loss processes.
The coastal eddy A was formed on the shelf about 2 months before the time of sampling, whereas the open-ocean eddy B was formed at least 5 months before our survey. This hampers a direct comparison of both mode water ed-dies, in particular because with our methods it was not pos-sible to determine the exact location where eddy B was formed. Nonetheless, the main physical and biogeochemi-cal features of eddies A and B suggest that, in general, the ageing of mesoscale eddies tends to decrease N2O
concen-trations through the water column in response to reduced the supply of material to fuel microbial respiration in the bound-aries of the OMZ.
4.4 Synthesis
Aside from the temporal and spatial sampling constrains, our observations allowed us to identify common features of the water column distribution of N2O that arise from the
occur-rence of different mesoscale eddies in the ETSP. We showed that the main vertical distribution of N2O within eddies A, B,
and C fits well to the typical open-ocean distribution reported in previous works in the same area (Löscher et al., 2012; Ryabenko et al., 2012, Kock et al., 2016). Thus, elevated con-centrations of N2O at the upper and lower boundaries of the
OMZ could be attributed to production via nitrification and partial denitrification (as inferred from highamoAandnirS
abundances, respectively), whereas denitrification-driven de-pletion of N2O was clearly observed at the core of the OMZ
(O2∼< 5 µmol L−1). However, vertical shifting of the OMZ
due to isocline displacement within the eddies (both anticy-clonic and cyanticy-clonic) also led to variation of the position of the maxima and minima in the water column. The upward dis-placement of oxycline waters with high N2O concentrations
was, nevertheless, detached from surface waters, and there-fore eddies did not affect the surface concentrations of N2O.
Concentrations of N2O were generally lower through the
wa-ter column in anticyclonic eddies, suggesting that they trans-port highly productive waters trapped at the coast and bear a high potential for intense N cycling, as has been also shown by recent studies in the ETSP (Bourbonnais et al., 2015; Thomsen et al., 2015). Likewise, we observed that the ver-tical expansion of low-O2waters within the core of the OMZ
(O2∼< 5 µmol L−1)within the centre of anticyclonic eddies
also resulted in an increased area where N2O depletion was
favoured. Hence mesoscale eddies in the ETSP might
repre-sent a locally relevant, enhanced sink for N2O. This
observa-tion is in line with previous studies which directly measured N loss in the same eddies (see e.g. Bourbonnais et al., 2015; Löscher et al., 2015a). The fact that OMZ core waters (which act as a sink for N2O) are transported over long distances
offshore also suggests a potentially higher relevance of this region as a sink for N2O. Nevertheless, given the extremely
high production of N2O in the ETSP (Kock et al., 2016) and
our current lack of understanding of the overall, long-term impact of mesoscale eddies in the biogeochemistry of N2O,
it is, at this point, difficult to assess how relevant this sink term might be.
5 Summary and conclusions
In this study we used a combined approach including phys-ical, biogeochemphys-ical, and molecular methods in order to in-vestigate the distribution of N2O within mesoscale eddies
in the ETSP. Overall, a two-peak structure was observed in vertical profiles of N2O, indicating the alternation between
production and consumption processes as a response to the O2gradients through the water column. Our results suggest
that N2O concentrations in the water column were
consis-tent with the main physical features of the mesoscale ed-dies. Hence, lifting (deepening) of the seasonal (main) py-cnoclines in mode water eddies (A and B) was visible for N2O, with shoaling of the upper maxima and slight
displace-ment of the lower maxima towards deeper depths. Likewise, doming of isopycnals in the open-ocean cyclonic eddy (C) caused a shift of the upper and lower N2O maxima towards
shallower depths. O2 and nutrient (NO−3 and NO−2)
distri-butions as well as abundances of key gene markers for N2O
production processes showed that the upper and lower oxy-clines in the boundaries of the OMZ are net sources of N2O,
producing the two observed maxima which envelop the N2
O-depleted waters in the core of the OMZ. Trapping of highly productive coastal waters in anticyclonic eddies (e.g. eddy A) led to a net enhancement of N-loss processes in its centre both through denitrification and anammox, thereby making the OMZ’s core an even stronger sink for N2O than it would
be under mean conditions. However, the strength of the N-cycling processes decreases during the transit of these ed-dies out of the shelf, mostly in response to a lower supply of organic matter from surface waters and sinking of nutri-ents as the eddy collapses. Hence our observations suggest that open-ocean mode water eddies tend to produce less N2O
than coastal ones because the weaker maxima that enclose the OMZ core have an overall bigger impact than the reduced N2O consumption within the OMZ core. Nevertheless, water
properties at the time of formation, as well as the pace at which eddies propagate, might significantly alter the N2O
concentrations through the water column. Although depth distribution of N2O in the centre of cyclonic eddy C was
for N loss was negligible. Despite the observed shoaling of upper isopycnals in both mode water and cyclonic eddies, we did not find any appreciable changes in the surface distribu-tion of N2O since these features are trapped below the mixed
layer.
In conclusion, our survey provides the first insights into N2O distribution within mesoscale eddies in the ETSP and
points out the importance of multidisciplinary approaches in investigating the rather multifaceted N cycling in OMZs. However, high complexity of the N2O production and
con-sumption pathways, together with unaccounted temporal and spatial variability, hampers the chances of an objective quan-tification of the net effect of mesoscale eddies on N2O for
the whole ETSP. Projected future deoxygenation and expan-sion of OMZs have been suggested to significantly increase marine N2O production. However, an increased strength of
the N2O sink within the core of low-O2waters in mesoscale
eddies might also play an important role which has not yet been quantified. Hence, it is critical to understand how these prominent features of the circulation might affect N2O
dis-tribution and concentrations in order to be able to assess the variability of its sources and the strength of its sinks.
The Supplement related to this article is available online at doi:10.5194/bg-13-1105-2016-supplement.
Author contributions. L. Stramma, D. L. Arévalo-Martínez, and H. W. Bange conceived the study; D. L. Arévalo-Martínez set up the instrumentation for discrete N2O measurements on board the R/V Meteorand carried out the fieldwork together with A. Kock and H. W. Bange. D. L. Arévalo-Martínez and A. Kock processed and calibrated depth profile N2O data. C. R. Löscher collected and processed the molecular data. L. Stramma processed and analysed hydrographic data. D. L. Arévalo-Martínez wrote the manuscript with contributions from H. W. Bange, A. Kock, C. R. Löscher, R. A. Schmitz, and L. Stramma.
Acknowledgements. This study was funded by the DFG-supported project SFB754 (http://www.sfb754.de), the BMBF joint project SOPRAN II and III (FKZ 03F0611A and FKZ 03F662A), and the EU FP7 project InGOS (grant agreement no. 284274). We thank the Peruvian authorities for authorizing us to conduct the study in their territorial waters. We also would like to thank our Peruvian colleagues from IMARPE (M. Graco, A. Bernal, G. Flores, and V. León) for their logistical support. We thank the captains and crew of the R/VMeteorfor their assistance during the cruises M90 and M91. Likewise, we thank T. Baustian, A. Bernal, J. Craig, G. Eirund, G. Flores, V. León, M. Lohmann, N. Martogli, K. Nachtigall, and G. Krahmann for their contributions to the processing of the different data sets. The altimeter data used for Fig. 1 were produced by Ssalto/Duacs and distributed by Aviso with support from CNES.
Edited by: B. Ward
References
Altabet, M. A., Ryabenko, E., Stramma, L., Wallace, D. W. R., Frank, M., Grasse, P., and Lavik, G.: An eddy-stimulated hotspot for fixed nitrogen-loss from the Peru oxygen minimum zone, Biogeosciences, 9, 4897–4908, doi:10.5194/bg-9-4897-2012, 2012.
Arévalo-Martínez, D. L., Beyer, M., Krumbholz, M., Piler, I., Kock, A., Steinhoff, T., Körtzinger, A., and Bange, H. W.: A new method for continuous measurements of oceanic and at-mospheric N2O, CO and CO2: performance of off-axis inte-grated cavity output spectroscopy (OA-ICOS) coupled to non-dispersive infrared detection (NDIR), Ocean Sci., 9, 1071–1087, doi:10.5194/os-9-1071-2013, 2013.
Arévalo-Martínez, D. L., Kock, A., Löscher, C. R., Schmitz, R. A., and Bange, H. W.: Massive nitrous oxide emissions from the tropical South Pacific Ocean, Nat. Geosci., 8, 530–533, doi:10.1038/ngeo2469, 2015.
Babbin, A. R., Keil, R. G., Devol, A. H., and Ward, B.: Organic matter stoichiometry, flux, and oxygen control nitrogen loss in the ocean, Science, 344, 406–408, 2014.
Bakker, D. C. E., Bange, H. W., Gruber, N., Johannenssen, T., Upsill-Goddard, R. C., Borges, A. V., Delille, B., Löscher, C. R., Naqvi, S. W. A., Omar, A. O., and Santana-Casiano, J. M.: Air-sea interactions of natural long-lived greenhouse gases (CO2, N2O, CH4)in a changing climate, in: Ocean-atmosphere inter-actions of gases and particles, edited by: Liss, P. S. and Johnson, M. T., 113–169, Springer, Heidelberg, Germany, 2014.
Bange, H. W., Rixen, T., Johansen, A. M., Siefert, R. L., Ramesh, R., Ittekkot, V., Hoffmann, M. R., and Andreae, M. O.: A revised nitrogen budget for the Arabian Sea, Global Biogeochem. Cy., 14, 1283–1297, 2000.
Bange, H. W., Rapsomanikis, S., and Andreae, M. O.: Nitrous oxide cycling in the Arabian Sea, J. Geophys. Res., 106, 1053–1065, 2001.
Bange, H. W., Freing, A., Kock, A., and Löscher, C. R.: Marine pathways to nitrous oxide, in: Nitrous oxide and climate change, edited by: Smith, K., Earthscan, London, UK, 36–62 2010. Bourbonnais, A., Altabet, M. A., Charoenpong, C. N., Larkum, J.,
Hu, H., Bange, H. W., and Stramma, L.: N-loss isotope effects in the Peru oxygen minimum zone studied using a mesoscale eddy as a natural tracer experiment, Global Biogeochem. Cy., 29, 793–811, doi:10.1002/2014GB005001, 2015.
Broecker, W. S.: “NO”, a conservative water-mass tracer, Earth Planet. Sc. Lett., 23, 100–107, 1974.
Capone, D. G. and Hutchins, D. A.: Microbial biogeochemistry of coastal upwelling regimes in a changing ocean, Nat. Geosci., 6, 711–717, 2013.
Castro-González, M. and Farías, L.: N2O cycling at the core of the oxygen minimum zone off northern Chile, Mar. Ecol.-Prog. Ser., 280, 1–11, 2004.
Chaigneau, A., Gizolme, A., and Grados, C.: Mesoscale eddies off Peru in altimeter records: Identification algorithms and eddy spatio-temporal patterns, Prog. Oceanogr., 79, 106–119, 2008.
Chelton, D. B., Gaube, P., Schlax, M. G., Early, J. J., and Samel-son, R. M.: The influence of nonlinear mesoscale eddies on near-surface oceanic chlorophyll, Science, 334, 328–332, 2011. Codispoti, L. A.: Interesting times for marine N2O, Science, 327,
1339–1340, 2010.
Codispoti, L. A. and Christensen, J. P.: Nitrification, denitrification and nitrous oxide cycling in the eastern tropical South Pacific Ocean, Mar. Chem., 16, 277–300, 1985.
Codispoti, L. A. and Packard, T. T.: Denitrification rates in the east-ern tropical South Pacific, J. Mar. Res., 38, 453–477, 1980. Codispoti, L. A. and Richards, F. A.: An analysis of the
horizon-tal regime of denitrification in the eastern tropical North Pacific, Limnol. Oceanogr., 21, 379–388, 1976.
Codispoti, L. A., Friederich, G. E., Packard, T. T., Glover, H. E., Kelly, P. J., Spinrad, R. W., Barber, R. T., Elkins, J., W., Ward, B. B., Lipschultz. F., and Lostaunau, N.: High nitrite levels off northern Peru: a signal of instability in the marine denitrification rate, Science, 233, 1200–1202, 1986.
Correa-Ramirez, M. A., Hormazábal, S., and Yuras, G.: Mesoscale eddies and high chlorophyll concentrations off central Chile (29◦–29◦S), Geophys. Res. Lett., 34, L12604, doi:10.1029/2007GL029541, 2007.
Dalsgaard, T., Thamdrup, B., Farías, L., and Revsbech, N. P.: Anammox and denitrification in the oxygen minimum zone of the eastern South Pacific, Limnol. Oceanogr., 57, 1331–1346, 2012.
Dalsgaard, T. Stewart, F. J., Thamdrup, B., De Brabandere, L., Revsbech, N. P., Ulloa, O., Canfield, D. E., and DeLong, E. F.: Oxygen at nanomolar levels reversibly suppresses process rates and gene expression in anammox and denitrification in the oxygen minimum zone off northern Chile, mBio, 5, e01966–14, doi:10.1128/mBio.01966-14, 2014.
De Brabandere, L., Canfield, D. E., Dalsgaard, T., Friederich, G. E., Revsbech, N. P., Ulloa, O., and Thamdrup, B.: Vertical partition-ing of nitrogen-loss processes across the oxic-anoxic interface of an oceanic oxygen minimum zone, Environ. Microbiol., 16, 3041–3054, 2014.
Deutsch, C., Brix, H., Ito, T., Frenzel, H., and Thompson, L.: Climate-forced variability of ocean hypoxia, Science, 333, 336– 339, 2011.
DeVries, T., Deutsch, C., Primeau, F., Chang, B., and Devol, A.: Global rates of water-column denitrification derived from nitro-gen gas measurements, Nat. Geosci., 5, 547–550, 2012. Falkowski, P. G.: Evolution of the nitrogen cycle and its influence
on the biological sequestration of CO2in the ocean, Nature, 387, 272–275, 1997.
Farías, L., Paulmier, A., and Gallegos, M.: Nitrous oxide and N-nutrient cycling in the oxygen minimum zone off northern Chile, Deep-Sea Res. Pt. I, 54, 164–180, 2007.
Farías, L., Castro-González, M., Cornejo, M., Charpentier, J., Faún-dez, J., Boontanon, N., and Yoshida, N.: Denitrification and ni-trous oxide cycling within the upper oxycline of the eastern tropi-cal South Pacific oxygen minimum zone, Limnol. Oceanogr., 54, 132–144, 2009.
Goreau, T. J., Kaplan, W. A., Wofsky, S. C., McElroy, M. B., Valois, F. W., and Watson, S. W.: Production of NO−
2 and N2O by nitri-fying bacteria at reduced concentrations of oxygen, Appl. Envi-ron. Microb., 40, 526–532, 1980.
Gruber, N., Lachkar, Z., Frenzel, H., Marchesiello, P., Münnich, M., McWilliams, J. C., Nagai, T., and Plattner, G.-K.: Eddy-induced reduction of biological production in eastern boundary upwelling systems, Nat. Geosci., 4, 787–792, 2011.
Hansen, H. P.: Determination of oxygen, in: Methods of Seawa-ter Analysis, edited by: Grasshoff, K. G., Kremling, K., and Ehrhardt, M., Wiley-VCH, Weinheim, Germany, 75–90, 1999. Howell, E. A., Doney, S. C., Fine, R. A., and Olson, D. B.:
Geo-chemical estimates of denitrification in the Arabian Sea and the Bay of Bengal during WOCE, Geophys. Res. Lett., 24, 2549– 2552, 1997.
Ji, Q., Babbin, A. R., Jayakumar, A., Oleynik, S., and Ward, B.: Ni-trous oxide production by nitrification and denitrification in the Eastern Tropical South Pacific oxygen minimum zone, Geophys. Res. Lett., 42, 10755–10764, doi:10.1002/2015GL066853, 2015. Kalvelage, T., Jensen, M. M., Contreras, S., Revsbech, N. S., Lam, P., Günter, M., LaRoche, J., Lavik, G., and Kuypers, M. M. M.: Oxygen sensitivity of anammox and coupled N-cycle pro-cesses in the oxygen minimum zones, PloS ONE, 6, e29299, doi:10.1371/journal.pone.0029299, 2011.
Kalvelage, T., Lavik, G., Lam, P., Contreras, S., Arteaga, L., Löscher, C. R., Oschlies, A., Paulmier, A., Stramma, L., and Kuypers, M. M. M.: Nitrogen cycling driven by organic matter export in the South Pacific oxygen minimum zone, Nat. Geosci., 6, 228–234, 2013.
Karstensen, J., Stramma, L., and Visbeck, M.: Oxygen minimum zones in the eastern tropical Atlantic and Pacific oceans, Prog. Oceanogr., 77, 331–350, 2008.
Kock, A., Arévalo-Martínez, D. L., Löscher, C. R., and Bange, H. W.: Extreme N2O accumulation in the coastal oxygen minimum zone off Peru, Biogeosciences, 13, 827–840, doi:10.5194/bg-13-827-2016, 2016.
Löscher, C. R., Kock, A., Könneke, M., LaRoche, J., Bange, H. W., and Schmitz, R. A.: Production of oceanic nitrous oxide by ammonia-oxidizing archaea, Biogeosciences, 9, 2419–2429, doi:10.5194/bg-9-2419-2012, 2012.
Löscher, C. R., Großkopf, T., Desai, F. D., Gill, D., Schunck, H., Croot, P. L., Schlosser, C., Neulinger, S. C., Pinnow, N., Lavik, G., Kuypers, M. M. M., LaRoche, J., and Schmitz, R. A.: Facets of diazotrophy in the oxygen minimum zone waters off Peru, ISME J., 8, 2180–2192, 2014.
Löscher, C. R., Bourbonnais, A., Dekaezemacker, J., Charoenpong, C. N., Altabet, M. A., Bange, H. W., Czeschel, R., Hoffmann, C., and Schmitz, R. A.: N2fixation in eddies of the eastern trop-ical South Pacific Ocean, Biogeosciences Discuss., 12, 18945– 18972, doi:10.5194/bgd-12-18945-2015, 2015a.
Löscher, C. R., Bange, H. W., Schmitz, R. A., Callbeck, C. M., Engel, A., Hauss, H., Kanzow, T., Kiko, R., Lavik, G., Logi-nova, A., Melzner, F., Neulinger, S. C., Pahlow, M., Riebesell, U., Schunck, H., Thomsen, S., and Wagner, H.: Water column bio-geochemistry of oxygen minimum zones in the eastern tropical North Atlantic and eastern tropical South Pacific Oceans, Bio-geosciences Discuss., 12, 4495–4556, doi:10.5194/bgd-12-4495-2015, 2015b.