OSD
11, 2879–2905, 2014Eddy characteristics in the SIO as inferred
from surface drifter
Shaojun Zheng et al.
Title Page
Abstract Introduction
Conclusions References
Tables Figures
◭ ◮
◭ ◮
Back Close
Full Screen / Esc
Printer-friendly Version Interactive Discussion
Discussion
P
a
per
|
Discussion
P
a
per
|
Discussion
P
a
per
|
Discussion
P
a
per
|
Ocean Sci. Discuss., 11, 2879–2905, 2014 www.ocean-sci-discuss.net/11/2879/2014/ doi:10.5194/osd-11-2879-2014
© Author(s) 2014. CC Attribution 3.0 License.
This discussion paper is/has been under review for the journal Ocean Science (OS). Please refer to the corresponding final paper in OS if available.
Eddy characteristics in the South Indian
Ocean as inferred from surface drifter
Shaojun Zheng1, Yan Du1,*, Jiaxun Li2, and Xuhua Cheng1
1
State Key Laboratory of Tropical Oceanography, South China Sea Institute of Oceanology, Chinese Academy of Sciences, Guangzhou 510301, China
2
Naval Institute of Hydrographic Surveying and Charting, Tianjin 300061, China
*
now at: State Key Laboratory of Tropical Oceanography, South China Sea Institute of Oceanology, Chinese Academy of Sciences, 164 West Xingang Road,
Guangzhou 510301, China
Received: 22 October 2014 – Accepted: 22 November 2014 – Published: 11 December 2014
Correspondence to: Yan Du ([email protected])
OSD
11, 2879–2905, 2014Eddy characteristics in the SIO as inferred
from surface drifter
Shaojun Zheng et al.
Title Page
Abstract Introduction
Conclusions References
Tables Figures
◭ ◮
◭ ◮
Back Close
Full Screen / Esc
Printer-friendly Version Interactive Discussion
Discussion
P
a
per
|
Discussion
P
a
per
|
Discussion
P
a
per
|
Discussion
P
a
per
|
Abstract
Using a geometric eddy identification method, cyclonic and anticyclonic eddies from submesoscale to mesoscale in the South Indian Ocean (SIO) have been statistically investigated based on 2082 surface drifters from 1979 to 2013. 19252 eddies are iden-tified with 60 % anticyclonic eddies. For the submesoscale eddies (radiusr <10 km),
5
the ratio of cyclonic eddies (3183) to anticyclonic eddies (7182) is 1 to 2. In con-trast, number of anticyclonic and cyclonic eddies with radiusr≥10 km is almost equal.
Mesoscale and submesoscale eddies show different spatial distribution. Eddies with radiusr≥100 km mainly appear in a band along 25◦S, in Mozambique Channel, and Agulhas Current, characterized by large eddy kinetic energy. The submesoscale
anti-10
cyclonic eddies are densely distributed in the subtropical basin in the central SIO. The number of mesoscale eddies shows statistically significant seasonal variability, reach-ing a maximum in October and then minimum in February.
1 Introduction
The South Indian Ocean (SIO) has unique current systems. A schematic general
cir-15
culation diagram is shown in Fig. 1. The South Equatorial Current (SEC) in the SIO is in a large part supplied by the Indonesian Throughflow (ITF). The SEC splits into the Northeast Madagascar Current (NEMC) and Southeast Madagascar Current (SEMC) when it reaches the east coast of Madagascar near 17◦S (Schott et al., 2001, 2009). The NEMC flows around the north tip of Madagascar at Cape Amber to the coast of
20
Tanzania at about 12◦S, and splits into northward and southward flows. The northward branch of NEMC feeds into the East African Coast Current (EACC), and the south-ward branch joins the Mozambique Channel throughflow with anticyclonic eddies (De Ruijter et al., 2002; Schouten et al., 2003; Ridderinkhof et al., 2010). The SEMC joins the Agulhas Current after passing south of Madagascar, featured with plentiful eddies
25
OSD
11, 2879–2905, 2014Eddy characteristics in the SIO as inferred
from surface drifter
Shaojun Zheng et al.
Title Page
Abstract Introduction
Conclusions References
Tables Figures
◭ ◮
◭ ◮
Back Close
Full Screen / Esc
Printer-friendly Version Interactive Discussion
Discussion
P
a
per
|
Discussion
P
a
per
|
Discussion
P
a
per
|
Discussion
P
a
per
|
warm and saline water from the Indian Ocean to the Atlantic Ocean through Agulhas Leakage (Gordon et al., 1992; Donners et al., 2004). The Agulhas retroflection reen-ters the SIO as a broad northeastward flow and extends to the west coast of Australia (Schott et al., 2009).
Mesoscale eddies are an important ocean dynamic phenomenon, and provide
im-5
portant material and dynamical fluxes for the equilibrium balances of the general cir-culation and climate (McWilliams, 2013). Mesoscale eddies can cause heat and salt transports (Qiu and Chen, 2005; Volkov et al., 2008; Dong et al., 2014), and eddy-induced zonal mass transport is comparable in magnitude with that of large scale cir-culation (Zhang et al., 2014). Mesoscale eddies modulate the nutrient flux into euphotic
10
zone through vertical and horizontal transport (Falkowski et al., 1991; Aristegui et al., 1997; Crawford et al., 2005). Submesoscale eddies also play a key role in biogeo-chemical budgets through intense upwelling of nutrients, subduction of plankton and horizontal stirring (Ledwell et al., 1993; Abraham, 1998; Abraham et al., 2000; Lévy et al., 2001; Lévy and Klein, 2004). Mesoscale eddies in the SIO have been studied
15
using satellite data (e.g. Palastanga et al., 2006; Chelton et al., 2011), ocean modeling (e.g. Backeberg et al., 2008) and in-situ observations (e.g. de Ruijter et al., 2004; Rid-derinkhof et al., 2010). In the southeast Indian Ocean (IO), altimetry measurements showed that anticyclonic eddies propagate westward and equatorward, and cyclonic eddies propagate poleward (Morrow et al., 2004). The eddy kinetic energy (EKE) shows
20
a seasonal cycle with the maximum in summer and the minimum in winter (Jia et al., 2011). In austral spring, the enhanced flux forcing of combined meridional Ekman and geostrophic convergence strengthens the upper-ocean meridional temperature gradi-ent, and intensifies the modulation in the vertical velocity shear. The modulation in the vertical velocity shear changes the intensity of baroclinic instability associated with the
25
OSD
11, 2879–2905, 2014Eddy characteristics in the SIO as inferred
from surface drifter
Shaojun Zheng et al.
Title Page
Abstract Introduction
Conclusions References
Tables Figures
◭ ◮
◭ ◮
Back Close
Full Screen / Esc
Printer-friendly Version Interactive Discussion
Discussion
P
a
per
|
Discussion
P
a
per
|
Discussion
P
a
per
|
Discussion
P
a
per
|
of sea surface height (SSH) suggested a connection between mesoscale eddy activ-ity around Madagascar and large-scale interannual variabilactiv-ity in the SIO (e.g. Palas-tanga et al., 2006). Long-term moorings showed that four to five anticyclonic eddies drifted southwards through the channel in each year (Ridderinkhof et al., 2010). South-west of Madagascar, cruise data showed anticyclonic eddies propagated mostly South-
west-5
ward, while cyclonic eddies diverged more between west and southwest (de Ruijter et al., 2004). Altimetry and sea surface temperature data showed that a number of westward-propagating eddies exist along the zonal band near 25◦S (Quartly et al., 2006). In the Agulhas Current region, anticyclonic eddies propagate northwestward and enter the Southeast Atlantic Ocean (Backeberg et al., 2008).
10
Though a few studies had worked on the mesoscale eddies in the SIO, the investiga-tion of eddy characteristics based on in-situ observainvestiga-tion is far from enough. Compared with altimetry measurements, surface drifters give high spatial and temporal resolu-tions. Due to the long distance between satellite tracks, altimetry can hardly detect eddies with radiusr <40 km (e.g. Chelton et al., 2011). Whereas surface drifters can
15
detect sub-mesoscale eddies with radiusr <10 km (Berti et al., 2011; Li et al., 2011; Schroeder et al., 2012). Surface drifters have six-hour temporal resolution, much higher than altimetry data, the latter usually with seven-day or one-day intervals available to the public so far. Surface drifters give reliable in-situ observations and have been exten-sively used in other ocean regimes (Deverdiere, 1983; Chaigneau and Pizarro, 2005;
20
Hamilton, 2007; Li et al., 2011; Zu et al., 2012).
The present study investigates characteristics of eddy spatial and temporal distri-bution in the SIO based on in-situ surface drifters. We wish to address the following questions: do eddies have uniform spatial distribution? If no, what is different between cyclonic and anticyclonic eddies with different radii. Does eddies number have
sea-25
OSD
11, 2879–2905, 2014Eddy characteristics in the SIO as inferred
from surface drifter
Shaojun Zheng et al.
Title Page
Abstract Introduction
Conclusions References
Tables Figures
◭ ◮
◭ ◮
Back Close
Full Screen / Esc
Printer-friendly Version Interactive Discussion
Discussion
P
a
per
|
Discussion
P
a
per
|
Discussion
P
a
per
|
Discussion
P
a
per
|
The rest of this paper is organized as follows. Data and methods are introduced in Sect.2. Eddy characteristics and eddy statistics in the SIO are described in Sect. 3. Summary and discussion are given in Sect. 4.
2 Data and methods
The surface satellite-tracked drifter data used in this paper are archived at the Atlantic
5
Oceanographic and Meteorological Laboratory (AOML). The AOML receives drifter po-sitions from Doppler shift of its transmission from American-French satellite-based sys-tem (Argos, Lumpkin and Pazos, 2007). The Drifter Data Assembly Center (DAC) at AOML assembles these raw data, applies quality control procedures, and interpolates them via the kriging method to regular six-hour intervals (Hansen and Herman, 1989;
10
Hansen and Poulain, 1996). The drifter has their drogue centered at 15 m depth to measure surface currents, and a semi-rigid material throughout the drogue can pro-vide support for drifter to maintain its shape in high-shear flows (Lumpkin and Pazos, 2007). In this study, surface drifter data from February 1979 to September 2013 are used. There were a total 2226 drifters released in the IO (Fig. 2a), and their distribution
15
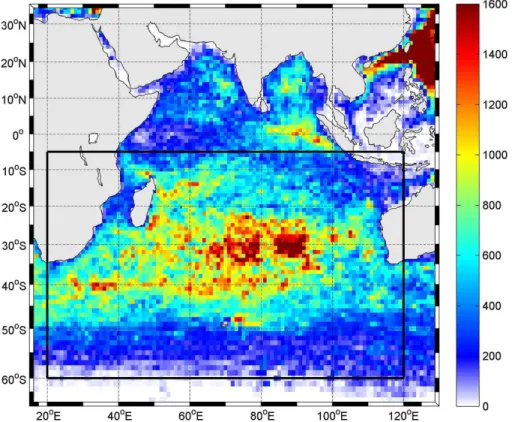
was not uniform. Drifters covered most of regions in the Arabian Sea and Bay of Ben-gal, but drifters were sparse south of 20◦S. Total 2567 drifters terminated (Fig. 2b) in the IO, a little more than released ones in the IO, which might come from the adjacent oceans. Drifters were released in particular areas, like along the commercial tracks, but they finally terminated uniform. Figure 3 shows drifter numbers passing through each
20
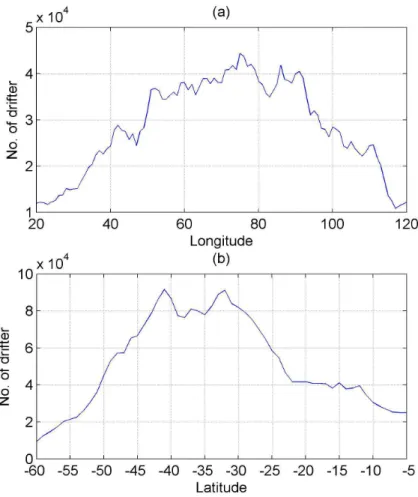
1◦×1◦ bin in their trajectories. Despite release locations mainly north of 20◦S, drifters prefer to stay in the central SIO. Therefore we select all 2082 drifters captured in re-gion of 20–120◦E, 5–60◦S (rectangular line in Fig. 3) to study the eddy characteristics. We also calculate drifters number as a function of longitude and latitude. There are two maxima near longitudes 75◦E and 90◦E (Fig. 4a), and two maxima near latitudes
25
OSD
11, 2879–2905, 2014Eddy characteristics in the SIO as inferred
from surface drifter
Shaojun Zheng et al.
Title Page
Abstract Introduction
Conclusions References
Tables Figures
◭ ◮
◭ ◮
Back Close
Full Screen / Esc
Printer-friendly Version Interactive Discussion
Discussion
P
a
per
|
Discussion
P
a
per
|
Discussion
P
a
per
|
Discussion
P
a
per
|
number of drifter observations in each year since 1985, and Fig. 5b shows the number of drifter observations in each climatological calendar month. Although surface drifter plan began in 1979, observations were sparse in the SIO before 1995 (Fig. 5a). The number of observations increased dramatically since 1995, and reached maximum in 2010. Fortunately, it does not show significant seasonal difference (Fig. 5b).
5
A geometric eddy identification method based on surface drifters has been success-fully used in the Northeastern Atlantic Ocean (Lankhorst, 2006; Lankhorst and Zenk, 2006), Kuroshio Extension Region (Dong et al., 2011) and northern South China Sea (Li et al., 2011). In our study, we use the method developed by Li et al. (2011) to identify eddies in the SIO. The method is based on definition of a closed loop with starting point
10
overlapped by ending point. Eddies are identified through four steps in brief (see more detail in Li et al., 2011): first, find overlapping points along surface drifter trajectories. Second, make quality-control on overlapping points to eliminate false points and avoid losing internal overlapping points. Third, determine polarity of loops (cyclonic or anti-cyclonic drifter track). In the Southern Hemisphere, when surface drifter is caught by
15
cyclone (anticyclone) eddy, it will make clockwise (counter-clockwise) loop. Forth, clus-ter loops to oceanic eddies. The loop cenclus-ter is estimated by geometrically averaging all the sample points in the loop. The loop radius is defined by mean distance between all loop points to the loop center. The eddy radius is defined by mean radius of clustered loops. To remove inertial oscillation, eddies with period less than double local inertial
20
oscillation period (T) are not included. The inertial oscillation period is calculated as follows:
T =2fπ, wheref =2Ωsin(ϕ), f is the Coriolis parameter,Ω is the earth rotating fre-quency (Ω =2π/24 h=7.27×10⁻⁵s−1),ϕis the latitude of the eddy centers.
To compare with eddies detected by surface drifter, mesoscale eddies in altimeter
25
observation of SSH are also used. The mesoscale eddies were detected from SSH-based automated eddy identification procedures distributed by Chelton et al. (2011).
OSD
11, 2879–2905, 2014Eddy characteristics in the SIO as inferred
from surface drifter
Shaojun Zheng et al.
Title Page Abstract Introduction Conclusions References Tables Figures ◭ ◮ ◭ ◮ Back Close
Full Screen / Esc
Printer-friendly Version Interactive Discussion Discussion P a per | Discussion P a per | Discussion P a per | Discussion P a per |
of Satellite Oceanographic data (AVISO). EKE are calculated by geostrophic velocity anomalies (Pujol and Larnicol, 2005; Jia et al., 2011) as follows:
EKE=12
Ug′2+V
′2 g
, Ug′ =−
g f
∆η′
∆y and V
′
g=
g f
∆η′
∆x, where U
′
g and V
′
g are the
geostrophic velocity anomalies,∆η′
is the SLA.
3 Eddy characteristics and statistics in the SIO
5
3.1 Number and radius
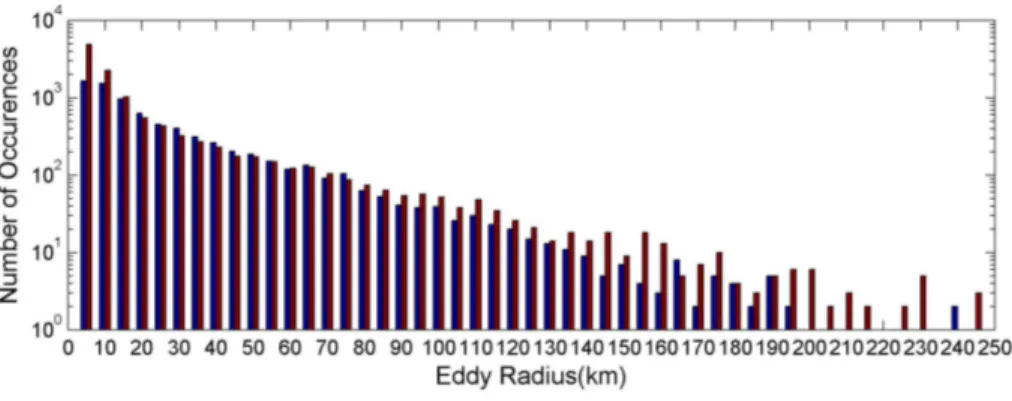
On the basis of the surface satellite-tracked drifter data, a total of 57 228 loops were detected in the SIO. Among them 22 773 are cyclonic loops and 34 455 are anticyclonic loops. After clustering the loops, total 19 252 eddies are detected with 7657 cyclonic eddies (clockwise) and 11 595 anticyclonic eddies (counter-clockwise). The number of
10
anticyclonic eddies account for 60 % of eddies. Figure 6 shows the histogram of eddy radius with bin width of 5 km, in which blue (red) bars depict cyclonic (anticyclonic) eddies. Submesoscale eddies (radius r <10 km) are identified successfully, and its number is 10 365 accounting for 54 % of total eddies. In term of submesoscale eddies, the ratio of cyclonic eddies to anticyclonic eddies is 1 to 2. With submesoscale eddies
15
excluded, the mean radius are 39, 37, and 41 km for all, cyclonic, and anticyclonic ed-dies, respectively. As documented by Chaigneau and Pizarro (2005), if drifters are on average statistically evenly distributed along the eddy radiusR, the probability density
p(r,θ) of finding the drifter at a radius r and directionθ relative to the eddy center is constant. The formulate is as follows:p(r,θ)=R 1
R
0 2π
R
0
rdrdθ
=πR12. The mean distanceR1,
20
or expectation E(r)= R R 0 2π R 0
r2p(r,θ) drdθ of drifter from the eddy center is then given
byR1=2R/3. The mean eddy diameter is 38 km in the SIO, implying a
OSD
11, 2879–2905, 2014Eddy characteristics in the SIO as inferred
from surface drifter
Shaojun Zheng et al.
Title Page
Abstract Introduction
Conclusions References
Tables Figures
◭ ◮
◭ ◮
Back Close
Full Screen / Esc
Printer-friendly Version Interactive Discussion
Discussion
P
a
per
|
Discussion
P
a
per
|
Discussion
P
a
per
|
Discussion
P
a
per
|
deformation radius (20–100 km) in the region of 10–50◦S in the SIO (Chelton et al., 1998).
3.2 Spatial distribution
Figure 7a shows eddies are densely distributed in the subtropical region in the central SIO. As drifters are also densely distributed in the central SIO (Fig. 3), a question is
5
whether the spatial distribution of eddies depends on that of drifter number or not? The ratio of eddies number to drifter number is high in band of 25–40◦S (Fig. 7b), which is not fully corresponding to the drifter distribution, especially in the Mozambique Channel (Fig. 3). Therefore, the spatial distribution of detected eddies do not completely depend on drifter distribution, and the method of eddy detecting works well in the sparse drifter
10
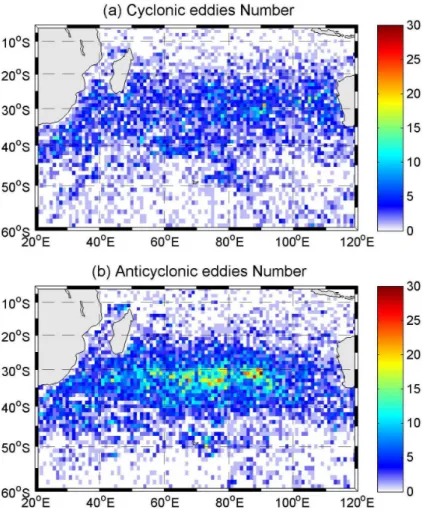
region. We separate cyclonic eddies (Fig. 8a) from anticyclonic eddies (Fig. 8b) to study their spatial distribution in detail. The cyclonic eddies have a relatively uniform spatial distribution and its number in most regions are less than 15 over 1◦×1◦bins. In contrast, the anticyclonic eddies are densely distributed in the central SIO with more than 15 eddies over 1◦×1◦bins.
15
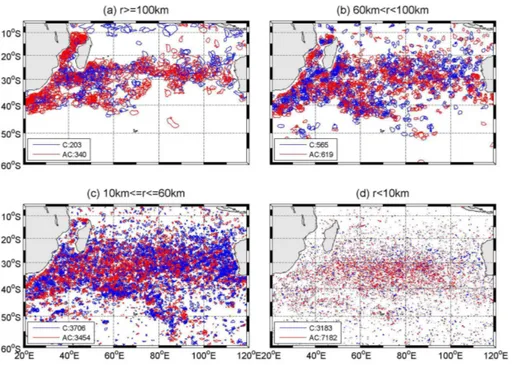
Spatial distribution of eddies varies with the size. All eddies are categorized into four groups according to their size: large eddies (r ≥100 km), middle eddies (100 km
> r >60 km), small eddies (60 km≥r≥10 km), and submesoscale eddies (r <10 km). Figure 9 shows the trajectories of cyclonic eddies (blue lines) and anticyclonic eddies (red lines) for four groups, and the number of cyclonic (anticyclonic) eddies are 203
20
(340), 565 (619), 3706 (3454), and 3183 (7182), respectively. The number of large anticyclonic eddies are more than that of cyclonic ones. Large eddies are populated along 25◦S band, Mozambique Channel, and Agulhas Current (Fig. 9a). Despite a lot of drifters can be found northeast of Madagascar (Fig. 3), there is no large eddies detected. There are few large eddies south of 43◦S, probably due to the Rossby
de-25
OSD
11, 2879–2905, 2014Eddy characteristics in the SIO as inferred
from surface drifter
Shaojun Zheng et al.
Title Page
Abstract Introduction
Conclusions References
Tables Figures
◭ ◮
◭ ◮
Back Close
Full Screen / Esc
Printer-friendly Version Interactive Discussion
Discussion
P
a
per
|
Discussion
P
a
per
|
Discussion
P
a
per
|
Discussion
P
a
per
|
of Madagascar. In the Mozambique Channel, the shape of large eddies is restrained by coastline in northeast-southwest direction. Middle eddies have similar spatial distri-bution to that of large eddies, but occur in a wider area. Middle eddies number is about 2 times the number of large eddies (Fig. 9b). Unlike other kind eddies, the number of small cyclonic eddies is greater than small anticyclonic eddies (Fig. 9c). The small
5
eddies are in the region range from 20 to 44◦S, and the distribution of cyclonic eddies appear northeast-southwest direction in the west of Australia. Here the distribution of cyclonic eddies is consistent with poleward propagation in the eastern boundary, which can be explained by theories for vortex propagation onβplane (Morrow et al., 2004). The submesoscale eddies are densely distribute over the entire SIO (Fig. 9d), which
10
has a similar pattern to that of total eddies (Fig. 7a). The submesoscale anticyclonic eddies are densely distributed in the subtropical basin in central SIO. The area of high number of submesoscale anticyclonic eddies agrees well with location of the garbage patches, where drifters converge due to convergence of surface flow (Maximenko et al., 2012; Van Sebille et al., 2012).
15
3.3 Temporal variations
The occurrence of eddies shows significant seasonal variations (Fig. 10a), with more eddies in austral autumn and winter and less eddies in austral spring and summer. The number of cyclonic eddies reaches maximum in August, whereas the number of anticyclonic eddies reaches minimum in September. If the submesoscale eddies are
20
not included, temporal variations of mesoscale eddies (Fig. 10b) are different from that of all eddies (Fig. 10a). The number of mesoscale eddies reach the maximum in October and the minimum in February, and the cyclonic and anticyclonic mesoscale eddies show similar seasonal variations.
To compare with seasonal variability of eddies detected from satellite observations,
25
OSD
11, 2879–2905, 2014Eddy characteristics in the SIO as inferred
from surface drifter
Shaojun Zheng et al.
Title Page
Abstract Introduction
Conclusions References
Tables Figures
◭ ◮
◭ ◮
Back Close
Full Screen / Esc
Printer-friendly Version Interactive Discussion
Discussion
P
a
per
|
Discussion
P
a
per
|
Discussion
P
a
per
|
Discussion
P
a
per
|
distribution with Fig. 10b. There are more eddies generated in austral spring (Fig. 11), and less eddies in austral summer.
The vertical velocity shear associated with SICC and SEC system intensifies due to enhanced flux forcing of combined meridional Ekman and geostrophic convergence in austral spring (Jia et al., 2011). The seasonal change of baroclinic instability and
5
EKE variations, induced by modulation of vertical velocity shear in the southeast Indian Ocean, favor the generation of eddies. In addition, other non-local processes including Leeuwin Current (Feng et al., 2007; Rennie et al., 2007) and Agulhas Current system (Backeberg et al., 2008; Beal et al., 2011) may also modulate the activity of mesoscale eddies. The mechanism of temporal variations of eddies needs further study.
10
4 Conclusions
Eddy characteristics in the SIO were investigated on the basis of in-situ satellite-tracked drifter data from 1979 to 2013. There are totally 19 252 eddies detected. Among them 7657 (11 595) are cyclonic (anticyclonic) eddies. For the submesoscale eddies, the ratio of cyclonic eddies (3183) to anticyclonic eddies (7182) is 1 to 2. Large eddies
15
(r≥100 km) populate a band along 25◦S, Mozambique Channel, and Agulhas Current.
The populated region of large eddies has a large EKE (blue rectangle in Fig. 12). In the Mozambique Channel, the shape of large eddies is restrained by coastline in northeast-southwest direction.
The mesoscale eddy number shows significant seasonal variations, and are
coher-20
ent with eddies generated in the SIO detected from altimetry observations. The spatial distribution of large eddies is overlapped with the large EKE region (Figs. 9a and 12). In the southeast Indian Ocean, vertical velocity shear results in seasonal baroclinic insta-bility, and leads to seasonal EKE variations (Jia et al., 2011). Therefore, the mechanism of temporal distribution of eddies may be link to baroclinic instability. There are several
25
Agul-OSD
11, 2879–2905, 2014Eddy characteristics in the SIO as inferred
from surface drifter
Shaojun Zheng et al.
Title Page
Abstract Introduction
Conclusions References
Tables Figures
◭ ◮
◭ ◮
Back Close
Full Screen / Esc
Printer-friendly Version Interactive Discussion
Discussion
P
a
per
|
Discussion
P
a
per
|
Discussion
P
a
per
|
Discussion
P
a
per
|
has Current system. The relationship between eddy activities and barotropic/baroclinic instabilities of currents should be studies in the future.
The dynamics of submesoscale eddies are distinct from the traditional mesoscale quasi-geostrophic theory (Thomas et al., 2008), and in situ submesoscale observation are still relatively scarce. Nencioli et al. (2013) estimated in situ submesoscale
hori-5
zontal eddy diffusivity across an ocean front in the western Gulf of Lion in the Mediter-ranean Sea, which may extend our understanding about submesoscale process with more in-situ observations in the future.
Acknowledgements. We thank Wei Zhuang for useful discussions and comments. The satellite-tracked drifter data was provide by the Drifter Data Assembly Center (DAC) at NOAA’s
At-10
lantic Oceanographic and Meteorological Laboratory (http://www.aoml.noaa.gov/envids/gld/ index.php). The drifter-derived mean flow data was also provided by DAC (http://www.aoml. noaa.gov/phod/dac/dac_meanvel.php). The mesoscale eddies data detected by altimeter ob-servation were obtained from mesoscale eddies in altimeter obob-servation of SSH (http:// cioss.coas.oregonstate.edu/eddies/). The SLA data was provide by AVISO (http://www.aviso.
15
altimetry.fr/en/home.html). This work was supported by “Strategic Priority Research Program” of the Chinese Academy of Sciences (XDA11010103), the Natural Science Foundation of China (41306018), the National Basic Research Program of China (2010CB950302, 2012CB955603), the Knowledge Innovation Program of the Chinese Academy of Sciences (SQ201108).
References
20
Abraham, E. R.: The generation of plankton patchiness by turbulent stirring, Nature, 391, 577– 580, doi:10.1038/35361, 1998.
Abraham, E. R., Law, C. S., Boyd, P. W., Lavender, S. J., Maldonado, M. T., and Bowie, A. R.: Importance of stirring in the development of an iron-fertilized phytoplankton bloom, Nature, 407, 727–730, doi:10.1038/35037555, 2000.
25
OSD
11, 2879–2905, 2014Eddy characteristics in the SIO as inferred
from surface drifter
Shaojun Zheng et al.
Title Page
Abstract Introduction
Conclusions References
Tables Figures
◭ ◮
◭ ◮
Back Close
Full Screen / Esc
Printer-friendly Version Interactive Discussion
Discussion
P
a
per
|
Discussion
P
a
per
|
Discussion
P
a
per
|
Discussion
P
a
per
|
variation around Gran Canaria, Deep-Sea Res. Pt. I, 44, 71–96, doi:10.1016/S0967-0637(96)00093-3, 1997.
Backeberg, B. C., Johonnessen, J. A., Bertino, L., and Reason, C. J.: The greater Agulhas Cur-rent system: an integrated study of its mesoscale variability, Journal of Operational Oceanog-raphy, 1, 29–44, 2008.
5
Beal, L. M., De Ruijter, W. P. M., Biastoch, A., Zahn, R., and SCOR/WCRP/IAPSO Working Group 136: On the role of the Agulhas system in ocean circulation and climate, Nature, 472, 429–436, doi:10.1038/Nature09983, 2011.
Berti, S., Dos Santos, F. A., Lacorata, G., and Vulpiani, A.: Lagrangian drifter dis-persion in the southwestern Atlantic Ocean, J. Phys. Oceanogr., 41, 1659–1672,
10
doi:10.1175/2011jpo4541.1, 2011.
Chaigneau, A. and Pizarro, O.: Eddy characteristics in the eastern South Pacific, J. Geophys. Res.-Oceans, 110, C06005, doi:10.1029/2004jc002815, 2005.
Chelton, D. B., DeSzoeke, R. A., Schlax, M. G., El Naggar, K., and Siwertz, N.: Geographical variability of the first baroclinic Rossby radius of deformation, J. Phys. Oceanogr., 28, 433–
15
460, doi:10.1175/1520-0485(1998)028<0433:Gvotfb>2.0.Co;2, 1998.
Chelton, D. B., Schlax, M. G., and Samelson, R. M.: Global observations of nonlinear mesoscale eddies, Prog. Oceanogr., 91, 167–216, doi:10.1016/j.pocean.2011.01.002, 2011. Crawford, W. R., Brickley, P. J., Peterson, T. D., and Thomas, A. C.: Impact of Haida eddies
on chlorophyll distribution in the Eastern Gulf of Alaska, Deep-Sea Res. Pt. II, 52, 975–989,
20
doi:10.1016/j.dsr2.2005.02.011, 2005.
de Ruijter, W. P. M., Ridderinkhof, H., Lutjeharms, J. R. E., Schouten, M. W., and Veth, C.: Observations of the flow in the Mozambique Channel, Geophys. Res. Lett., 29, 1502, doi:10.1029/2001gl013714, 2002.
de Ruijter, W. P. M., van Aken, H. M., Beier, E. J., Lutjeharms, J. R. E., Matano, R. P., and
25
Schouten, M. W.: Eddies and dipoles around South Madagascar: formation, pathways and large-scale impact, Deep-Sea Res. Pt. I, 51, 383–400, doi:10.1016/j.dsr.2003.10.011, 2004. Deverdiere, A. C.: Lagrangian eddy statistics from surface drifters in the eastern North-Atlantic,
J. Mar. Res., 41, 375–398, 1983.
Dong, C., McWilliams, J. C., Liu, Y., and Chen, D.: Global heat and salt transports by eddy
30
movement, Nature Communications, 5, 3294, doi:10.1038/ncomms4294, 2014.
OSD
11, 2879–2905, 2014Eddy characteristics in the SIO as inferred
from surface drifter
Shaojun Zheng et al.
Title Page
Abstract Introduction
Conclusions References
Tables Figures
◭ ◮
◭ ◮
Back Close
Full Screen / Esc
Printer-friendly Version Interactive Discussion
Discussion
P
a
per
|
Discussion
P
a
per
|
Discussion
P
a
per
|
Discussion
P
a
per
|
Kuroshio extension region, J. Atmos. Ocean. Tech., 28, 1167–1176, doi:10.1175/Jtech-D-10-05028.1, 2011.
Donners, J. and Drijfhout, S. S.: The Lagrangian view of South Atlantic Interocean exchange in a global ocean model compared with inverse model results, J. Phys. Oceanogr., 34, 1019– 1035, doi:10.1175/1520-0485(2004)034<1019:Tlvosa>2.0.Co;2, 2004.
5
Falkowski, P. G., Ziemann, D., Kolber, Z., and Bienfang, P. K.: Role of Eddy pumping in enhanc-ing primary production in the ocean, Nature, 352, 55–58, doi:10.1038/352055a0, 1991. Feng, M., Majewski, L. J., Fandry, C. B., and Waite, A. M.: Characteristics of two
counter-rotating eddies in the Leeuwin Current system offthe Western Australian coast, Deep-Sea Res. Pt. II, 54, 961–980, doi:10.1016/j.dsr2.2006.11.022, 2007.
10
Gordon, A. L., Weiss, R. F., Smethie, W. M., and Warner, M. J.: Thermocline and intermedi-ate wintermedi-ater communication between the South-Atlantic and Indian Oceans, J. Geophys. Res.-Oceans, 97, 7223–7240, doi:10.1029/92jc00485, 1992.
Hamilton, P.: Eddy statistics from Lagrangian drifters and hydrography for the northern Gulf of Mexico slope, J. Geophys. Res.-Oceans, 112, C09002, doi:10.1029/2006jc003988, 2007.
15
Hansen, D. and Herman, A.: Temporal sampling requirements for surface drifting buoys in the tropical Pacific, J. Atmos. Ocean. Tech., 6, 599–607, 1989.
Hansen, D. V. and Poulain, P. M.: Quality control and interpolations of WOCE-TOGA drifter data, J. Atmos. Ocean. Tech., 13, 900–909, doi:10.1175/1520-0426(1996)013<0900:qcaiow>2.0.co;2, 1996.
20
Jia, F., Wu, L., and Qiu, B.: Seasonal Modulation off Eddy Kinetic Energy and Its For-mation Mechanism in the southeast Indian Ocean, J. Phys. Oceanogr., 41, 657–665, doi:10.1175/2010jpo4436.1, 2011.
Lankhorst, M.: A self-contained identification scheme for eddies in drifter and float trajectories, J. Atmos. Ocean. Tech., 23, 1583–1592, doi:10.1175/Jtech1931.1, 2006.
25
Lankhorst, M. and Zenk, W.: Lagrangian observations of the middepth and deep velocity fields of the northeastern Atlantic Ocean, J. Phys. Oceanogr., 36, 43–63, doi:10.1175/jpo2869.1, 2006.
Ledwell, J. R., Watson, A. J., and Law, C. S.: Evidence for Slow Mixing across the Pycnocline from an Open-Ocean Tracer-Release Experiment, Nature, 364, 701–703,
30
OSD
11, 2879–2905, 2014Eddy characteristics in the SIO as inferred
from surface drifter
Shaojun Zheng et al.
Title Page
Abstract Introduction
Conclusions References
Tables Figures
◭ ◮
◭ ◮
Back Close
Full Screen / Esc
Printer-friendly Version Interactive Discussion
Discussion
P
a
per
|
Discussion
P
a
per
|
Discussion
P
a
per
|
Discussion
P
a
per
|
Lévy M. and Klein, P.: Does the low frequency variability of mesoscale dynamics explain a part of the phytoplankton and zooplankton spectral variability?, P. R. Soc. London, 460, 1673– 1683, 2004.
Lévy, M., Klein, P., and Tréguier, A. M.: Impacts of submesoscale physics on phytoplankton production and subduction, J. Mar. Res., 59, 535–565, 2001.
5
Li, J., Zhang, R., and Jin, B.: Eddy characteristics in the northern South China Sea as inferred from Lagrangian drifter data, Ocean Sci., 7, 661–669, doi:10.5194/os-7-661-2011, 2011. Lumpkin, R. and Johnson, G. C.: Global ocean surface velocities from drifters: mean, variance,
El Niño–Southern Oscillation response, and seasonal cycle, J. Geophys. Res.-Oceans, 118, 2992–3006, doi:10.1002/Jgrc.20210, 2013.
10
Lumpkin, R. and Pazos, M.: Measuring surface currents with Surface Velocity Program drifters: the instrument, its data, and some recent results, Lagrangian analysis and prediction of coastal and ocean dynamics, 39–67, 2007.
Maximenko, N., Hafner, J., and Niiler, P.: Pathways of marine debris derived from trajectories of Lagrangian drifters, Mar. Pollut. Bull., 65, 51–62, doi:10.1016/j.marpolbul.2011.04.016,
15
2012.
Mcwilliams, J. C.: The nature and consequences of oceanic Eddies, in: Ocean Modeling in an Eddying Regime, edited by: Hecht, M. W. and Hasumi, H., American Geophysical Union, Washington D.C., 5–15, doi:10.1029/177GM03, 2013.
Morrow, R., Birol, F., Griffin, D., and Sudre, J.: Divergent pathways of cyclonic and anti-cyclonic
20
ocean eddies, Geophys. Res. Lett., 31, L24311, doi:10.1029/2004gl020974, 2004.
Nencioli, F., d’Ovidio, F., Doglioli, A. M., and Petrenko, A. A.: In situ estimates of submesoscale horizontal eddy diffusivity across an ocean front, J. Geophys. Res.-Oceans, 118, 7066–7080, doi:10.1002/2013jc009252, 2013.
Palastanga, V., van Leeuwen, P. J., and de Ruijter, W. P. M.: A link between low-frequency
25
mesoscale eddy variability around Madagascar and the large-scale Indian Ocean variability, J. Geophys. Res.-Oceans, 111, C09029, doi:10.1029/2005jc003081, 2006.
Pujol, M. I. and Larnicol, G.: Mediterranean sea eddy kinetic energy variability from 11 years of altimetric data, J. Marine Syst., 58, 121–142, doi:10.1016/j.jmarsys.2005.07.005, 2005. Qiu, B. and Chen, S. M.: Eddy-induced heat transport in the subtropical North Pacific from Argo,
30
OSD
11, 2879–2905, 2014Eddy characteristics in the SIO as inferred
from surface drifter
Shaojun Zheng et al.
Title Page
Abstract Introduction
Conclusions References
Tables Figures
◭ ◮
◭ ◮
Back Close
Full Screen / Esc
Printer-friendly Version Interactive Discussion
Discussion
P
a
per
|
Discussion
P
a
per
|
Discussion
P
a
per
|
Discussion
P
a
per
|
Quartly, G. D. and Srokosz, M. A.: Eddies in the southern Mozambique Channel, Deep-Sea Res. Pt. II, 51, 69–83, doi:10.1016/j.dsr2.2003.03.001, 2004.
Quartly, G. D., Buck, J. J. H., Srokosz, M. A., and Coward, A. C.: Eddies around Madagascar – the retroflection re-considered, J. Marine Syst., 63, 115–129, doi:10.1016/j.jmarsys.2006.06.001, 2006.
5
Rennie, S. J., Pattiaratchi, C. P., and McCauley, R. D.: Eddy formation through the interaction between the Leeuwin Current, Leeuwin Undercurrent and topography, Deep-Sea Res. Pt. II, 54, 818–836, doi:10.1016/j.dsr2.2007.02.005, 2007.
Ridderinkhof, H., van der Werf, P. M., Ullgren, J. E., van Aken, H. M., van Leeuwen, P. J., and de Ruijter, W. P. M.: Seasonal and interannual variability in the Mozambique
10
Channel from moored current observations, J. Geophys. Res.-Oceans, 115, C06010, doi:10.1029/2009jc005619, 2010.
Schott, F. A. and McCreary, J. P.: The monsoon circulation of the Indian Ocean, Prog. Oceanogr., 51, 1–123, doi:10.1016/S0079-6611(01)00083-0, 2001.
Schott, F. A., Xie, S. P., and McCreary, J. P.: Indian Ocean circulation and climate variability,
15
Rev. Geophys., 47, Rg1002, doi:10.1029/2007rg000245, 2009.
Schouten, M. W., de Ruijter, W. P. M., van Leeuwen, P. J., and Ridderinkhof, H.: Ed-dies and variability in the Mozambique Channel, Deep-Sea Res. Pt. II, 50, 1987–2003, doi:10.1016/s0967-0645(03)00042-0, 2003.
Schroeder, K., Chiggiato, J., Haza, A. C., Griffa, A., Ozgokmen, T. M., Zanasca, P., Molcard, A.,
20
Borghini, M., Poulain, P. M., Gerin, R., Zambianchi, E., Falco, P., and Trees, C.: Targeted Lagrangian sampling of submesoscale dispersion at a coastal frontal zone, Geophys. Res. Lett., 39, L11608, doi:10.1029/2012gl051879, 2012.
van Sebille, E., England, M. H., and Froyland, G.: Origin, dynamics and evolution of ocean garbage patches from observed surface drifters, Environ. Res. Lett., 7, 044040,
25
doi:10.1088/1748-9326/7/4/044040, 2012.
Volkov, D. L., Lee, T., and Fu, L.-L.: Eddy-induced meridional heat transport in the ocean, Geophys. Res. Lett., 35, L20601, doi:10.1029/2008gl035490, 2008.
Zhang, Z. G., Wang, W., and Qiu, B.: Oceanic mass transport by mesoscale eddies, Science, 345, 322–324, doi:10.1126/science.1252418, 2014.
30
OSD
11, 2879–2905, 2014Eddy characteristics in the SIO as inferred
from surface drifter
Shaojun Zheng et al.
Title Page
Abstract Introduction
Conclusions References
Tables Figures
◭ ◮
◭ ◮
Back Close
Full Screen / Esc
Printer-friendly Version Interactive Discussion
Discussion
P
a
per
|
Discussion
P
a
per
|
Discussion
P
a
per
|
Discussion
P
a
per
|
Figure 3.Number of drifters passing through each 1◦
×1◦
OSD
11, 2879–2905, 2014Eddy characteristics in the SIO as inferred
from surface drifter
Shaojun Zheng et al.
Title Page
Abstract Introduction
Conclusions References
Tables Figures
◭ ◮
◭ ◮
Back Close
Full Screen / Esc
Printer-friendly Version Interactive Discussion
Discussion
P
a
per
|
Discussion
P
a
per
|
Discussion
P
a
per
|
Discussion
P
a
per
|
Figure 7. (a)Number of eddies detected in 1◦
×1◦ bin.(b)Ratio of eddies number to drifters
number in 1◦
×1◦
OSD
11, 2879–2905, 2014Eddy characteristics in the SIO as inferred
from surface drifter
Shaojun Zheng et al.
Title Page
Abstract Introduction
Conclusions References
Tables Figures
◭ ◮
◭ ◮
Back Close
Full Screen / Esc
Printer-friendly Version Interactive Discussion
Discussion
P
a
per
|
Discussion
P
a
per
|
Discussion
P
a
per
|
Discussion
P
a
per
|
OSD
11, 2879–2905, 2014Eddy characteristics in the SIO as inferred
from surface drifter
Shaojun Zheng et al.
Title Page
Abstract Introduction
Conclusions References
Tables Figures
◭ ◮
◭ ◮
Back Close
Full Screen / Esc
Printer-friendly Version Interactive Discussion
Discussion
P
a
per
|
Discussion
P
a
per
|
Discussion
P
a
per
|
Discussion
P
a
per
|
OSD
11, 2879–2905, 2014Eddy characteristics in the SIO as inferred
from surface drifter
Shaojun Zheng et al.
Title Page
Abstract Introduction
Conclusions References
Tables Figures
◭ ◮
◭ ◮
Back Close
Full Screen / Esc
Printer-friendly Version Interactive Discussion
Discussion
P
a
per
|
Discussion
P
a
per
|
Discussion
P
a
per
|
Discussion
P
a
per
|
OSD
11, 2879–2905, 2014Eddy characteristics in the SIO as inferred
from surface drifter
Shaojun Zheng et al.
Title Page
Abstract Introduction
Conclusions References
Tables Figures
◭ ◮
◭ ◮
Back Close
Full Screen / Esc
Printer-friendly Version Interactive Discussion
Discussion
P
a
per
|
Discussion
P
a
per
|
Discussion
P
a
per
|
Discussion
P
a
per
|