www.biogeosciences.net/13/3777/2016/ doi:10.5194/bg-13-3777-2016
© Author(s) 2016. CC Attribution 3.0 License.
Summer fluxes of methane and carbon dioxide from a pond and
floating mat in a continental Canadian peatland
Magdalena Burger1,2, Sina Berger1,2, Ines Spangenberg1,2, and Christian Blodau1,2
1Ecohydrology and Biogeochemistry Group, Institute of Landscape Ecology, University of Münster, Münster, Germany 2School of Environmental Sciences, University of Guelph, Guelph, Canada
Correspondence to:Christian Blodau (christian.blodau@uni-muenster.de)
Received: 22 November 2015 – Published in Biogeosciences Discuss.: 22 January 2016 Revised: 14 May 2016 – Accepted: 17 May 2016 – Published: 30 June 2016
Abstract. Ponds smaller than 10 000 m2likely account for about one-third of the global lake perimeter. The release of methane (CH4) and carbon dioxide (CO2) from these
ponds is often high and significant on the landscape scale. We measured CO2 and CH4fluxes in a temperate peatland
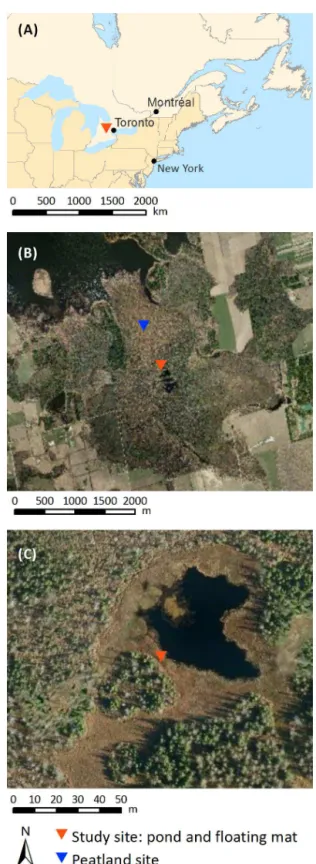
in southern Ontario, Canada, in summer 2014 along a tran-sect from the open water of a small pond (847 m2)towards the surrounding floating mat (5993 m2) and in a peatland reference area. We used a high-frequency closed chamber technique and distinguished between diffusive and ebulli-tive CH4 fluxes. CH4fluxes and CH4bubble frequency
in-creased from a median of 0.14 (0.00 to 0.43) mmol m−2h−1
and 4 events m−2h−1on the open water to a median of 0.80
(0.20 to 14.97) mmol m−2h−1 and 168 events m−2h−1 on the floating mat. The mat was a summer hot spot of CH4
emissions. Fluxes were 1 order of magnitude higher than at an adjacent peatland site. During daytime the pond was a net source of CO2 equivalents to the atmosphere amounting to
0.13 (−0.02 to 1.06) g CO2 equivalents m−2h−1, whereas the adjacent peatland site acted as a sink of −0.78 (−1.54 to 0.29) g CO2 equivalents m−2h−1. The photosynthetic
CO2 uptake on the floating mat did not counterbalance the
high CH4 emissions, which turned the floating mat into a
strong net source of 0.21 (−0.11 to 2.12) g CO2equivalents m−2h−1. This study highlights the large small-scale
variabil-ity of CH4fluxes and CH4bubble frequency at the peatland–
pond interface and the importance of the often large ecotone areas surrounding small ponds as a source of greenhouse gases to the atmosphere.
1 Introduction
Inland waters play a significant role in the global carbon cy-cle although covering only 3.7 % of the Earth’s land surface (Bastviken et al., 2011; Raymond et al., 2013; Tranvik et al., 2009). They transport and sequester autochthonous and ter-restrially derived carbon and are also sources of carbon diox-ide (CO2)and methane (CH4)to the atmosphere (Cole et al.,
2007; Tranvik et al., 2009). Global estimates of CO2and CH4
emissions from inland waters have recently been corrected upward to 2.1 Pg C yr−1as CO
2(Raymond et al., 2013) and
0.65 Pg C yr−1as CH
4(Bastviken et al., 2011). Together they
are similar to the net carbon uptake by terrestrial ecosystems of −2.5±1.3 Pg C yr−1 and to approximately one-third of
the anthropogenic CO2emissions (Ciais et al., 2013).
Small aquatic systems may be particularly important in this respect (Downing, 2010). According to high-resolution satellite imagery analyzed by Verpoorter et al. (2014), 77 % of the total 117 million lakes belong to the smallest de-tectable size category of 2000 to 10 000 m2lake area. These waters only contribute 7 % to the area but 32 % to the total lake perimeter (Verpoorter et al., 2014). Numerous processes were found to proceed faster in small aquatic systems than in larger ones. Sequestration rates of organic carbon (Down-ing, 2010; Downing et al., 2008), the concentrations of CH4,
CO2, and dissolved organic carbon (DOC) in the water
col-umn (Bastviken et al., 2004; Juutinen et al., 2009; Kelly et al., 2001; Kortelainen et al., 2006; Xenopoulos et al., 2003), and CH4 and CO2emissions from the water to the atmosphere
Small and shallow lakes and ponds are common in flat northern glacial landscapes and abundant in peatland areas, where 20 to 30 % of the world’s soil organic carbon is stored (Turunen et al., 2002). CO2 emissions from peatland ponds
were reported to be in the same order of magnitude than net uptake of CO2by the peatland vegetation (Dinsmore et al.,
2009; Hamilton et al., 1994). CH4emissions from open
wa-ters generally exceed CH4fluxes from vegetated areas by a
factor 3 to 25 (Hamilton et al., 1994; McLaughlin and Web-ster, 2014; Trudeau et al., 2013). Small and shallow peat-land ponds have been generally found to be particular strong emitters of the gas (McEnroe et al., 2009; Trudeau et al., 2013). Moreover, CH4 and CO2 emissions from open
wa-ters can be significant on the landscape scale despite their of-ten small area (Dinsmore et al., 2010; Juutinen et al., 2013). Pelletier et al. (2014) estimated that a pond cover of > 37 % could convert a northern peatland from a carbon sink into a carbon source. Such findings are relevant as Hamilton et al. (1994) and Trudeau et al. (2013) reported a pond cover of 8 to 12 and 42 % in fens and bogs in northern Canada. The authors suspected a contribution of aquatic CH4fluxes
to landscape CH4 fluxes of 30 and 79 %, respectively. Very
high CH4emissions have also been reported from a floating
mat on a thermokarst pond and a floating mat within a bog pond (Flessa et al., 2008; Sugimoto and Fujita, 1997). Juuti-nen et al. (2013) documented highest CH4fluxes from a wet
lawn adjacent to a small fen lake compared to the lake itself and fen lawns farther away from the small lake.
Fluxes of CH4and CO2from ponds are controlled by
en-vironmental and biotic factors. Atmospheric CH4fluxes are
controlled by microbial production and oxidation of CH4
within peat, sediment and surface water and the diffusive, ebullitive, and plant-mediated transport to the atmosphere (Bastviken et al., 2004; Bridgham et al., 2013; Carmichael et al., 2014). CO2exchange is driven by the interplay of
het-erotrophic and autotrophic respiration and by photosynthesis of aquatic macrophytes and algae. Both gas fluxes are linked to the quantity and quality of organic and inorganic carbon supplied from the surrounding catchment (Huttunen et al., 2002; Macrae et al., 2004; Tranvik et al., 2009). They are also related to temperature, wind speed and air pressure (e. g. Trudeau et al., 2013; Varadharajan and Hemond, 2012; Wik et al., 2013). Ebullition appears to be of particular importance for CH4release to the atmosphere (Walter et al., 2006; Wik
et al., 2013) and varies on scales of several tens to hundreds of meters (Bastviken et al., 2004; Wik et al., 2013). Emis-sions of CH4are generally lower in the pelagic than in the
lit-toral zone, where plant habitats further influence fluxes (Juu-tinen et al., 2001; Larmola et al., 2004). On the other hand, Trudeau et al. (2013) found 2.5 to 5 times lower CH4fluxes
at the border of fen pools than in the center of the pools with areas of 60 and 200 m2. Measurements in this study were car-ried out in a situation where pool size has been historically increasing at the expense of surrounding terrestrial areas.
Despite this progress, knowledge on the temporal and spa-tial variability of CH4 and CO2 fluxes within small pond
systems is limited. We know, for example, little about the CH4 and CO2 exchange of transition zones between ponds
and surrounding peatlands, which can be especially impor-tant due to the high perimeter to area ratio of small ponds (Verpoorter et al., 2014). It is important to consider the net effect of different microforms of peatlands by taking into ac-count the global warming potentials, as CH4emissions may
easily offset carbon sinks in ponds. To gain more insight into these issues we investigated the summer atmospheric CO2 and CH4 exchange of open water, a floating mat and
an adjacent peatland area in a temperate peatland in southern Ontario, Canada. In particular we tested the hypothesis that (i) ebullitive and diffusive CH4fluxes increase from the open
water towards a floating mat surrounding the pond. We ex-amined further the expectation that (ii) CH4and CO2effluxes
from the system increase with temperature and wind speed, and investigated if falling air pressure raises CH4fluxes. To
assess the importance of the pond system for the greenhouse gas balance we calculated the net radiative forcing of the in-vestigated peatland microforms.
2 Materials and methods 2.1 Study site
precipitation of 946 mm including 148 mm of snowfall, and an average frost-free period from 7 May to 6 October (1981 to 2010, Fergus Shand Dam, National Climate Data and In-formation Archive, 2014).
2.2 Environmental variables
Air temperature, relative humidity, wind speed, wind direc-tion, photosynthetically active radiation (PAR) and precipita-tion were recorded at the study site by a HOBO U30 weather station (U30-NRC-SYS-B, Onset) (Table S2). Water temper-ature of the pond and the tempertemper-ature of the floating mat were also continuously measured. Air pressure was recorded at a distance of 1.1 km from the study site (Table S2). In addition we qualitatively observed presence of algae in the pond and occasionally took pictures of the pond and algae.
2.3 CH4and CO2flux measurements with closed
chambers
CH4and CO2fluxes of the pond and the floating mat were
measured once a week from 10 July to 29 September 2014 between 1 p.m.±1.5 h and 5 p.m.±1.5 h using closed cham-bers designed according to Drösler (2005). We used a long wooden board floating on air-filled canisters on the pond-end (“floating boardwalk”) to do our measurements and to minimize pressure on the ground (Supplement Fig. S1). The other end was secured at the drier end of the float-ing mat. The cylindrical, transparent Plexiglas chambers had a basal area of 0.12 m2 and a height of 0.40 m. They
were equipped with two or three fans (Micronel Ventilator D341T012GK-2, BEDEK GmbH) to circulate the air, a pho-tosynthetically active radiation (Photosynthetic Light (PAR) Smart Sensor, S-LIA-M002, Onset) and an air temperature sensor (RH Smart Sensor, S-THB-M002, Onset; see also Supplement for further information on instrumentation, Ta-ble S2). To compensate for air pressure differences, we at-tached a vent tube, 12 cm long and 7 mm inner diameter, to the chamber (Davidson et al., 2002). Transparent chambers were used to measure net ecosystem exchange (NEE) and cooled with up to six ice packs depending on ambient tem-perature to ensure a temtem-perature change of less than 1◦C during the chamber closure. For the measurements, ber orientation was adjusted to avoid shading of the cham-ber basal area by the ice packs. Ecosystem respiration (ER) was measured with chambers covered with reflective insola-tion foil. On the water, chambers were operated with a Sty-rofoam float (0.80 m×0.61 m×0.08 m). The chamber walls extended 10 cm below the water surface as recommended by Soumis et al. (2008). CH4and CO2concentrations were
quantified with an Ultraportable Greenhouse Gas Analyzer (915-001, Los Gatos Research) at a temporal resolution of 1 s. According to the manufacturer, a single data point has a precision of < 2 ppb for CH4and < 300 ppb for CO2.
Stabil-ity of the calibration was checked in March and August 2014.
The air was circulated between the chamber and the analyzer through low-density polyethylene tubes of 5 m length with an inner diameter of 2 mm and a water vapor trap. Using this setup it took 36 s until the sampling cell of the analyzer was fully flushed and the concentration had stabilized.
Flux measurements on the open water were carried out in six locations with increasing distance of 0.7 to 4.6 m to the floating mat (Supplement Table S3). A float with cham-ber was secured in place by a couple of telescopic poles that were rigidly connected to the floating boardwalk. This way we avoided a drifting of the chamber. On the floating mat the chambers were placed on cylindrical PVC collars with a height of 25 cm. Collars had been inserted into the mat to depths of approximately 15 cm prior to the first measure-ment. Each sampling day, fluxes were measured at least once with the transparent and with the radiation-shielded cham-ber, for 5 min on the pond and 3 min on the floating mat, by placing the chamber gently as soon as the concentration read-ing was stable. When CH4concentrations increased sharply
within the first 60 s of the measurement due to CH4
bub-ble release caused by the positioning of the chamber, the measurement was discarded and repeated. Fluxes were also quantified at a peatland site in the north–northeast of the pond (Fig. 1) with the same approach, every other week from 4 July until 1 October 2014, on 12 measuring plots covering hummocks, hollows, and lawns. In this area of the peatland, hummocks cover 90 % of the area, hollows 9.8 % and lawns 0.2 % of the area.
Fluxes were calculated based on the gas concentration change in the chamber over time using linear regression and the ideal gas law, mean air temperature inside the cham-ber and the corresponding half hour mean air pressure. The chamber volume was calculated for each measurement de-pending on the number of ice packs, immersion depth on the pond and mean vegetation height on the floating mat. The first 40 s after chamber deployment were discarded for flux calculation due to the response time of the concentra-tion measurement. If the slope was not significantly differ-ent from 0 (F test, α=0.05), the flux was set to 0. Con-centration change over time was only < 3 ppm CO2 and
< 0.1 ppm CH4 in 12 % of flux measurements. These
mea-surements resulted in fluxes close to 0 with R2< 0.8. Fol-lowing Repo et al. (2007), we included them in the data set because their exclusion would have biased the results by in-creasing the median diffusive fluxes by 52 % (CO2)and 12 %
(CH4).
Due to the high temporal resolution of concentration mea-surements, we were able to quantify CH4 fluxes with and
without bubbles. When the CH4concentrations evolved
lin-early with a constant slope we used linear regression over the entire time of sampling; when the initial concentration trend was interrupted by one or several sharp increases in slope, followed by a return to the initial slope (Fig. S1), we used piecewise linear fitting for each of the linear seg-ments (Goodrich et al., 2011). According to Goodrich et
al. (2011) and Xiao et al. (2014), we define sharp increases in slope as ebullitive CH4fluxes and all others as diffusive
or continuous flux of micro-bubbles. Time-weighted aver-ages including diffusive and ebullitive flux segments were calculated. We also computed the CH4bubble frequency in
events m−2h−1 as the number of bubble events divided by measuring time and area. In order to evaluate the contribu-tion of ebullitive CH4 flux to the total CH4 flux, the CH4
release of each event in µmol was calculated by multiplying the ebullitive flux with the duration of the event and the basal area of the chamber.
For comparisons of NEE between sites and with time, we used the maximum NEE defined as light-saturated at PAR levels > 1000 µmol m−2s−1according to a study by Larmola et al. (2013). We further calculated the net exchange of CO2
equivalents for each flux measurement. To this end, the CH4
flux was converted into CO2equivalents by multiplying the
mass flux with the global warming potential of 28 for a 100 year time horizon (Myhre et al., 2013). Subsequently, the CH4 flux in CO2equivalents and the maximum NEE were
summed up.
2.4 CO2concentration measurements and gradient
flux calculations
To obtain estimates of daily time series of CO2
concentra-tion and fluxes, concentraconcentra-tions of CO2 in the surface
wa-ter of the pond and in the air were measured with cali-brated non-dispersive infrared absorption sensors (CARBO-CAB, GMP222, Vaisala) in the range up to 10 000 ppm and with an accuracy of±150 ppm plus 2 % of the reading. The probe was enclosed in CO2permeable silicone tubes, as
al-ready used by Estop-Aragonés et al. (2012) in peats, and attached to a floating platform at a depth of approximately 18 cm and a distance of 3.2 m from the pond margin. In water equilibration time to 90 % of dissolved concentration was ap-proximately 1 h when concentration increased but more de-layed when it fell (Fig. S3). The platform also carried the data logger (MI70, Vaisala). Another silicon-covered sensor measured air CO2 concentrations at 0.3 m above the water
surface. Concentration was recorded every 15 min and CO2
flux across the air–water interface estimated according to the boundary layer equation approach (Supplement). Due to fre-quent failures of the sensors with increased humidity in the sensor head and overheating of the data logger, CO2 fluxes
were only calculated for 5 and 3 exemplary days in July and September, respectively. During these periods sensor func-tioning was stable.
2.5 CH4and CO2concentrations and diffusive fluxes
in the sediment
Dissolved CH4 and CO2 concentrations at the sediment–
Hesslein (1976). The chambers were filled with deionized water, covered with a nylon membrane of 0.2 µm pore size, installed at four locations randomly distributed across the pond on 21 August 2014 and sampled on 25 and 29 Septem-ber 2014. The pH of every other cell was measured in the field and a sample of 0.5 mL from each chamber filled into a vial containing 20 µL of 4 M hydrochloric acid (HCl). CO2
and CH4 concentrations in the headspace of the vials were
determined with an SRI 8610C gas chromatograph equipped with a methanizer and a flame ionization detector on the day after sampling. The original CO2 and CH4
concentra-tions in the pore water were calculated by using the measured headspace concentrations, Henry’s law with temperature cor-rected Henry’s law constants (Sander, 1999) and the ideal gas law. Diffusive fluxes of CO2and CH4towards the sediment–
water interface were calculated with Fick’s first law and dif-fusion coefficients in water Dw corrected for an assumed
sediment temperature of 15◦C (CH
4: 1.67×10⁻⁵cm2s−1;
CO2: 1.87×10⁻⁵cm2s−1)and assuming a porositynof 0.9.
The effect of porosity on the sediment diffusion coefficient was accounted for by multiplyingDwwith a factorn2
(Ler-man, 1978). We further calculated a theoretical temperature-and depth-dependent threshold of bubble formation using Henry’s law, correcting Henry’s law constant for a temper-ature of 15◦C, and assuming a partial pressure of N2in the
pore water of 0.8 or 0.5 atm. The assumption here is that bub-ble formation is possibub-ble when the partial pressure of CH4
and remaining N2 exceeds atmospheric and water pressure
in the anoxic sediment. In addition we sampled occasionally gas bubbles trapped in an algal mat that was present on the pond until 12 August.
2.6 Statistical analyses
Statistical analyses were performed with R, version 3.1.2 (R Core Team, 2014). All data sets were checked for normality with the Shapiro–Wilk normality test at a confidence level of α=0.05. To investigate statistical differences of a con-tinuous variable between two or more groups, we used the non-parametric Kruskal–Wallis rank sum test (α=0.05) and if applicable afterwards the multiple comparison test after Kruskal–Wallis (α=0.05) since none of the data sets were normally distributed. For the investigation of relationships between two continuous variables, we used Spearman’s rank correlation (α=0.05). Due to visually different dynamics of the gas fluxes from 10 July to 7 August (here called “mid summer”) compared to 15 August to 29 September (here called “late summer”), correlations with environmental vari-ables were examined for the whole period as well as the two subperiods. -5 5 15 25 T e m p e ra tu re ( ° C ) 0 500 1000 1500 2000 P A R ( µ m o l m −
2 s
− 1) 940 950 960 970 Ai r p re s s u re ( h P a ) 0 2 4 6 W in d s p e e d ( m s −1)
4 Jul 18 Jul 1 Aug 15 Aug 29 Aug 12 Sep 26 Sep
Cu m u la ti v e r a in fa ll (m m ) 0 100 200 300 400 0 2 4 6 8 Ra in i n te n s it y (m m ( 5 m in) −1) N o data
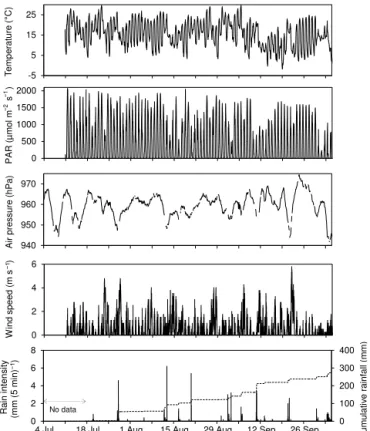
Figure 2.Time series of weather variables at the study site. Air tem-perature, photosynthetically active radiation (PAR) and air pressure are shown as hourly means, wind speed and rain intensity as 5 min averages. The dashed line in the lowest panel shows the cumulative rainfall.
3 Results
3.1 Weather and pond conditions
Three distinct periods of weather occurred. From 10 July until 10 September 2014, air temperatures remained high with a mean (±standard deviation) of 17.0±2.7◦C (Fig. 2). Most days were sunny with some passing clouds. From 11 to 22 September 2014, mean air temperature had cooled to 10.2±2.8◦C and the first frost occurred on 14 Septem-ber (Fig. 2). From 23 to 29 SeptemSeptem-ber, mean air temper-ature was 13.2±7.6◦C with a high daily amplitude from 3.7±1.3 to 24.3±1.5◦C and wind speed was low with a mean of 0.14±0.31 m s−1(Fig. 2). Major storms with
max-imum wind speeds from 3 to 5.5 m s−1 on 23 and 28 July,
12 August, 6, 11 and 21 September were accompanied by air pressure decline to lows between 944 and 955 hPa. Often rainfall reached an intensity of 2.8 to 6.2 mm in the chosen 5 min time intervals (Fig. 2).
0.0 0.5 1.0 1.5 2.0 CH 4 flux (mmol m −
2 h
− 1) (a) 0 50 100 (b) (c) 0 10 20 30 CH 4 bubble frequency (e vents m − 2h − 1) Contribution o f e b u lli ti v e flux to total CH 4 flux (%) -1 0 1 2 3 4 5 CO 2 flux (mmol m −
2 h
−
1) (d)
04 Jul 18 Jul 01 Aug 15 Aug 29 Aug 12 Sep 26 Sep
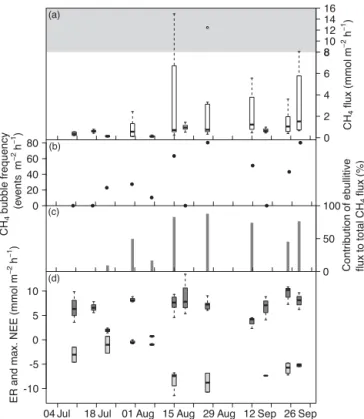
Figure 3. Time series of pond CH4 fluxes (a), CH4 bubble fre-quency(b), contribution of ebullitive CH4 flux to total CH4flux (c) and CO2 fluxes (d) on measuring days from 10 July until 29 September 2014. In panels(a)and(d), the bold horizontal line shows the median, the bottom and the top of the box the 25 and 75 percentile and the whiskers include all values within 1.5 times the interquartile range.
differed before and after this event, we used the storm as a distinction between “mid summer” and “late summer” con-ditions throughout the analysis.
3.2 CH4and CO2fluxes over time
CH4 fluxes from the pond were significantly lower in
the period from 10 July until 7 August with a me-dian of 0.03 mmol m−2h−1 compared to a median of 0.21 mmol m−2h−1 from 15 August until 29 September (Kruskal–Wallis test, p< 0.001, n=159) (Fig. 3a). The highest median CH4flux, highest maximum flux, and largest
variability were observed on 15 August, after the algal mat had been dissolved on 12 August. The bubble frequency varied between 0 and 30 events m−2h−1 (Fig. 3b) and the
contribution of the ebullitive to the total CH4 flux between
90 % in mid-July and 0 % in late September (Fig. 3c). Efflux of CH4 from the floating mat was variable but significantly
higher in late summer with a median of 0.80 mmol m−2h−1 than in mid summer with a median of 0.22 mmol m−2h−1 (Kruskal–Wallis test,p< 0.001,n=84) (Fig. 4a). The bub-ble frequency on the floating mat ranged from 0 to 80 events m−2h−1 and the contribution of ebullition to CH4
8 10 12 14 16 (a) 0 2 4 6 8 CH 4 flux (mmol m − 2h − 1) 0 50 100 (c) 0 20 40 60 80 CH 4 bubble frequency (e vents m − 2h − 1) Contribution o f ebullitive flux to total CH 4 flux (%) (b) -10 -5 0 5 10 ER and max. NEE (mmol m − 2h − 1)
04 Jul 18 Jul 01 Aug 15 Aug 29 Aug 12 Sep 26 Sep
(d)
Figure 4.Time series of floating mat CH4fluxes(a), CH4 bub-ble frequency(b), contribution of ebullitive CH4flux to total CH4 flux(c)as well as ecosystem respiration (ER) and maximum net ecosystem exchange (NEE)(d) on measuring days from 10 July until 29 September 2014. Note the different scaling of theyaxis within the gray area in panel(a). In panel(d), the dark gray boxes show the daytime ER and the light gray boxes the maximum net ecosystem exchange at values of photosynthetically active radia-tion > 1000 µmol m−2s−1. In panels(a)and(d), the bold horizontal line shows the median, the bottom and the top of the box the 25 and 75 percentile and the whiskers include all values within 1.5 times the interquartile range.
flux from 0 to 88 % (Fig. 4b and c). At the peatland site, CH4 fluxes were similar over time with a median of
0.31 mmol m−2h−1 and two very high individual fluxes in September and October (Fig. 5a). The bubble frequency and contribution of ebullition to CH4flux ranged from 0 to
5 events m−2h−1and 0 to 54 %, respectively (Fig. 5b and c). CO2 fluxes from the pond in mid summer had a
me-dian of 0.11 mmol m−2h−1and were also significantly lower
than the pond CO2 fluxes in late summer with a
me-dian of 1.80 mmol m−2h−1(Kruskal–Wallis test,p< 0.001,
n=159) (Fig. 3d). During 24 out of 55 individual measure-ments before 15 August, CO2 exchange across the water–
atmosphere interface was absent or CO2 was taken up by
the pond between 0 and−0.75 mmol m−2h−1. Subsequently CO2 was net emitted. The median daytime ER of the
2 12 22 (a) 0 1 2 CH 4 flux (mmol m − 2h − 1) 0 50 100 (c) 0 2 4 6 C H4 bubble frequency (e vents m − 2h − 1) Co n tr ib u ti o n o f ebullitive flux to total CH 4 flux (%) (b) -40 -20 0 20 40 ER and max. NEE (mmol m − 2h − 1)
04 Jul 18 Jul 01 Aug 15 Aug 29 Aug 12 Sep 26 Sep
(d)
Figure 5.Time series of peatland CH4fluxes(a), CH4bubble fre-quency(b), contribution of ebullitive CH4flux to total CH4flux(c) as well as ecosystem respiration (ER) and maximum net ecosystem exchange (NEE)(d)on measuring days from 4 July until 1 October 2014. Note the different scaling of theyaxis within the gray area in panel(a). In panel(d), the dark gray boxes show the daytime ER and the light gray boxes the maximum net ecosystem exchange at values of photosynthetically active radiation > 1000 µmol m−2s−1. In panels (a)and (d), the bold horizontal line shows the median, the bottom and the top of the box the 25 and 75 percentile and the whiskers include all values within 1.5 times the interquartile range.
with a median of 11.98 mmol m−2h−1 and tended to de-crease towards fall (Fig. 5d). The maximum NEE was quite constant from July until September with a median of −16.98 mmol m−2h−1.
The gradient method provided similar CO2fluxes in July
and September with a median of 1.99 mmol m−2h−1in July and 2.02 mmol m−2h−1 in September (Fig. S2). The daily amplitude of fluxes determined with this method was 1.46 to 3.19 mmol m−2h−1 in July and 1.41 to 1.86 mmol m−2h−1
in September (Fig. S2). Comparing results of floating cham-ber and gradient method, in July, when the algal mat on the pond was present, the daytime CO2 fluxes obtained by the
gradient method were 14-fold higher than the respective CO2
fluxes measured with the floating chambers (Kruskal–Wallis test,p< 0.001,n=189). In September the results of gradient and chamber method were not significantly different.
1 R² = 0.98 R² = 0.97
-50 -40 -30 -20 -10 0 10
0 500 1000 1500
D e
p th ( c m )
R² = 0.93 R² = 0.98
-50 -40 -30 -20 -10 0 10
0 500 1000 1500
D e
p th ( c m )
concentration (µmol L-1)
R² = 0.92 R² = 0.97
-50 -40 -30 -20 -10 0 10
0 500 1000 1500
D e
p th ( c m ) C
oncentration (µmol L-1) R² = 0.98
R² = 0.99
R² = 0.99 R² = 0.97
-50 -40 -30 -20 -10 0 10
0 500 1000 1500 2000 2500
D e
p th ( c m ) C
oncentration (µmol L-1)
(a) (b)
(c) (d)
Figure 6.CH4(shaded symbols) and CO2(open symbols) concen-trations near the sediment–water interface and in the sediment of the pond in four locations(a–d)on 25 and 29 September respec-tively, as obtained with porewater peepers. Water depth at the loca-tions was about 0.5 m; a depth of zero on theyaxis indicates the assumed sediment–water interface. Black lines represent regression slopes (with regression coefficientR2)used to calculate diffusive fluxes towards the sediment–water interface. Dashed lines denote depth and temperature dependent theoretical thresholds for forma-tion of CH4bubbles at 0.8 atm (lower line) and 0.5 atm (upper line) partial pressure of N2in the pond sediment at 15◦C. In panel(c) also the diffusive flow from deeper sediment layers was calculated.
3.3 CO2and CH4concentrations and diffusion in the
surface water and sediments
CO2 concentrations of the surface water of the pond were
similar during the examined periods in July and Septem-ber with a mean (±standard deviation) of 114.8±33.1 and 132.0±21.0 µmol L−1, respectively (Fig. S2). In both pe-riods we observed diurnal cycles of CO2 concentrations
covering a mean amplitude of 83.5±16.3 µmol L−1 (July) and 62.0±3.1 µmol L−1(September). In the sediments, the mean pH was 4.29±0.11 above the sediment–water inter-face and increased to 5.37±0.28 at a sediment depth of 40 to 60 cm. CH4 concentrations rose with depth from an
av-erage of 10.7±20.4 µmol L−1above the sediment–water
in-terface to 557.3±72.9 µmol L−1 at a depth of 40 to 60 cm
into the sediment (Fig. 6). The concentration began exceed-ing theoretical thresholds for bubble formation at depths between 10 to 40 cm and at a partial pressure of N2 of
0.8 atm, but nowhere were concentrations sufficient to form bubbles at 0.5 atm N2 (Fig. 6). The average CO2
water were on average 10.5±5.6 µmol m−2h−1 (CH 4)and
16.9±9.4 µmol m−2h−1(CO
2), or 12.0±5.6 µmol m−2h−1
(CH4)and 25.8±16.1 µmol m−2h−1, depending on where
the concentration gradient of pore water peeper C is assigned (Fig. 6). In situ production and diffusion from the sediment thus contributed only a small fraction to the CO2and CH4
flux from the pond. The relative inactivity of the pond sedi-ment was also indicated by the mostly flat and linear concen-tration increase of both gases with depth near the sediment– water interface.
3.4 Spatial pattern of CH4and CO2fluxes
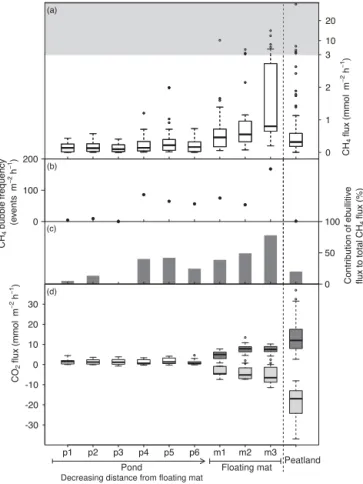
Efflux of CH4 increased 6-fold from open water towards
the floating mat and was also much higher on the floating mat than at the peatland site (Fig. 7a). The open water me-dian CH4 flux of plot p1, p2 and p3, farthest away from
the floating mat, was 0.12 mmol m−2h−1 and significantly
lower than from plot p4, p5 and p6 closer to the floating mat with a median of 0.19 mmol m−2h−1 (Kruskal–Wallis test, p< 0.05,n=82) (Table S3). The median CH4flux of the floating mat was 0.64 mmol m−2h−1 and significantly higher than the CH4flux from the pond (Kruskal–Wallis test,
p< 0.001,n=243). We observed an increasing frequency of ebullition and a higher contribution to CH4flux towards the
floating mat. On plot p1 only 4 events m−2h−1 contribut-ing 5 % occurred, whereas on plot m3 on the floatcontribut-ing mat 168 events m−2h−1 contributing 78 % were found (Fig. 7b and c). The CH4 flux of m3 was significantly higher than
that of m1 and m2 (Kruskal–Wallis multiple comparison test,
p< 0.05,n=84).
The frequency of ebullition and the amount of CH4
re-leased by bubble events differed along the transect and in comparison to the peatland site. On the pond, bubble events with a comparatively small CH4release of 0 to 2.5 µmol were
most frequent and occurred 5.4 times m−2h−1(Fig. 8). They also contributed the most to the total CH4 release. Bubble
events releasing a larger amount of CH4were rare. The
con-tribution of ebullition to CH4release was 27 %. On the
float-ing mat, CH4release by individual bubble events was highly
variable with a maximum of 50 µmol (Fig. 8). Larger bub-ble events were less frequent than smaller ones. However, medium and larger bubble events contributed most to CH4
release with up to 8 %. The contribution of ebullition to CH4
release was 66 % on the floating mat. In contrast, it was only 20 % in the peatland with a clearly different frequency distri-bution (Fig. 8). Bubble events occurred over a larger range of release strength than on the pond, but they were less frequent with a total bubble frequency of only 1.3 events m−2h−1.
The pond was on average also a net source of CO2
with a median CO2 efflux of 1.16 mmol m−2h−1 (Fig. 7d).
On the floating mat, daytime ER ranged from 0.53 to 13.45 mmol m−2h−1 and maximum NEE from −11.46 to 0.71 mmol m−2h−1(Fig. 7d).
(a)
10 20
0 1 2 3
CH
4
flux
(mmol
m
−
2h
−
1)
0 50 100 (c)
0 100 200
CH
4
bubble
frequency
(e
vents
m
−
2h
−
1)
Co
n
tr
ib
u
ti
o
n
o
f
ebullitive
flux
to
total
CH
4
flux
(%)
(b)
-30 -20 -10 0 10 20 30
CO
2
flux
(mmol
m
−
2h
−
1) (d)
p1 p2 p3 p4 p5 p6 m1 m2 m3
Peatland
Decreasing distance from floating mat
Pond Floating mat
Figure 7.CH4fluxes(a), CH4bubble frequency(b), contribution of ebullitive CH4flux to total CH4flux(c)and CO2fluxes(d)of the pond (p1 to p6) along a gradient of decreasing distance from the floating mat, of the three measuring plots on the floating mat (m1 to m3) and of the peatland site for comparison. Note the different scaling of theyaxis within the gray area in panel(a). In panel(d), the transparent boxes show the net CO2flux of the pond, the dark gray boxes the daytime ER and the light gray boxes the maximum net ecosystem exchange of the floating mat and the peatland at val-ues of photosynthetically active radiation > 1000 µmol m−2s−1. In panels(a)and(d), the bold horizontal line shows the median, the bottom and the top of the box the 25th and 75th percentile and the whiskers include all values within 1.5 times the interquartile range.
3.5 Controls on CH4and CO2fluxes
CH4 and CO2 fluxes from the pond and ER on the
float-ing mat were significantly negatively, and maximum NEE on the floating mat positively correlated with air, water and mat temperature (Tables 1 and 2). We found more negative NEE values at an increasing PAR on the floating mat as well as on the pond. Late summer fluxes of CO2and CH4across the
water–atmosphere interface were positively correlated with wind speed, whereas the respective mid summer fluxes were negatively correlated (Tables 1 and 2).
Total CH4fluxes from the floating mat and the pond were
Frequency
0 4 8
(e
vents
m
−
2h
−
1) (a)Pond
0 5 10
0 10 20 30 40 50
CH4 release(µmol) Contr
ibuti
on
to
to
ta
l
CH
4
release
(%)
Frequency
0 4 8
(e
vents
m
−
2h
−
1) (b)Mat
0 5 10
0 10 20 30 40 50
CH4 release (µmol) Contr
ibuti
on
to
to
ta
l
CH
4
release
(%)
Frequency
0 4 8
(e
vents
m
−
2h
−
1) (c)Peatland
0 5 10
0 10 20 30 40 50
CH4 release(µmol) Contr
ibuti
on
to
to
ta
l
CH
4
release
(%)
Figure 8. Frequency distribution of ebullitive CH4release (upper panels) as well as contribution of each size group of ebullitive CH4 release to the total CH4release (lower panels) of the pond(a), the floating mat(b)and the peatland(c).
pressure trend (Kruskal–Wallis test, p< 0.05 and p< 0.01,
n=111 andn=61). At the floating mat, median fluxes dur-ing these periods were 0.82 and 0.55 mmol m−2h−1, on the
pond 0.13 and and 0.04 mmol m−2h−1(see also Fig. S4).
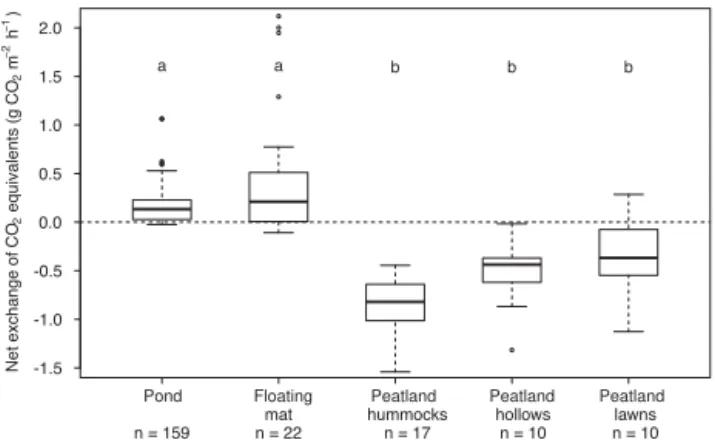
3.6 Greenhouse gas exchange of the pond system compared to the surrounding peatland
During our daytime measurements the pond and the float-ing mat were most frequently significant net sources of CO2
equivalents, whereas the peatland was generally a sink of CO2 equivalents (Fig. 9; Kruskal–Wallis multiple
compar-ison test, p< 0.001, n=218). The source strength of CO2
equivalents was largest on the floating mat with a median of 0.21 g CO2equivalents m−2h−1. While the floating mat and
peatland site took up CO2at PAR > 1000 µmol m−2s−1, the
pond emitted CO2 to the atmosphere during 90 % of
mea-surements (see Figs. 3, 4, 5). When both greenhouse gases were emitted, CH4contributed 59±20 % to the total
emis-sion of CO2equivalents of the pond.
-1.5 -1.0 -0.5 0.0 0.5 1.0 1.5 2.0
Pond Floating Peatland Peatland Peatland
mat hummocks hollows lawns
n = 159 n = 22 n = 17 n = 10 n = 10
a a b b b
N
e
t
exchange
o
f
C
O2
equivalents
(g
C
O2
m
−
2
h
)
−
1
Figure 9.Daytime net exchange of CO2equivalents of the pond, the floating mat and the three different microforms of the peatland. Dif-ferent letters indicate significant differences (Kruskal–Wallis mul-tiple comparison test,p< 0.001,n=218). For comparability of the CO2 fluxes of the floating mat and the peatland, only maximum net ecosystem exchange at values of photosynthetically active radi-ation > 1000 µmol m−2s−1was used for the calculation. The bold horizontal line shows the median, the bottom and the top of the box the 25th and 75th percentile and the whiskers include all values within 1.5 times the interquartile range.
4 Discussion
4.1 Spatial pattern of CH4and CO2fluxes along the
peatland – pond ecotone
The peatland and especially the floating mat were summer hot spots of CH4 emissions compared to a variety of sites
in other northern peatlands. Fluxes exceeded most, but not all, emissions reported by Hamilton et al. (1994), Strack et al. (2006), Dinsmore et al. (2009), Moore et al. (2011), and Trudeau et al. (2013) from similar environments by an or-der of magnitude (see also Supplement for a compilation of flux values, Tables S4–S6). On a per-day and mass ba-sis mean fluxes reached 204 and 437 mg CH4-C m−2d−1,
which is at the high end of fluxes reported in meta-analyses (Olefeldt et al., 2013). Average CH4 emissions from the
open water were still substantial at 63 mg CH4-C m−2d−1,
which is about 5 times the flux reported from the multi-year study of Stordalen Mire in northern Sweden (Wik et al., 2013). Emissions fell, however, well into the range of fluxes reported from other peatland ponds (Huttunen et al., 2002; Trudeau et al., 2013; Pelletier et al., 2014). In contrast, CO2fluxes were fairly inconspicuous compared to fluxes in
similar systems; on a per-day and mass basis mean maxi-mum NEE reached −5.4 g CO2-C m−2d−1 in the bog and −1.27 g CO2-C m−2d−1on the floating mat, and daytime ER 3.91 g CO2-C m−2d−1 and 1.85 g CO2-C m−2d−1,
respec-tively. The pond on average emitted 0.38 g CO2-C m−2d−1.
Both pond and floating mat thus lost more CO2 than they
environ-ments additional CO2 was released, for example stemming
from carbon-rich groundwater seeping into the pond. Part of the surprising source strength of methane can be attributed to the inclusion of ebullition by means of high frequency chamber measurements, similarly as first reported by Goodrich et al. (2011). Fluxes that are visibly affected by ebullition events have often been discarded from static chamber fluxes in the past because the non-linearity of con-centration increase over time is problematic when few sam-ples are analyzed by gas chromatography. Ebullition con-tributed on average 66 % to the emissions on the floating mat and reached 78 % at the plot with the highest methane flux (Figs. 4 and 7). The importance and variability of ebul-lition was similar as reported from an ombrotrophic peat-land in Japan (50 to 64 %; Tokida et al., 2007). The CH4
released by individual bubble events from the floating mat was also on the same order of magnitude as bubble CH4
re-lease in Sallie’s Fen (Goodrich et al., 2011). At that site the bubble frequency of 35±16 events m−2h−1 was, however, lower than on the floating mat at Wylde Lake Bog with 54 to 168 events m−2h−1. In contrast to these findings, ebullition accounted on average only for 20 % of fluxes at our bog site and 27 % in the pond (Figs. 3 and 5), where bubble frequency of outer plots was less than 9 events m−2h−1and dropped to zero by the end of September (Fig. 3). In the pond ebulli-tion was thus less important than reported previously in 11 lakes in Wisconsin (40 to 60 %; Bastviken et al., 2004) and two productive, urban ponds in Sweden and China (> 90 %; Natchimuthu et al., 2014; Xiao et al., 2014).
Even though bubbles were rarely observed on p1, p2 and p3 farther away from the floating mat (Fig. 7) and ceased altogether in September (Fig. 3), formation of CH4bubbles
may have initially been possible in the pond sediments. Con-centrations exceeded the threshold concentration of bubble formation at a N2partial pressure of 0.8 atm in all locations
sampled (Fig. 6). Such concentrations were only reached at larger sediment depth, though, and ongoing stripping of N2with ebullition may have raised concentration thresholds
over time (Fechner-Levy and Hemond, 1996). At a remain-ing N2partial pressure of 0.5 atm, ebullition was not possible
from a theoretical point of view, which may explain its lim-ited importance in the pond. The lack of ebullition later on may have been assisted by falling temperatures in autumn; a change from 20 to 10◦C, for example, raises the thresh-old for ebullition by 70 µmol L−1. Flat or linearly
increas-ing concentration profiles near the sediment–water interface (Fig. 6) also indicated a lack of active production of the gas in this zone. Concentrations of CH4and CO2remained low,
typically less than 650 and 1500 µmol L−1, respectively, sug-gesting that microbial activity in the sediments was limited. Also the diffusive fluxes were small in units of mass, about 3.5 mg CH4-C m−2d−1and 7.5 mg CO2-C m−2d−1,
respec-tively. The continuous emission of CH4 and CO2from the
pond, on average 63 mg CH4-C m−2d−1 and 380 mg CO2
-C m−2d−1, was hence likely driven by respiration in the
wa-ter column and by advective inflow of groundwawa-ter rich in CH4and CO2.
Our results further suggest that medium and infrequent large bubble events contributed a substantial fraction to the total CH4flux at the floating mat but not in the bog and the
pond (Fig. 8). This was the case even though small bubble events were much more frequent than large ones (Fig. 8). DelSontro et al. (2015) also reported a strong positive cor-relation between ebullition flux and bubble volume in open water and found that the largest 10 % of the bubbles ob-served in Lake Wohlen, Switzerland, accounted for 65 % of the CH4 transport. According to the authors, large bubbles
are disproportionately important because they contain expo-nentially more CH4with increasing diameter, rise faster, and
have less time and a relatively smaller surface area to dis-solve or exchange CH4with the surroundings (DelSontro et
al., 2015).
The decline of CH4fluxes, CH4bubble frequency and
con-tribution of ebullition from the floating mat to the open water was striking and fluxes were also considerably higher than at the peatland site (Fig. 7). These findings emphasize that the floating mats and transition zones to the open water need to be included when quantifying greenhouse gas budgets of pond and peatland ecosystems. We cannot mechanistically identify the causes for the observed pattern. It seems likely that the peak emissions from the floating mat were caused by an optimum of wet conditions in the peat, favoring methano-genesis and impeding methane oxidation, presence of some Carex aquatilisproviding for conduit transport of the gas, and potentially by a release of methane from groundwater entering the land–water interface. CH4 flux through plants
with aerenchymatic tissues can be responsible for 50 to 97 % of the total CH4flux in peatlands because the aerenchyma
link the anaerobic zone of CH4 production with the
atmo-sphere (Kelker and Chanton, 1997; Kutzbach et al., 2004; Shannon et al., 1996). Kutzbach et al. (2004) found a strong positive correlation between the density ofC. aquatilisculms and CH4 fluxes, as well as a contribution of 66±20 % of
the plant-mediated CH4flux throughC. aquatilisto the
to-tal flux in wet polygonal tundra. Since ebullition dominated the CH4 flux from the floating mat (Fig. 4) in our
particu-lar case this transport mechanism seemed to be of more lim-ited importance, though. Also recently fixed substrates may have played a role for high CH4 emissions from the
float-ing mat. Several studies have found a positive correlation be-tween the rate of photosynthesis and CH4emissions
(Joab-sson and Christensen, 2001; Ström et al., 2003), which has been explained by the quick allocation of assimilated labile carbon to the roots and subsequent exudation to the anaerobic rhizosphere (Dorodnikov et al., 2011). These recent photo-synthates serve as a preferential source of CH4compared to
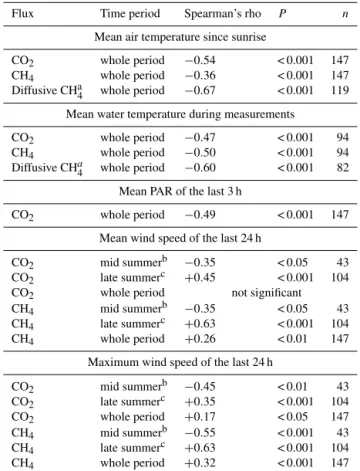
Table 1.Correlations of CH4and CO2fluxes of the pond with en-vironmental variables. CH4flux comprises both ebullition and dif-fusion if not annotated otherwise.
Flux Time period Spearman’s rho P n
Mean air temperature since sunrise
CO2 whole period −0.54 < 0.001 147
CH4 whole period −0.36 < 0.001 147
Diffusive CHa4 whole period −0.67 < 0.001 119 Mean water temperature during measurements
CO2 whole period −0.47 < 0.001 94
CH4 whole period −0.50 < 0.001 94
Diffusive CHa4 whole period −0.60 < 0.001 82 Mean PAR of the last 3 h
CO2 whole period −0.49 < 0.001 147
Mean wind speed of the last 24 h
CO2 mid summerb −0.35 < 0.05 43
CO2 late summerc +0.45 < 0.001 104
CO2 whole period not significant
CH4 mid summerb −0.35 < 0.05 43
CH4 late summerc +0.63 < 0.001 104
CH4 whole period +0.26 < 0.01 147
Maximum wind speed of the last 24 h
CO2 mid summerb −0.45 < 0.01 43
CO2 late summerc +0.35 < 0.001 104
CO2 whole period +0.17 < 0.05 147
CH4 mid summerb −0.55 < 0.001 43
CH4 late summerc +0.63 < 0.001 104
CH4 whole period +0.32 < 0.001 147
aonly measurements without ebullition included,b10 July to 7 August,c15 August to
29 September.
decline of CH4 fluxes along the transect CH4-rich
ground-water may also have entered the floating mat and the pond, a process that we did not investigate.
4.2 Controls on CH4and CO2fluxes
In agreement with earlier work air pressure change influ-enced methane flux. We observed 1.5- to 3-fold higher CH4
fluxes from the floating mat and the pond during periods of decreasing compared to increasing air pressure (Fig. S4), which was very likely caused by increased ebullition (Wik et al., 2013). Decreased atmospheric pressure results in bubble expansion, which enhances buoyancy force and entails bub-ble rise (Chen and Slater, 2015).
The negative correlation of water and mat temperature with CH4and CO2fluxes from the pond and CH4flux and
ER of the floating mat (Tables 1 and 2) was unexpected, as it is consensus that temperature is an important positive control on these fluxes (Pelletier et al., 2014; Roulet et al., 1997; Sachs et al., 2010; Wik et al., 2014). Also the poten-tial effect of wind speed on CH4 and CO2fluxes from the
pond was ambiguous. Increasing wind speeds should stimu-late the exchange of dissolved gases by increasing turbulence
Table 2.Correlations of CH4and CO2 fluxes of the floating mat with environmental variables. CH4flux comprises both ebullition and diffusion if not annotated otherwise.
Flux Time period Spearman’s rho P n
Mean air temperature since sunrise
Max. NEE whole period +0.74 < 0.001 20 CH4 whole period −0.42 < 0.001 79
Mean mat temperature during measurements
ER whole period −0.44 < 0.01 38 CH4 whole period −0.41 < 0.001 79
Diffusive CHa4 whole period −0.52 < 0.001 53
Mean PAR during measurements
NEE mid summerb not significant NEE late summerc −0.60 < 0.01 26 NEE whole period −0.37 < 0.05 42
aonly measurements without ebullition included,b10 July to 7 August,c15 August to 29
September.
of both air and water close to the interface (Crusius and Wan-ninkhof, 2003). Before 15 August wind speed and CH4and
CO2 efflux from the pond were, however, negatively
corre-lated, whereas the correlation was positive thereafter despite quite consistent wind speed patterns and surface water CO2
concentrations throughout the whole study period (Figs. 2 and S2).
Both phenomena may be explained by internal biological processes, i.e., the growth and decay of a dense algal mat on the pond, changing hydrological connection between the pond system and the surrounding peatland, and the influ-ence of the vascular vegetation on the floating mat. The algal mat developed in the beginning of July and was largely ir-reversibly dissolved by a storm on 12 August (Figs. S5 and S6). During its presence CO2 emissions from the pond
re-mained low (Fig. 3) and were overestimated by the boundary layer equation approach. Amplitudes of dissolved CO2
con-centration were strong and concon-centration decreased with in-creasing PAR (Table 1). Such dynamics reflects a strong au-tochthonous photosynthetic and respiratory activity and lack of water mixing. The empirical relationship between CO2
concentration gradient, wind speed and flux, which is largely controlled by turbulence in the water column, obviously did not apply under such conditions. The subsequent shift to high CO2and CH4emissions was probably partly caused by the
decomposition of the remains of the algal mat, similarly as reported from a boreal and a subtropical pond (Hamilton et al., 1994; Xiao et al., 2014). Other than that, the algal mat probably represented a physical barrier to diffusive and ebul-litive gas exchange between water column and atmosphere. We observed trapped gas bubbles within the algal mat with CH4 concentration of only 4 to 8 %; part of the originally
contained CH4 may have been re-dissolved and oxidized.
concentra-tions can be several-fold higher in the deep water compared to the surface water during certain periods (Dinsmore et al., 2009; Ford et al., 2002). We can only assume that such con-centration gradients established in or under the algal mat. Its destruction, mixing of the water column and resuspension of the upper sediment layer probably entailed the observed peak diffusive CO2and CH4emissions after the storm on 12
Au-gust (Figs. 2, 3).
4.3 Relevance of greenhouse gas emissions from the pond system
In terms of radiative forcing, the floating mat and open water behaved differently than the peatland site during our daytime flux measurements at PAR > 1000 µmol m−2s−1. All three bog micro-sites represented daytime sinks of CO2
equiva-lents and most so the hummocks (Fig. 9), which represented about 90 % of the area. The floating mat and to a lesser ex-tent also the pond were sources of CO2 equivalents to the
atmosphere, even at daytime, and had a comparable source strength as the boreal ponds and beaver pond investigated by Hamilton et al. (1994) and Roulet et al. (1997). Net photo-synthetic CO2uptake at light saturation was thus unable to
counterbalance the high CH4 emissions of the floating mat
in terms of CO2 equivalents; at both the floating mat and
the pond emission of CH4was more important than CO2
ex-change in terms of greenhouse gas equivalents. In the pond the average contribution of CH4 was 59 %, which is much
higher than reported from a beaver pond at the Mer Bleue bog (5 %; Dinsmore et al., 2009), but comparable to figures from ponds in other studies (36 to 91 %; Hamilton et al., 1994; Huttunen et al., 2002; Pelletier et al., 2014; Repo et al., 2007; Roulet et al., 1997). We ascribe the large differ-ences between the floating mat and the peatland site (Figs. 7 and 10) to the influx of allochthonous organic and inorganic carbon to the pond system from the surroundings and to the different vegetation composition, in particular the occurrence of Carex aquatilison the floating mat, which may have en-hanced CH4production and transport (Kutzbach et al., 2004;
Strack et al., 2006). Our results support earlier suggestions that ponds are important for the greenhouse gas budget of peatlands at landscape scale (e.g., Pelletier et al., 2014) and they suggest that changes in the area extent of floating mats and shore length will be an important factor of changes in greenhouse gas budgets with predicted climate change.
5 Conclusions
Our summer measurements of atmospheric CH4and CO2
ex-change revealed a substantial small-scale spatial variability with 6- and 42-fold increasing median CH4fluxes and bubble
frequencies, respectively, from the open water of the pond to-wards the surrounding floating mat. Individual bubble events releasing more than 10 µmol CH4contributed substantially to
summer CH4 emissions from the floating mat, despite their
rare occurrence. When CH4emissions of peatlands that
con-tain ponds are quantified, ebullitive and diffusive CH4fluxes
at the land–water interface hence need to be accounted for and the areal cover of the different microforms and/or plant communities should be thoroughly mapped, as suggested by Sachs et al. (2010) for tundra landscape. We also observed 4- to 16-fold increases in CH4 and CO2 emissions in late
summer that were unrelated to meteorological drivers, such as temperature, wind speed and radiation. Hydrological con-nections to adjacent peatlands and internal hydrological and biological processes, such as the development of algal mats, which can be abundant in small and shallow water bodies (e.g., Dinsmore et al., 2009; Hamilton et al., 1994; Xiao et al., 2014) thus require more attention in the future. During our summer daytime flux measurements, the pond system had a warming effect considering CH4and CO2exchange,
with the highest net release of CO2 equivalents from the
floating mat. We conclude that carbon cycling and hydrology of small ponds and their surrounding ecotone need to be fur-ther investigated; these systems are hot spots of greenhouse gas exchange and are likely highly sensitive to anthropogenic climate change due to their shallowness and dependence on water budgets and hydrological processes upstream.
6 Data availability
The data published in this contribution can be accessed by email request to the corresponding author.
The Supplement related to this article is available online at doi:10.5194/bg-13-3777-2016-supplement.
Acknowledgements. The study was financially supported by the
German Research Foundation (DFG) grant BL 563/21-1 and an international cooperation grant by the German Academic Exchange Service (DAAD) to C. Blodau. We thank C. Wagner-Riddle for the possibility to use the former Blodau laboratory at the School of Environmental Sciences at the University of Guelph and P. Smith and L. Wing for organizational and technical support. We are grateful to M. Neumann from the Grand River Conservation Authority for permission to conduct research in the Luther Marsh Wildlife Management Area, Ontario, Canada, Z. Green for kindly providing satellite images of the study area and C. A. Lacroix (OAC Herbarium, Biodiversity Institute of Ontario) for her friendly help in identifying some plants. We are thankful to M. Goebel for support in the field and advices on study design and data analysis and to E. Fleischer for her helpful comments.
References
Bastviken, D., Cole, J. J., Pace, M. L., and Tranvik, L. J.: Methane emissions from lakes: Dependence of lake characteristics, two regional assessments, and a global estimate, Global Biogeochem. Cy., 18, GB4009, doi:10.1029/2004GB002238, 2004.
Bastviken, D., Tranvik, L. J., Downing, J. A., Crill, P. M., and Enrich-Prast, A.: Freshwater Methane Emissions Off-set the Continental Carbon Sink, Science, 331, p. 50, doi:10.1126/science.1196808, 2011.
Bridgham, S. D., Cadillo-Quiroz, H., Keller, J. K., and Zhuang, Q.: Methane emissions from wetlands: biogeochemical, micro-bial, and modeling perspectives from local to global scales, Glob. Change Biol., 19, 1325–1346, 2013.
Carmichael, M. J., Bernhardt, E. S., Bräuer, S. L., and Smith, W. K.: The role of vegetation in methane flux to the atmosphere: should vegetation be included as a distinct category in the global methane budget?, Biogeochemistry, 119, 1–24, 2014.
Chen, X. and Slater, L.: Gas bubble transport and emissions for shal-low peat from a northern peatland: The role of pressure changes and peat structure, Water Resour. Res., 51, 151–168, 2015. Ciais, P., Sabine, C., Bala, G., Bopp, L., Brovkin, V., Canadell, J.,
Chhabra, A., DeFries, R., Galloway, J., Heimann, M., Jones, C., Le Quéré, C., Myneni, R. B., Piao, S., and Thornton, P.: Carbon and Other Biogeochemical Cycles, in: Climate Change 2013: The Physical Science Basis, Contribution of Working Group I to the Fifth Assessment Report of the Intergovernmental Panel on Climate Change, edited by: Stocker, T. F., Qin, D., Plattner, G.-K., Tignor, M., Allen, S. G.-K., Boschung, J., Nauels, A., Xia, Y., Bex, V., and Midgley, P. M., Cambridge, New York, 465–570, 2013.
Chanton, J. P., Bauer, J. E., Glaser, P. A., Siegel, D. I., Kelley, C. A., Tyler, S. C., Romanowicz, E. H., and Lazrus, A.: Radiocarbon evidence for the substrates supporting methane formation within northern Minnesota peatlands, Geochim. Cosmochim. Ac., 59, 3663–3668, 1995.
Cole, J. J., Prairie, Y. T., Caraco, N. F., McDowell, W. H., Tranvik, L. J., Striegl, R. G., Duarte, C. M., Kortelainen, P., Downing, J. A., Middelburg, J. J., and Melack, J.: Plumbing the global carbon cycle: Integrating inland waters into the terrestrial carbon budget, Ecosystems, 10, 171–184, 2007.
Crusius, J. and Wanninkhof, R.: Gas transfer velocities measured at low wind speed over a lake, Limnol. Oceanogr., 48, 1010–1017, 2003.
Davidson, E. A., Savage, K., Verchot, L. V., and Navarro, R.: Min-imizing artifacts and biases in chamber-based measurements of soil respiration. Agr. Forest Meteorol., 113, 21–37, 2002. DelSontro, T., McGinnis, D. F., Wehrli, B., and Ostrovsky, I.: Size
Does Matter: Importance of Large Bubbles and Small-Scale Hot Spots for Methane Transport, Environ. Sci. Technol., 49, 1268– 1276, 2015.
Dinsmore, K. J., Billett, M. F., and Moore, T. R.: Transfer of carbon dioxide and methane through the soil-water-atmosphere system at Mer Bleue peatland, Canada, Hydrol. Process., 23, 330–341, 2009.
Dinsmore, K. J., Billett, M. F., Skiba, U. M., Rees, R. M., Drewer, J., and Helfter, C.: Role of the aquatic pathway in the carbon and greenhouse gas budgets of a peatland catchment, Glob. Change Biol., 16, 2750–2762, 2010.
Dorodnikov, M., Knorr, K.-H., Kuzyakov, Y., and Wilmking, M.: Plant-mediated CH4 transport and contribution of photosyn-thates to methanogenesis at a boreal mire: a14C pulse-labeling study, Biogeosciences, 8, 2365–2375, doi:10.5194/bg-8-2365-2011, 2011.
Downing, J. A.: Emerging global role of small lakes and ponds: little things mean a lot, Limnetica, 29, 9–24, 2010.
Downing, J. A., Cole, J. J., Middelburg, J. J., Striegl, R. G., Duarte, C. M., Kortelainen, P., Prairie, Y. T., and Laube, K. A.: Sediment organic carbon burial in agriculturally eutrophic impoundments over the last century, Global Biogeochem. Cy., 22, GB1018, doi:10.1029/2006GB002854, 2008.
Drösler, M.: Trace gas exchange and climatic relevance of bog ecosystems, Southern Germany, Doctoral thesis, Technical Uni-versity of Munich, Munich, 2005.
Estop-Aragonés, C., Knorr, K. H., and Blodau, C.: Controls on in situ oxygen and DIC dynamics in peats of a temperate fen, J. Geophys. Res., 117, G02002, doi:10.1029/2011JG001888, 2012. Fechner-Levy, E. J. and Hemond, H. F.: Trapped methane volume and potential effects on methane ebullition in a northern peatland, Limnol. Oceanogr., 41, 1375–1383, 1996.
Flessa, H., Rodionov, A., Guggenberger, G., Fuchs, H., Magdon, P., Shibistova, O., Zrazhevskaya, G., Mikheyeva, N., Kasansky, O., and Blodau, C.: Landscape controls of CH4fluxes in a catchment of the forest tundra ecotone in northern Siberia, Glob. Change Biol., 14, 2040–2056, 2008.
Ford, P. W., Boon, P. I., and Lee, K.: Methane and oxygen dynamics in a shallow floodplain lake: the significance of periodic stratifi-cation, Hydrobiologia, 485, 97–110, 2002.
Givelet, N., Roos-Barraclough, F., and Shotyk, W.: Predominant an-thropogenic sources and rates of atmospheric mercury accumula-tion in southern Ontario recorded by peat cores from three bogs: comparison with natural “background” values (past 8000 years), J. Environ. Monitor., 5, 935–949, 2003.
Goodrich, J. P., Varner, R. K., Frolking, S., Duncan, B. N., and Crill, P. M.: High-frequency measurements of methane ebullition over a growing season at a temperate peatland site, Geophys. Res. Lett., 38, L07404, doi:10.1029/2011GL046915, 2011.
Grand River Conservation Authority: Orthoimagery, https://maps. grandriver.ca/maps-home.html (last access: 10 August 2015), Cambrige, Ontario, 2015.
Hamilton, J. D., Kelly, C. A., Rudd, J. W. M., Hesslein, R. H., and Roulet, N. T.: Flux to the atmosphere of CH4and CO2from wet-land ponds on the Hudson Bay lowwet-lands (HBLs), J. Geophys. Res., 99, 1495–1510, 1994.
Hesslein, R. H.: An in situ sampler for close interval pore water studies, Limnol. Oceanogr., 21, 912–914, 1976.
Huttunen, J. T., Väisänen, T. S., Heikkinen, M., Hellsten, S., Nykä-nen, H., NenoNykä-nen, O., and MartikaiNykä-nen, P. J.: Exchange of CO2, CH4and N2O between the atmosphere and two northern boreal ponds with catchments dominated by peatlands or forests, Plant Soil, 242, 137–146, 2002.
Joabsson, A. and Christensen, T. R.: Methane emissions from wet-lands and their relationship with vascular plants: an Arctic exam-ple, Glob. Change Biol., 7, 919–932, 2001.
Juutinen, S., Rantakari, M., Kortelainen, P., Huttunen, J. T., Lar-mola, T., Alm, J., Silvola, J., and Martikainen, P. J.: Methane dynamics in different boreal lake types, Biogeosciences, 6, 209– 223, doi:10.5194/bg-6-209-2009, 2009.
Juutinen, S., Väliranta, M., Kuutti, V., Laine, A. M., Virtanen, T., Seppä, H., Weckström, J., and Tuittila, E. S.: Short-term and long-term carbon dynamics in a northern peatland-stream-lake continuum: A catchment approach, J. Geophys. Res.-Biogeo., 118, 171–183, 2013.
Kelker, D. and Chanton, J.: The effect of clipping on methane emis-sions fromCarex, Biogeochemistry, 39, 37–44, 1997.
Kelly, C. A., Fee, E., Ramlal, P. S., Rudd, J. W. M., Hesslein, R. H., Anema, C., and Schindler, E. U.: Natural variability of car-bon dioxide and net epilimnetic production in the surface waters of boreal lakes of different sizes, Limnol. Oceanogr. 46, 1054– 1064, 2001.
Kortelainen, P. L., Rantakari, M., Huttunen, J. T., Mattsson, T., Alm, J., Juutinen, S., Larmola, T., Silvola, J., and Martikainen, P. J.: Sediment respiration and lake trophic state are important predic-tors of large CO2evasion from small boreal lakes, Glob. Change Biol., 12, 1554–1567, 2006.
Kutzbach, L., Wagner, D., and Pfeiffer, E. M.: Effect of microrelief and vegetation on methane emission from wet polygonal tundra, Lena Delta, Northern Siberia, Biogeochemistry, 69, 341–362, 2004.
Larmola, T., Alm, J., Juutinen, S., Huttunen, J. T., Martikainen, P. J., and Silvola, J.: Contribution of vegetated littoral zone to winter fluxes of carbon dioxide and methane from boreal lakes, J. Geo-phys. Res.-Atmos., 109, D19102, doi:10.1029/2004JD004875, 2004.
Larmola, T., Bubier, J. L., Kobyljanec, C., Basiliko, N., Juutinen, S., Humphreys, E. R., Preston, M., and Moore, T. R.: Vegetation feedbacks of nutrient addition lead to a weaker carbon sink in an ombrotrophic bog, Glob. Change Biol., 19, 3729–3739, 2013. Lerman, A.: Chemical exchange across sediment-water interface,
Annu. Rev. Earth Pl. Sc., 6, 281–303, 1978.
Macrae, M. L., Bello, R. L., and Molot, L. A.: Long-term car-bon storage and hydrological control of CO2exchange in tundra ponds in the Hudson Bay Lowland, Hydrol. Process., 18, 2051– 2069, 2004.
McEnroe, N. A., Roulet, N. T., Moore, T. R., and Garneau, M.: Do pool surface area and depth control CO2and CH4fluxes from an ombrotrophic raised bog, James Bay, Canada?, J. Geophys. Res., 114, G01001, doi:10.1029/2007JG000639, 2009.
McLaughlin, J. and Webster, K.: Effects of Climate Change on Peat-lands in the Far North of Ontario, Canada?: A Synthesis, Arct. Antarct. Alp. Res., 46, 84–102, 2014.
Moore, T. R., De Young, A., Bubier, J. L., Humphreys, E. R., Lafleur, P. M., and Roulet, N. T.: A Multi-Year Record of Methane Flux at the Mer Bleue Bog, Southern Canada, Ecosys-tems, 14, 646–657, 2011.
Michmerhuizen, C. M., Striegl, R. G., and McDonald, M. E.: Po-tential methane emission from north-temperate lakes following ice melt, Limnol. Oceanogr., 41, 985–991, 1996.
Myhre, G., Shindell, D., Bréon, F.-M., Collins, W., Fuglestvedt, J., Huang, J., Koch, D., Lamarque, J.-F., Lee, D., Mendoza, B., Nakajima, T., Robock, A., Stephens, G., Takemura, T., and Zhang, H.: Anthropogenic and Natural Radiative Forcing, in: Stocker, T. F., Qin, D., Plattner, G.-K., Tignor, M., Allen, S. K.,
Boschung, J., Nauels, A., Xia, Y., Bex, V., and Midgley, P. M., Climate Change 2013: The Physical Science Basis. Contribution of Working Group I to the Fifth Assessment Report of the Inter-governmental Panel on Climate Change, Cambridge, New York, 659–740, 2013.
Natchimuthu, S., Panneer Selvam, B., and Bastviken, D.: Influence of weather variables on methane and carbon dioxide flux from a shallow pond, Biogeochemistry, 119, 403–413, 2014.
National Climate Data and Information Archive: Canadian Climate Normals, http://climate.weather.gc.ca/climate_normals/index_e. html, last access: 18 November 2014.
Olefeldt, D., Turetsky, M. R., Crill, P. M., and McGuire, A. D.: Environmental and physical controls on northern terrestrial methane emissions across permafrost zones, Glob. Change Biol., 19, 589–603, 2013.
Pelletier, L., Strachan, I. B., Garneau, M., and Roulet, N. T.: Carbon release from boreal peatland open water pools: Implication for the contemporary C exchange, J. Geophys. Res.-Biogeo., 119, 207–222, 2014.
Raymond, P. A., Hartmann, J., Lauerwald, R., Sobek, S., McDon-ald, C., Hoover, M., Butman, D., Striegl, R. G., Mayorga, E., Humborg, C., Kortelainen, P. L., Dürr, H., Meybeck, M., Ciais, P., and Guth, P.: Global carbon dioxide emissions from inland waters, Nature, 503, 355–359, 2013.
R Core Team: R: A language and environment for statistical com-puting, R Foundation for Statistical Comcom-puting, Vienna, 2014. Repo, M. E., Huttunen, J. T., Naumov, A. V., Chichulin, A. V.,
Lap-shina, E. D., Bleuten, W., and Martikainen, P. J.: Release of CO2 and CH4 from small wetland lakes in western Siberia, Tellus, 59B, 788–796, 2007.
Roulet, N. T., Crill, P. M., Comer, N. T., Dove, A., and Boubonniere, R. A.: Flux between a boreal beaver pond and the atmosphere, J. Geophys. Res., 102, 29313–29319, 1997.
Sachs, T., Giebels, M., Boike, J., and Kutzbach, L.: Environmen-tal controls on CH4emission from polygonal tundra on the mi-crosite scale in the Lena river delta, Siberia, Glob. Change Biol., 16, 3096–3110, 2010.
Sander, R.: Compilation of Henry’s Law Constants for Inorganic and Organic Species of Potential Importance in Environmental Chemistry, Max-Planck Institute of Chemistry, Mainz, 1999. Sandilands, A. P.: Annotated Checklist of the Vascular Plants and
Vertebrates of Luther Marsh, Ontario, Ontario Field Biologist, Special Publication No. 2. 1984.
Shannon, R. D., White, J. R., Lawson, J. E., and Gilmour, B. S.: Methane efflux from emergent vegetation in peatlands, J. Ecol., 84, 239–246, 1996.
Soumis, N., Canuel, R., and Lucotte, M.: Evaluation of two cur-rent approaches for the measurement of carbon dioxide diffusive fluxes from lentic ecosystems, Environ. Sci. Technol., 42, 2964– 2969, 2008.
Strack, M., Waller, M. F., and Waddington, J. M.: Sedge succession and peatland methane dynamics: A potential feedback to climate change, Ecosystems, 9, 278–287, 2006.
Sugimoto, A. and Fujita, N.: Characteristics of methane emissions from different vegetations on a wetland, Tellus, 49B, 382–392, 1997.
Tokida, T., Miyazaki, T., Mizoguchi, M., Nagata, O., Takakai, F., Kagemoto, A., and Hatano, R.: Falling atmospheric pressure as a trigger for methane ebullition from peatland, Global Bio-geochem. Cy., 21, GB2003, doi:10.1029/2006GB002790, 2007. Tranvik, L. J., Downing, J. A., Cotner, J. B., Loiselle, S. A., Striegl, R. G., Ballatore, T. J., Dillon, P., Finlay, K., Fortino, K., Knoll, L. B., Kortelainen, P. L., Kutser, T., Larsen, S., Laurion, I., Leech, D. M., McCallister, S. L., Mcknight, D. M., Melack, J. M., Over-holt, E., Porter, J. A., Prairie, Y. T., Renwick, W. H., Roland, F., Sherman, B. S., Schindler, D. W., Sobek, S., Tremblay, A., Vanni, M. J., Verschoor, A. M., Von Wachenfeldt, E., and Weyhenmeyer, G. A.: Lakes and reservoirs as regulators of carbon cycling and climate, Limnol. Oceanogr., 54, 2298–2314, 2009.
Trudeau, N. C., Garneau, M., and Pelletier, L.: Methane fluxes from a patterned fen of the northeastern part of the La Grande river watershed, James Bay, Canada, Biogeochemistry, 113, 409–422, 2013.
Turunen, J., Tomppo, E., Tolonen, K., and Reinikainen, A.: Esti-mating carbon accumulation rates of undrained mires in Finland – application to boreal and subarctic regions, The Holocene, 12, 69–80, 2002.
Varadharajan, C. and Hemond, H. F.: Time-series analy-sis of high-resolution ebullition fluxes from a stratified, freshwater lake, J. Geophys. Res.-Biogeo., 117, G02004, doi:10.1029/2011JG001866, 2012.
Verpoorter, C., Kutser, T., Seekell, D. A., and Tranvik, L. J.: A global inventory of lakes based on high-resolution satellite im-agery, Geophys. Res. Lett., 41, 6396–6402, 2014.
Walter, K. M., Zimov, S. A., Chanton, J. P., Verbyla, D., and Chapin, F. S.: Methane bubbling from Siberian thaw lakes as a positive feedback to climate warming, Nature, 443, 71–75, 2006. Wik, M., Crill, P. M., Varner, R. K., and Bastviken, D.: Multiyear
measurements of ebullitive methane flux from three subarctic lakes, J. Geophys. Res.-Biogeo., 118, 1307–1321, 2013. Wik, M., Thornton, B. F., Bastviken, D., MacIntyre, S., Varner,
R. K., and Crill, P. M.: Energy input is primary controller of methane bubbling in subarctic lakes, Geophys. Res. Lett., 41, 555–560, 2014.
Xenopoulos, M. A., Lodge, D. M., Frentress, J., Kreps, T. A., Bridgham, S. D., Grossman, E., and Jackson, C. J.: Regional comparisons of watershed determinants of dissolved organic car-bon in temperate lakes from the Upper Great Lakes region and selected regions globally, Limnol. Oceanogr., 48, 2321–2334, 2003.