of Food Industry in India:
A Size-Wise Analysis
ramachandran azhagaiahandraju deepa Kanchi Mamunivar Centre for Postgraduate Studies, India
Profitability is the profit earning capacity, which is a crucial fac-tor in contributing to the survival of firms. This paper is a maiden attempt at estimating the impact of size on profitability, consider-ing the ‘size’ as the control variable. For this purpose, the selected firms are classified into three size categories as ‘small,’ ‘medium,’ and ‘large’ based on the sales turnover. The results show that volatil-ity and growth are the major predictors in determining profitabil-ity in case of small size firms while growth is important in deter-mining the profitability of medium size firms. Capital intensity has a significant positive coefficient with the profitability of large size firms. The overall result shows that the larger the size of the firm, the more the investment in long lived assets has helped to increase the profitability of the firm unlike the trend in cases of small size and medium size firms.
Key words:profitability, growth, volatility, capital intensity, return on investment
Introduction
Literature Review
Pis a crucial factor to judge the perpetual of a firm. A brief review of the past research works of experts in the field will help us to un-derstand the importance of the present study.Pis considered to be an important factor in determining the capital structure (CS) of the firm. Different views prevail with regard to the relation betweenP
and CS. Static trade off theory works only to a certain extent. But
pecking order theory recognizes both asymmetric information and costs of financial distress. The works on asymmetric information also give production roughly in line with pecking order theory. The managers, hence, follow the general rule ‘issue safe securities before risky ones’ (Myers 1984). The corporate managers are more likely to follow a financing hierarchy than to maintain a target debt–equity ratio (Pinegar and Wilbricht 1989), which supports the pecking or-der theory. The regression result shows a negative relation between
CSandPundermarket valueandbook valuebases for bothusas well as Japanese manufacturing firms, although there are no significant country differences inCSbetweenusand Japanese manufacturing firms after controlling the characteristics such as growth,P, risk, size (SIZ) and industry classification (Kester 1986).
Another dimension of perception is that the managers tend to avoid secured debt financing as it may increase the level of mon-itoring and may reduce their level of perquisites, which evidenced that the growth rates (GROW) are negatively related to long-term debt (LTD). The pecking order theory, which assumes that firms give more preference to retained earnings when deciding about fi-nancing a project, is also acceptable (Titman and Wessels 1988). A higher firm-specific predicted cost of capital (CoC) lowers capital in-tensity (CAPINS). Predicted CAPINS increaseLTDin the firm’sCS
en-hances the P and the value of the firm. The results of a study on SMEs in India showed that they relied more on their own funds and comparatively less on borrowed funds (Dogra and Gupta 2009). Therefore, it is advisable that more profitable firms should hold less debt since higher profit generates more internal funds (Bevan and Danbolt 2002). Further, there are different perceptions about the im-pact ofCAPINSandSIZonP. Hutchinson and Hunter’s study (1998) showed thatPdid not affect theCSof small firms.CAPINScan affect
P because cut-throat competition might eliminate all future prof-its, depressing each firm’s net security level (Ghemawat and Caves 1986); their study proved that profits decline withCAPINS. Thomsen and Pedersen (2000) found that compared to other owner identities, financial investor ownership is found to be associated with higher shareholder value andPbut lower sales growth.CAPINSimposes a greater degree of risk because assets are frozen in long lived forms that may not be easy to sell. Hence, difference inCAPINSmay be as-sociated with difference inP(Bettis 1981). Fluctuation in the profit earned by firms makes debt capital costlier. Consistent profit earn-ing capacity is also looked into as a determinant ofP. Moreover, the competitive market creates much of such risk. In more competitive markets where price cut outs were sought for,P gets reduced due to the higher cost of debt, thereby the chances of financial distress and bankruptcy also increase (Pandey 2002). With reference to size of profit, more profitable firms tend to issue more debt, as debt capi-tal may be available at a cheaper rate. The negative relation between
P and LEV ratios arises from firm’s preference for internal funds over external funds and the availability of internal funds (Chen and Zhao 2004).
Methodology, Objectives and Hypotheses
population and sources of data
The study is based on secondary data of food products manufactur-ing firms, as on 30th January 2010 as shown in table 1, which are col-lected from Centre for Monitoring Indian Economy Prowess (cmie) package.
significance of food industry in india
equip-ment, especially in areas of canning, dairy and food processing, spe-cialty processing, packaging, frozen food/refrigeration and thermo processing. The turnover of the food industry is expected to reach $258 billion by fiscal year 2015 and $318 billion by fiscal year 2020 from the current level of $181 billion. Although India is one of the world’s major food producers, it accounts for less than 1.5 per cent of international food trade. This may be due to lack of proper infras-tructure facilities in India. Foreign direct investment (fdi) in agricul-ture has increased six-fold, rising from $96.4 million in 2004 to $656 million in 2008. Moreover, India is becoming the eastern hub of the food industry. Not only does it have leading production of various materials like milk, fruits and vegetables, grains and animal prod-ucts but the food processing sector is also growing at a rapid rate to cater to the domestic needs and the export market. The Indian food industry is growing at over nine per cent per annum. The size of the food industry is as large as Rs. 4 lakh crore and has been growing fast. It is one-fifth of theusfood industry, which is $550 billion (Rs. 22 lakh crore). These facts indicate a wider scope for development of the food industry in India. Therefore, analyzing the relation be-tween capital structure (CS) andPof food products manufacturing firms becomes significant.
categories of sizes of firms
The study concentrates on three categories of the food industry viz., tea, dairy and vegetable oil firms. According to the National Sample Survey Organization (nsso) on household consumer expenditure for 2007–8 (July–June), milk accounts for 14.9 per cent of the average ru-ral family’s spending on food and the figure stands higher at 18.3 per cent for urban India.nsso’s consumption data is based on a compre-hensive survey covering a sample of 31,673 rural and 18,624 urban households, spread over the entire country. India has also emerged to be the world’s leader in tea production, consumption and export. India’s tea production alone accounts for 31% of global production. It is, perhaps, the only industry where India has retained its lead-ership over the last 150 years. India is also the largest oilseeds and vegetable oil producing country in the world, but equally it is the biggest consumer of vegetable oil too.
objectives and hypotheses development
• To analyze the impact of size of firms in terms of turnover on profitability of the food industry in India.
• To study the factors influencing profitability after controlling for size and to compare with the impact of the factors on the overall profitability of the firms of the food industry in India.
The following hypotheses have been developed to achieve the stated objectives:
h1 Liquidity(LIQ)affects both the firm’s P as well as operating risk (Papaioannou, Travlos and Nickolas 1994), hence it becomes im-portant to study the relation between LIQ ratio and P, which leads to developing the hypothesis as:
h10 Liquidity of a firm does not have a significant influence on prof-itability of the firm.
h2 Capital intensity(CAPINS)imposes a greater degree of risk be-cause assets are frozen in long lived forms that may not be easy to sell; hence difference in CAPINS may be associated with dif-ference in P (Bettis 1981). CAPINS can affect P because, in un-contestable markets, it offers the opportunity to make binding commitments of resources; thereby it does so by tilting the cost structure of production from ongoing towards sunk cost: firms that compete in CAPINS industries typically have to shoulder large, unrecoverable outlays of capital in advance of production decisions. CAPINS can affect P because cut-throat competition might eliminate all future profits depressing each firm’s net se-curity level, thus P declines with capital intensity (Ghemawat and Caves 1986). Based on this inference the following hypothesis is developed:
h20 Capital intensity of a firm does not have a significant influence on profitability of the firm.
h30 Firm’s volatility does not have a significant influence on prof-itability.
h4 More profitable firms tend to issue more debt, as debt capital may be available at a cheaper rate. The negative relations be-tween P and LEV ratios arise from firm’s preference for internal funds over external funds and the availability of internal funds (Chen and Zhao 2004). Therefore, it is recommendable that more profitable firms should hold less debt since higher profit gener-ates more internal funds (Bevan and Dabnolt 2002). However, growing firms may have greater fund requirements to grab new opportunities, which may exceed their retained earnings, there-fore they act according to the pecking order and choose debt rather than equity (Um 2001). Hence, to study the relationship between growth(GROW)and P the following hypothesis is de-veloped:
h40 Growth of a firm does not have a significant influence on prof-itability.
h5 Small enterprises are characterized by variability in profits and growth. Increase in P along with increase in SIZ may help them to grow at a faster rate. Hence, to study the impact of SIZ on P the following hypothesis is developed.
h50 Firm’s size does not have a significant influence on the
prof-itability.
sampling design and technique
The category-wise strength of food product manufacturing firms in India is given in table 1. The multi-stage random sampling technique is used by adopting the following stages:
• Stage 1: The study covers food products manufacturing firms only; firms of beverages and tobacco are not included for the simple reason that they account for a lesser proportion (10%) over total firms in the food industry. Hence, the population con-sidered for the study is 1572 food products manufacturing firms. • Stage 2: Out of 1572 food products manufacturing firms, 1314 firms are found to have details of incorporated year as on 30th January, 2010, hence 1314 firms are considered for further stage. • Stage 3:Among the 1314 firms, 309 firms are found to have the
table 1 Food product manufacturing firms in india: Category-wise strength
Category Number of Firms Total
Food Products
Dairy products 72
Tea 213
Sugar 150
Vegetable oils & product 350
Coffee 21
Other products
Cocoa products & confectionery 12
Bakery products 37
Processed/packaged foods 167
Starches 14
Marine food 102
Poultry & meat products 42
Floriculture 62
Milling products 78
Other agricultural products 252 766
Sub total 1572
Beverages & Tobacco
Tobacco products 35
Beer & alcohol 140
Sub total 175
Total food product manufacturing firms in India 1747 Source:cmie, 30 January 2010.
and therefore,bselisted firms (309) are taken into account for the further stage.
• Stage 4:Out of the 309bselisted firms, 99 firms only are found to have been continuously listed, based onbse trading dates avail-ability over the period of study, which are considered for the fur-ther stage.
• Stage 5:Out of 99 firms, 87 firms only have complete data for the period of study. Considering the complete data availability, 87 firms are considered for the further stage. Out of 87 firms, 52 firms only of three categories i. e., 9 firms fromtea sector,11 firms fromdairy sector,and 32 firms from thevegetable oil sector
period of the study
The required data have been collected for a period of 10 years on year-on-year basis ranging from 1998–9 to 2008–9, which are subject to limitations such as continuous listing for 10 years and availability of data for the period under study.
Research Methods Used
Descriptive statistics such as mean and standard deviation are ex-tensively used to neutralize the fluctuations in the value of indepen-dent and depenindepen-dent variables. Correlation co-efficient is also exten-sively used to determine the one-to-one relationship between se-lected variables. Multiple regressions are also used to determine the various significant variables that influence the P of a firm. Factor analysis is also used to determine the factors influencingP.
regression equation
The regression equation is formulated for the purpose of finding the factors determiningP. The termPhas been defined (as the average rate of return on assets) by Lowe, Jordan and Taylor (1994).
dependent variable
The dependent variable isP, computed using the ROA ratio.Phas been considered asROA= Ratio of (ebit+ depreciation charges) to fixed assets (Roden and Lewellen 1995).
independent variables
• Liquidity (LIQ)
• Capital-Intensity (CAPINS) • Size of the Firm (SIZ)
• Growth in Total Assets (GROW) • Volatility (VOL)
ratios of independent variables
• LIQ = The average ratio of cash and marketable securities to Total Assets
• CAPINS= Total Assets to Sales • SIZ= Logarithm of Sales over Years
• GROW = Compounded annual growth rate of Total Asset • VOL= Standard deviation of Earnings before Interest, Taxes and
control variables
The chosen sample firms are further grouped into three categories based on the size measured based on the quantum of sales. The firms with a sales turnover up to Rs.100 crore are grouped as’small sized firms,’the firms with a sales turnover of > Rs.100 crore but < Rs.500 crore are grouped as’medium sized firms,’and firms with a turnover of > Rs.500 crore are grouped as’large sized firms.’The industry av-erage of sales turnover for the study period of 10 years is considered for categorization of firms into three sub groups as stated.
P=α+β1LIQ+β2CAPINS+β3SIZ+β4GROW+β5VOL+ε. (1)
Industry Analysis and Discussion
overall correlation and regression analysis
Overall descriptive statistics reveals thatCAPINShas a higher mean value and its deviation is also higher. This shows that the food in-dustry probably doesn’t block a fixed amount of capital in the form of long lived assets. Their investment in fixed assets keeps on changing over the period of study thereby leading to a higher standard devi-ation when compared to other variables. The devidevi-ation from mean values forP,LIQ,SIZ,GROW andVOL, however, remains less than one, indicating that the other variables are fluctuating less than that of the CAPINS. The overall correlation matrix of the independent variables shows that the correlation between SIZ and P (0.426) is highly significant (at 1% level). The SIZ therefore significantly in-fluencesP, and the positive correlation represents thatPincreases withSIZ. There is a significant positive correlation betweenGROW
andP(0.351) at 5% level, which indicates that as the firm grows the
Pincreases.CAPINSshows a negative correlation withPas pointed out by Ghemawat and Caves (1986). They suggested that CAPINS
can affectPbecause cut-throat competition might eliminate all fu-ture profits, depressing each firm’s net security level.LIQandVOL
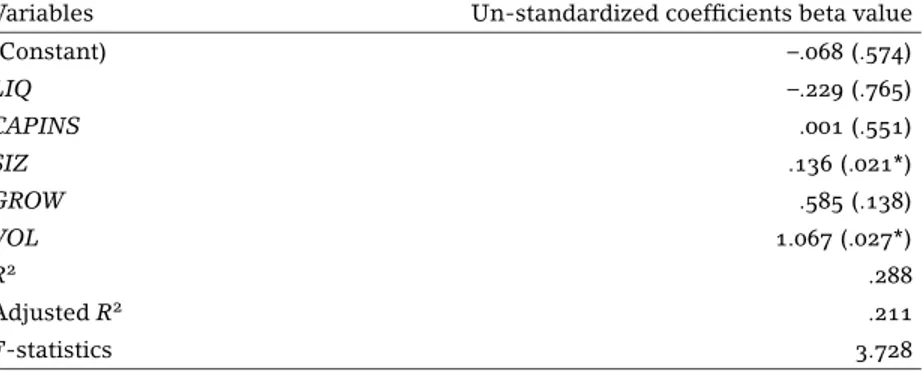
show a positive correlation withP, which is, however, insignificant. The results of multiple regressions on the dependent variable –
P are shown in table 2. The multiple regression result shows that
table 2 Multiple regressions on dependent variable – profitability
Variables Un-standardized coefficients beta value
(Constant) –.068 (.574)
LIQ –.229 (.765)
CAPINS .001 (.551)
SIZ .136 (.021*)
GROW .585 (.138)
VOL 1.067 (.027*)
R2 .288
AdjustedR2 .211
F-statistics 3.728
table 3 Factor analysis on overall food industry on profitability
Factor Eigen value Variable convergence Factor loadings
Factor 1 2.246 Size .787
Profitability .745 Capital intensity –.662
Growth .574
Factor 2 1.262 Volatility –.807
Liquidity .622
industry needs to take risks to earn more profit; hence the indus-try shows an abnormal positive relation between VOLand P. The adjustedR2 also shows that the model is 21% fit; theFstatistics is, however, highly significant (at 1% level).
Factor analysis (FA) is performed to test the factors significantly determining thePof the food industry and the results are shown in table 3. TheFAshows that (variables are grouped into two factors) there is a high rate of interrelation between them. Factor 1, which constitutesSIZ,P,CAPINS, andGROW indicates a high level of cor-relation between them, while VOL and LIQ which are grouped as factor 2 also show a high degree of interrelation.
impact of size of firms on profitability
Table 4 shows an overview of the trend ofPof three size categories of firms of the food industry in India. ThePhas shown a sharp rise during the last four years of the study period, and a fall in the year 2008–9, however, thelarge size firmsshow a higherP. ThoughPhas decreased in the last year of the study period forlarge size firmsthe
CShas, however, increased.
table 4 Size-wise trends of profitability of food industry in India during 2000–9
Year 2000 2001 2002 2003 2004 2005 2006 2007 2008 2009 (1) 0.167 0.17 0.21 0.21 0.207 0.18 0.245 0.410 0.819 0.529 (2) 0.247 0.23 0.20 0.29 0.376 0.24 0.252 0.268 0.399 0.277 (3) 0.276 0.30 0.26 0.29 0.330 0.30 0.467 0.447 0.482 0.426 Row headings are as follows: (1) small size firms, (2) medium size firms, (3) large size firms. Source:cmie, 30 January 2010.
table 5 Multiple regressions on dependent variable – profitability (for small size firms)
Variables Un-standardized coefficients beta value
Model 1 Model 2†
(Constant) .031 (.791) .027 (.705)
LIQ –.106 (.922) –.096 (.926)
CAPINS 7.663e−6(.995) 3.268e−5(.972)
SIZ –.003 (.966) –
GROW 2.302 (.031*) 2.279 (.010**)
VOL 1.764 (.001**) 1.760 (.000**)
R2 .620 .620
AdjustedR2 .484 .519
F-statistics 4.567* 6.115**
Notes: The figures in parentheses arepvalues. ** Significant at 0.01 level. * Significant at 0.05 level. † After removing predictor variableSIZ.
firms indicate that CAPINS has higher mean and standard devia-tions in all the three (small size, medium size andlarge size firms) categories of firms, indicating that there is a wide deviation among the firms in the investment in fixed assets.
Analysis of Small Size Firms
The correlation matrix forsmall size firmsshows thatVOLis highly significantly positively correlated with P (0.611) at 1% level. This shows that thesmall size firmshave to face more challenges to earn additional profit and thusVOLincreases with PwhileCAPINSand
LIQshow a negative correlation withP,GROW andSIZshow a pos-itive correlation withP.
Step-wise regression is applied to study the impact of selected variables on P of Small Size Firms of Food Industry and the re-sults are shown in table 5. Multiple regressions forsmall size firms
table 6 Factor analysis for small size firms of food industry on profitability
Factor Eigen value Variable convergence Factor loadings
Factor 1 2.168 Size .892
Growth .772
Capital intensity –.722
Factor 2 1.563 Volatility .936
Profitability .834
Factor 3 1.058 Liquidity .926
(1.764). The variable,SIZhas been removed inmodel 2to better un-derstand the impact of the variables on P. GROW and VOL have highly significant positive coefficients (2.279 and 1.76 respectively) withP(at 1% level). The adjustedR2value shows that it influences to the extent of 48.4% (adjusted R2) on P in model1, which is fit (F=4.567 at 5% level). However in model 2, the impact increases to the extent of 51.9% (adjusted R2), which also reveals a good fit (F=6.115 at 5% level) thereby leads to infer that the regression model is a good fit after removing the variableSIZ from the equa-tion.
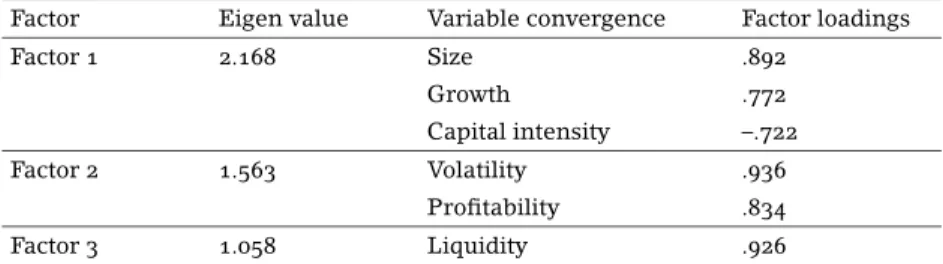
FAis performed to study the factor significantly determining theP
of small size firms of the food industry and the results are shown in table 6. TheFAforsmall size firmsreveals that the selected variables have been grouped into three factors. The variablesSIZ,GROW, and
CAPINSconstitutefactor 1,variablesVOLandPconstitutefactor 2,
while variableLIQformsfactor 3. Analysis of Medium Size Firms
The correlation matrix ofmedium size firmsshows that GROW has a significant positive correlation (0.427) withP(at 5% level), while
table 7 Multiple regressions on dependent variable – profitability (for medium size firms)
Variables Un-standardized coefficients beta value
Model 1 Model 2†
(Constant) 1.483 (.021) 1.133 (.050)
LIQ 1.285 (.320) –
CAPINS –.062 (.247) –
SIZ –.542 (.039*) –.391 (.100)
GROW .746 (.056) .763 (.050*)
VOL –1.400 (.127) –1.118 (.211)
R2 .405 .311
AdjustedR2 .219 .196
F-statistics 2.177 2.706
Notes: The figures in parentheses arepvalues. ** Significant at 0.01 level. * Significant at 0.05 level. † After removing predictor variableLIQ&CAPINS.
table 8 Factor analysis for medium size firms of food industry on profitability
Factor Eigen value Variable convergence Factor loadings
Factor 1 1.643 Profitability .866
Growth .800
Factor 2 1.464 Volatility –.925
Size .705
Factor 3 1.065 Capital intensity –.807
Liquidity .599
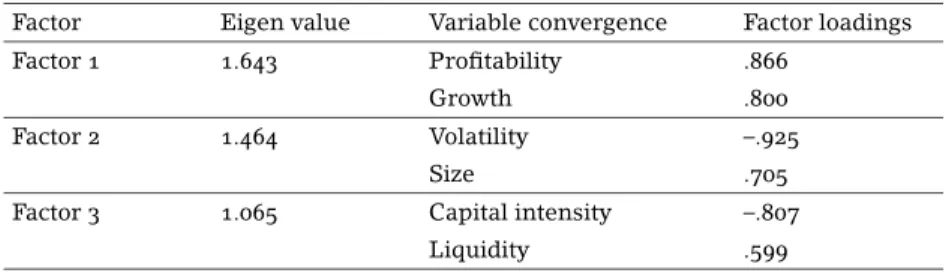
FAis performed to study the factors significantly determining the
P of Medium Size Firms of the Food Industry and the results are shown in table 8. The factor analysis formedium size firmsreveals that there exists a higher level of interrelation among the selected variables.
Analysis of Large Size Firms
The correlation matrix forlarge size firmsshows a significant pos-itive correlation between CAPINS and P (at 5% level) while there exists a negative relation betweenCAPINSandPin the case ofsmall
table 9 Multiple regressions on dependent variable – profitability (for large size firms)
Variables Un-standardized coefficients beta value
Model 1 Model 2†
(Constant) –.131 (.914) .360 (.425)
LIQ –1.416 (.370) –1.594 (.255)
CAPINS .486 (.068) .463 (.045*)
SIZ .140 (.665) –
GROW .205 (.835) .086 (.919)
VOL 3.695 (.518) 3.317 (.515)
R2 .771 .759
AdjustedR2 .486 .566
F-statistics 2.701 3.937
Notes: The figures in parentheses arepvalues. ** Significant at 0.01 level. * Significant at 0.05 level. † After removing predictor variableSIZ.
eliminate all future profits depressing each firm’s net security level, thereby leading the decrease inPto decline withCAPINS. Perhaps, such high competition does not prevail among large size firms, as the food industry is presently a growing industry. IncreasedCAPINS
leads to increased risk by blocking huge capital in the form of fixed assets thereby reducingPonly if there is a cut-throat competition.
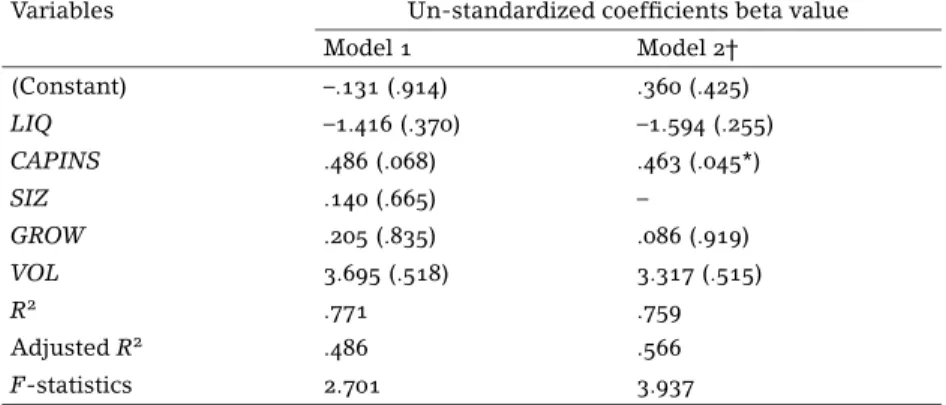
Step-wise regression is applied to study the impact of selected variables onPof Large Size Firms of the Food Industry and the re-sults are shown in table 9. Multiple regressions forlarge size firms
are carried out in two models vizmodel 1andmodel 2.The regres-sion result forlarge size firms shows thatCAPINShas a significant positive coefficient (0.463) withP (at 5% level) after removing the impact ofSIZonPfrom the ordinary least square (ols) regression model. The adjustedR2value is also higher inmodel 2,showing that this (regression) equation fits better.GROWandVOLhave a positive coefficient withP, and LIQhas a negative coefficient withPin the case oflarge size firms.
FAis performed to study the factors significantly determining the
Pof Large Size Firms of the Food Industry and the results are shown in table 10. The FA of large size firms shows that there is a high interrelation among these variables.
Findings and Concluding Remarks
table 10 Factor analysis for large size firms of food industry on profitability
Factor Eigen value Variable convergence Factor loadings Factor 1 2.452 Capital intensity .934
Profitability .911
Liquidity –.560
Factor 2 1.399 Volatility .818
Growth –.585
Size .551
(0.351 at 5% level), indicating that as the firm grows thePincreases. However, CAPINS shows a negative correlation with P as pointed out by Ghemawat and Caves (1986). Thus,h40 is rejected. The cor-relation betweenSIZ andP(0.426) is highly significant at 1% level, throwing light on the significant impact ofSIZin determiningPof the Indian food industry. Thus,h50 is also rejected asSIZ has a
sig-nificant impact on the relationship of variables in determiningPof the food industry in India. The size-wise analysis of the firms also supports the rejection of the hypothesis.VOLalso shows a signifi-cant positive coefficient with P(1.067 at 5% level), which does not match with the outcome of the study of Pandey (2002), who pointed out that fluctuation in the profit earned might increase the cost of capital, thus reducing P. However, the statement holds good for a well established industry, which probably has less challenges. The food industry, being a growing industry in India needs to take risk to earn higher profit. Thus, the industry shows an abnormal positive relation betweenVOLandP, which leads to rejecting theh30.
The specific size-wise analysis reveals that the small size firms
have to face more challenges to earn additional profit and thusVOL
increases significantly with P. Therefore,h30 is rejected in the case ofsmall size firms. Thus, the industry shows an abnormal positive relation between VOLand P. The correlation matrix forsmall size firmsalso shows thatVOLis significantly positively correlated with
P(0.611 at 1% level). This shows thatsmall size firms have to face more challenges to earn additional profit and thus VOL increases withP. Multiple regression analysis of small size firms shows that
GROW as well as VOLhave a significant/highly significant positive coefficient withP. WhenSIZis removed from the regression equa-tion,GROWas well asVOLhas a significant positive coefficient with
P, significant at 1% level andVOLhas a positive coefficient withP. Therefore,h30andh40are rejected in the case ofsmall size firms.
has a significant positive correlation withP.Model 1 of regression analysis indicates thatSIZhas a significant negative coefficient with
P, whereas model 2 of regression analysis shows thatGROW has a significant positive coefficient withP, therebyh50is rejected in case
ofmedium size firms.
The correlation matrix forlarge size firmsshows a significant pos-itive correlation betweenCAPINSandP. Therefore,h20is rejected in
the case oflarge size firms,however there exists a negative relation betweenCAPINSandPin case ofsmallas well asmedium size firms.
The overall result also corroborates a negative correlation between
CAPINSandP, which fact reveals that the larger the size of the firm, the more the investment in the long lived assets has helped to in-crease the Pof the firm, unlike the trends in small size as well as inmedium size firmswhere there exists a negative relation between
PandCAPINS. The increased CAPINSleads to increase in risk by blocking huge capital in the form of fixed assets thereby reducingP
only if there is a cut-throat competition as stated by Ghemawat and Caves (1986). The regression result forlarge size firmsshows that
CAPINShas a significant positive coefficient withPafter removing the impact ofSIZfrom the regression model. The adjustedR2value is also higher inmodel 2when compared with that ofmodel 1, show-ing that the equation fits better.
Thus different hypotheses are rejected at different size categories, indicating that size decides the extent to which of the other predic-tor variables are related withP.h10, which assumes thatLIQhas no
significant impact onPof the firms in the food industry in India, is accepted in all the categories irrespective of size of the firms. The overall results also commend the same.
Limitations and Scope for Further Studies
• Analysis of the study is based on financing data collected from
cmieProwess Package; hence the quality of the study depends purely upon the accuracy, reliability and quality of secondary data.
• The analysis could not be extended to a larger period due to the problem of resources/ data availability.
• The sample firms chosen for the study are restricted to the small in number due to limitations such as lack of continuous list-ing, non-availability of data pertaining to those firms in the data source-Prowess Package.
indus-try only. Hence, studies could well be undertaken in other categories e. g., sugar, coffee, and other products of the food industry as well as in other industries too. A comparative study across industries can also be made.
Pis studied by use of ratio ofROA. For further studies, the other profitability ratios can also be considered. Other than the predictor variables used in this study, age, exports, reliance on debt, employee productivity and managerial efficiency may also be used as predictor variables.
Acknowledgements
The authors acknowledge the University Grants Commission, New Delhi for funding a Major Research Project against the Title of the Paper.
References
Barton, S., and P. Gordon. 1988. ‘Corporate Strategy and Capital Struc-ture.’Strategic Management Journal9 (6): 623–32.
Bevan, A. A., and J. Danbolt. 2002. ‘Capital Structure and Its Determi-nants in the United Kingdom – A Decomposition Analysis.’Applied Financial Economics12 (3): 159–70.
Bettis, R. A. 1981. ‘Performance Difference in Related and Unrelated Diversified Firms.’Strategic Management Journal2 (4): 379–93. Booth, L., V. Aivazian, A. Demirguc-Kunt, and V. Maksimovic. 2001.
‘Capital Structures in Developing Countries.’The Journal of Finance 56 (1): 87–130.
Chang, S. J. 2003. ‘Ownership Structure, Expropriation and Performance of Group-Affiliated Firms in Korea.’ The Academy of Management Journal46 (2): 238–53.
Chen, L., and X. S. Zhao. 2004. ‘Profitability Means Reversion of Lever-age Ratios and Capital Structure Choice.’ Working Paper Series, Michigan State University, East Lansing,mi.
Dogra, B., and S. Gupta. 2009. ‘An Empirical Study on Capital Structure ofsmes in Punjab.’TheicfaiJournal of Applied Finance15 (3): 60– 80.
Harris, F. H. 1994. ‘Asset Specificity, Capital Intensity and Capital Struc-ture: An Empirical Test.’Managerial and Decision Economics15 (6): 563–76.
Ghemawat, P., and R. E. Caves. 1986. ‘Capital Commitment and Prof-itability: An Empirical Investigation.’Oxford Economic Papers38 (1): 94–110.
Kester, C. W. 1986. ‘Capital and Ownership Structure: A Comparison of United States and Japanese Manufacturing Corporations.’Financial Management15 (1): 5–16.
Lowe, J., J. Jordan and P. Taylor. 1998. ‘Strategy and Financial Policy in
ukSmall Firms.’Journal of Business Finance and Accounting25 (1– 2): 1–27.
Myers, S. C. 1984. ‘The Capital Structure Puzzle.’The Journal of Finance 39 (3): 575–92.
Pandey, I. M. 2002. ‘Capital Structure and Market Power Interaction: Evidence from Malaysia.’Asia Pacific Journal of Economics and Busi-ness8 (2): 78–91.
Papaioannou, G. J., S. E. Travlos, and G. Nickolas. 1992. ‘Ownership Structure and Corporate Liquidity Policy.’Managerial and Decision Economics13 (4): 315–322.
Pinegar, M. J., and L. Wilbricht. 1989. ‘What Managers Think of Capital Structure Theory: A Survey.’Financial Management18 (4): 82–91. Raghuram, G. R., and L. Zingales. 1995. ‘What Do We Know About
Cap-ital Structure? Some Evidence from International Data.’The Journal of Finance50 (5): 1421–60.
Roden, D. M., and W. G. Lewellen.1995. ‘Corporate Capital Structure De-cisions: Evidence from Leveraged Buyouts.’Financial Management 24 (2): 76–87.
Thomsen, S., and T. Pedersen. 2000. ‘Ownership Structure and Eco-nomic Performance in the Largest European Companies.’Strategic Management Journal21 (6): 689–705.
Titman, S., and R. Wessels. 1988. ‘The Determinants of Capital Structure Choice.’Journal of Finance43 (1): 1–19.