www.clim-past.net/10/1363/2014/ doi:10.5194/cp-10-1363-2014
© Author(s) 2014. CC Attribution 3.0 License.
Constraining Holocene hydrological changes in the
Carpathian–Balkan region using speleothem
δ
18
O and pollen-based
temperature reconstructions
V. Dr˘agu¸sin1,2,3, M. Staubwasser3, D. L. Hoffmann4, V. Ersek5,6, B. P. Onac7,8, and D. Veres8
1Emil Racovi¸t˘a Institute of Speleology, Romanian Academy, Frumoas˘a 31, 010986, Bucharest, Romania 2Department of Geology, Babe¸s-Bolyai University, Kog˘alniceanu 1, 400084, Cluj-Napoca, Romania 3Institute of Geology and Mineralogy, University of Cologne, Greinstrasse 4–6, 50939, Cologne, Germany 4National Research Centre for Human Evolution, Paseo Sierra de Atapuerca, s/n, 09002 Burgos, Spain 5Department of Geography, Northumbria University, Ellison Building, NE1 8ST, Newcastle upon Tyne, UK 6Department of Earth Sciences, University of Oxford, South Parks Rd, OX1 3AN, Oxford, UK
7School of Geosciences, University of South Florida, 4202 E. Fowler Ave., NES 107, FL 33620, Tampa, USA 8Institute of Speleology, Romanian Academy, Clinicilor 5, 400006, Cluj-Napoca, Romania
Correspondence to:M. Staubwasser ([email protected])
Received: 19 December 2013 – Published in Clim. Past Discuss.: 22 January 2014 Revised: 27 May 2014 – Accepted: 9 June 2014 – Published: 22 July 2014
Abstract. Here we present a speleothem isotope record (POM2) from Ascuns˘a Cave (Romania) that provides new data on past climate changes in the Carpathian–Balkan re-gion from 8.2 ka until the present. This paper describes an approach to constrain the effect of temperature changes on calcite δ18O values in stalagmite POM2 over the course of the middle Holocene (6–4 ka), and across the 8.2 and 3.2 ka rapid climate change events. Independent pollen tempera-ture reconstructions are used to this purpose. The approach combines the temperature-dependent isotope fractionation of rain water during condensation and fractionation resulting from calcite precipitation at the given cave temperature. The only prior assumptions are that pollen-derived average an-nual temperature reflects average cave temperature, and that pollen-derived coldest and warmest month temperatures re-flect the range of condensation temperatures of rain above the cave site. This approach constrains a range of values be-tween which speleothem δ18O changes should be found if controlled only by surface temperature variations at the cave site. Deviations of the change in δ18Oc_spelvalues from the calculated temperature-constrained range of change are inter-preted towards large-scale variability of climate–hydrology.
Following this approach, we show that an additional
∼0.6 ‰ enrichment ofδ18Oc in the POM2 stalagmite was
caused by changing hydrological patterns in SW Roma-nia across the middle Holocene, most likely comprising lo-cal evaporation from the soil and an increase in Mediter-ranean moisture δ18O. Further, by extending the calcula-tions to other speleothem records from around the entire Mediterranean basin, it appears that all eastern Mediter-ranean speleothems recorded a similar isotopic enrichment due to changing hydrology, whereas all changes recorded in speleothems from the western Mediterranean are fully ex-plained by temperature variation alone. This highlights a dif-ferent hydrological evolution between the two sides of the Mediterranean.
Figure 1.Location of Romanian palaeoclimate records and mete-orological stations mentioned in the text: 1 – Ascuns˘a Cave; 2 – Drobeta meteorological station; 3 – Poleva Cave; 4 – Ur¸silor Cave; 5 – V11 Cave; 6 – Stâna de Vale meteorological station; 7 – Stere-goiu peat bog; 8 – Sfânta Ana Lake.
1 Introduction
In the region surrounding the eastern Mediterranean, proxy records suggest that conditions were more humid during the early Holocene compared to present-day moisture budgets (Rossignol-Strick, 1999; Rohling et al., 2002). Enhanced freshwater flux roughly between 10 000 years before present (10 ka) and 6 ka led to stratification and sapropel formation in the eastern Mediterranean. At the same time, depletedδ18O values in lacustrine calcareous microfossils and endogenic carbonate deposits suggest less evaporation across the region during that time compared to the present day. A stacked oxy-gen isotope record oxy-generated from lake proxies around the eastern Mediterranean shows a general drying trend between 6 and 4 ka (Roberts et al., 2008). A pattern of increasingδ18O values with time from the early to mid-late Holocene is docu-mented in speleothem records from south-central Europe and the eastern Mediterranean (McDermott et al., 2011, and ref-erences therein). This has been suggested by McDermott et al. (2011) to reflect more efficient rainout from an Atlantic source of moisture and less of it reaching the eastern Mediter-ranean region during the late Holocene.
Due to the topographic complexity and rather sparse data distribution, reports from across the Carpathian–Balkan re-gion do not provide yet a common view on past environmen-tal change, but rather point to possibly contrasting Holocene hydroclimatic evolution at the regional scale (Feurdean et al., 2008; Magyari et al., 2013). Lake records from the south-ern Balkans, such as Ioannina, Greece (Frogley et al., 2001), and Prespa and Ohrid, Macedonia (Leng et al., 2010) indicate high humidity throughout the early Holocene, whereas palae-olimnological records from Steregoiu, NW Romania (Feur-dean et al., 2007) and Sfânta Ana, central Romania (Magyari
et al., 2009), suggest that lower humidity persisted in the area. At Sfânta Ana, a volcanic crater lake with no outflow, water levels began to rise only after 7.4 ka (Magyari et al., 2009).
Several Holocene speleothem records are available from the Romanian Carpathians (Onac et al., 2002; T˘ama¸s et al., 2005; Constantin et al., 2007). Trends towards higher values seen in these time series throughout the Holocene were interpreted as reflecting rising temperatures. McDer-mott et al. (2011) expanded the interpretation of individ-ual European speleothem records and suggested a decreas-ing rainout gradient across the Holocene along a longitudi-nal transect. However, a more specific distinction between hydrology and temperature-driven changes is not easily achieved because interpreting stable oxygen isotope records from speleothems in terms of palaeoclimate is not gen-erally straightforward (McDermott, 2004; Lachniet, 2009; Tremaine et al., 2011). For instance, the effects of temper-ature and climate–hydrology changes may cancel each other out, for example if there is a change in rainfall seasonality. Changes in seasonality of both rainfall and calcite precipita-tion are difficult to detect (Baker et al., 2011). Furthermore, moisture sources and transport trajectories, which generally affect the stable isotopic composition of meteoric water in Europe (Rozanski et al., 1982), may respond to regional-scale climate changes in contrast to local ones. Consequently, specific temperature or hydrological information is rarely di-rectly quantifiable from speleothem stable isotope records. An example is the muted or even absent signal around the 8.2 ka cold event in speleothemδ18O records throughout Ro-mania (T˘ama¸s et al., 2005; Constantin et al., 2007), despite this event being clearly identifiable in peat bog pollen records (Feurdean et al., 2007), in Balkan lake records (Pross et al., 2009; Panagiotopoulos et al., 2013), as well as in the Aegean Sea (Marino et al., 2009). This ambiguity of speleothemδ18O records with respect to climatic events and transitions raises the question of how more specific information on the nature of climate change can be extracted from this proxy.
Figure 2.Average monthly precipitation quantities at stations Dro-beta and Stâna de Vale (data from Dragot˘a and Baciu, 2008).
(Mayewski et al., 2004; Roberts et al., 2008, 2011; McDer-mott et al., 2011). Finally, local pollen data sets (Feurdean et al., 2008; Bordon et al., 2009) are used to constrain selected rapid climate shifts associated with the 8.2 ka and the 3.2 ka events.
2 Materials and methods
2.1 Cave setting and stalagmite characteristics
Ascuns˘a Cave is located on the eastern slopes of Mehedin¸ti Mountains, Southern Carpathians (45.0◦N, 22.6◦E, 1050 m
alt.) in southwestern Romania (Fig. 1). It is a 400 m long and over 200 m deep contact cave developed by river erosion of Turonian–Senonian wildflysch (mélange) below an Upper Jurassic–Aptian limestone cover (Codarcea et al., 1964).
The cave is well decorated with speleothems and through-out its course there is a chaotic mixture of collapsed blocks and speleothem fragments reflecting the undermining of the wildflysch walls by fluvial erosion or their failure to support massive flowstone formations.
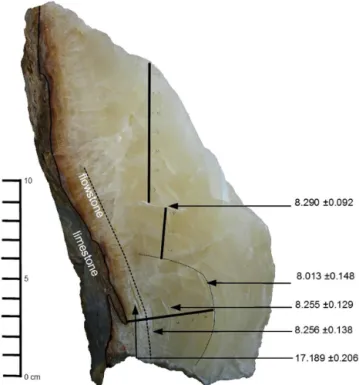
The analysed stalagmite (POM2) is 77.4 cm long and com-posed of well-laminated and densely compacted white calcite (Figs. 3 and 4). Topographic survey at the cave site revealed that limestone thickness above the stalagmite sampling site is∼100 m.
Figure 3.Base of stalagmite POM2 (ages are given in ka).
2.2 Present day climatology of the study area and cave monitoring
The regional climate of the Romanian Carpathians is temperate–continental, characterised by a predominantly At-lantic origin of air masses (Balt˘a and Geicu, 2008). It is also influenced (in the southwestern part) by Mediterranean cy-clonic activity that is responsible for milder temperatures and increased winter rainfall in the area of the study site com-pared to northern or eastern Carpathians (Bojariu and Paliu, 2001; Apostol, 2008). Most of the cyclones affecting the study area originate in the central Mediterranean (around the Gulf of Genoa), but cyclones from the Aegean Sea also reach this region periodically (Apostol, 2008). Seasonal variability is observed in the formation of these cyclones, as shifts of the polar jet stream in winter affect Mediterranean cyclogenesis (Trigo et al., 2002).
Figure 2 illustrates the seasonal differences in precipita-tion recorded between 1961 and 2000 at two meteorological stations relevant for this study, Drobeta (SW Romania) and Stâna de Vale (W Romania) (data from Dragot˘a and Baciu, 2008). There is a clear difference in rainfall seasonality be-tween the two regions, with Stâna de Vale having one rainfall peak in the summer, whereas at Drobeta two main rainfall pe-riods are peaking in spring and early winter (Fig. 2).
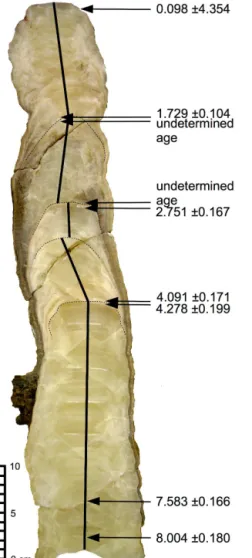
Figure 4.Upper part of stalagmite POM2 (ages are given in ka).
within Ascuns˘a Cave, using two Vaisala probes, GMP222 for CO2and HMP75 forT and RH. Drip water collected from stalactite tips at the sampling sites was analysed forδ18O and δD on a Picarro L2130-i Cavity Ring-Down Spectroscope at Babe¸s-Bolyai University (Cluj-Napoca, Romania) following the method described by Brand et al. (2009). The analytical precision is better than±0.03 ‰ forδ18O and±0.07 ‰ for δD. For data normalisation, two laboratory reference waters (VEEN and HTAMP) that were calibrated directly against VSMOW were measured repeatedly in each run. Results are expressed in ‰ on the VSMOW scale.
2.3 U-series dating and stable isotope analysis of speleothem samples
For U–Th dating, calcite samples were analysed on a THERMO Neptune MC-ICP-MS following procedures out-lined in Hoffmann et al. (2007) and Hoffmann (2008). In total, 14 U–Th samples were measured, covering the entire length of the stalagmite. Three pairs of samples were drilled
Figure 5.The growth model (solid line) of stalagmite POM2 with 95 % confidence intervals (dashed lines). Arrows indicate growth axis changes.
immediately underneath and above visible changes in growth axis at 43.4, 54.4 and 63.9 cm.
A total of 150 stable isotope samples were hand drilled at 5 mm resolution using a 0.5 mm drill bit. All samples were analysed at the University of Oxford on a Thermo Delta V Advantage mass spectrometer equipped with a Kiel IV Car-bonate Device. Results are reported relative to the Vienna Pee Dee Belemnite (VPDB) standard, and external precision on replicate samples (NBS 18, NBS 19, and a local carbonate standard) run daily on this system was 0.06 ‰ forδ18O and 0.03 ‰ forδ13C.
3 Results and discussion
3.1 U-series dating results and growth model
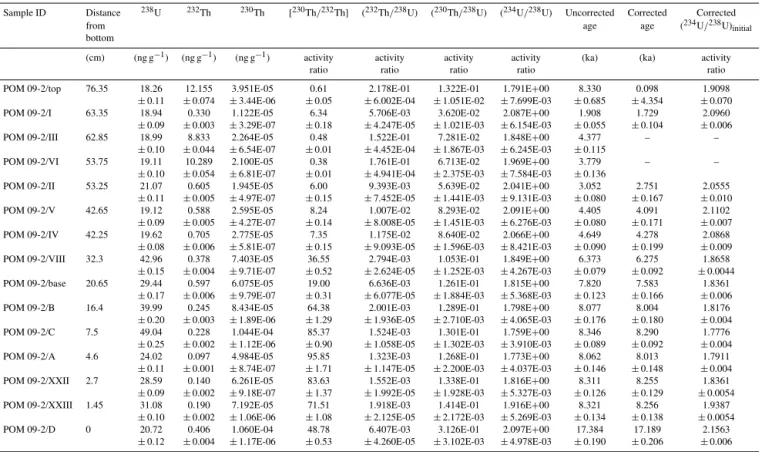
Table 1.Results of the U–Th measurements of POM2 samples.
Sample ID Distance 238U 232Th 230Th [230Th/232Th] (232Th/238U) (230Th/238U) (234U/238U) Uncorrected Corrected Corrected
from age age (234U/238U)
initial bottom
(cm) (ng g−1) (ng g−1) (ng g−1) activity activity activity activity (ka) (ka) activity
ratio ratio ratio ratio ratio
POM 09-2/top 76.35 18.26 12.155 3.951E-05 0.61 2.178E-01 1.322E-01 1.791E+00 8.330 0.098 1.9098
±0.11 ±0.074 ±3.44E-06 ±0.05 ±6.002E-04 ±1.051E-02 ±7.699E-03 ±0.685 ±4.354 ±0.070 POM 09-2/I 63.35 18.94 0.330 1.122E-05 6.34 5.706E-03 3.620E-02 2.087E+00 1.908 1.729 2.0960
±0.09 ±0.003 ±3.29E-07 ±0.18 ±4.247E-05 ±1.021E-03 ±6.154E-03 ±0.055 ±0.104 ±0.006 POM 09-2/III 62.85 18.99 8.833 2.264E-05 0.48 1.522E-01 7.281E-02 1.848E+00 4.377 – –
±0.10 ±0.044 ±6.54E-07 ±0.01 ±4.452E-04 ±1.867E-03 ±6.245E-03 ±0.115
POM 09-2/VI 53.75 19.11 10.289 2.100E-05 0.38 1.761E-01 6.713E-02 1.969E+00 3.779 – –
±0.10 ±0.054 ±6.81E-07 ±0.01 ±4.941E-04 ±2.375E-03 ±7.584E-03 ±0.136
POM 09-2/II 53.25 21.07 0.605 1.945E-05 6.00 9.393E-03 5.639E-02 2.041E+00 3.052 2.751 2.0555
±0.11 ±0.005 ±4.97E-07 ±0.15 ±7.452E-05 ±1.441E-03 ±9.131E-03 ±0.080 ±0.167 ±0.010 POM 09-2/V 42.65 19.12 0.588 2.595E-05 8.24 1.007E-02 8.293E-02 2.091E+00 4.405 4.091 2.1102
±0.09 ±0.005 ±4.27E-07 ±0.14 ±8.008E-05 ±1.451E-03 ±6.276E-03 ±0.080 ±0.171 ±0.007 POM 09-2/IV 42.25 19.62 0.705 2.775E-05 7.35 1.175E-02 8.640E-02 2.066E+00 4.649 4.278 2.0868
±0.08 ±0.006 ±5.81E-07 ±0.15 ±9.093E-05 ±1.596E-03 ±8.421E-03 ±0.090 ±0.199 ±0.009 POM 09-2/VIII 32.3 42.96 0.378 7.403E-05 36.55 2.794E-03 1.053E-01 1.849E+00 6.373 6.275 1.8658
±0.15 ±0.004 ±9.71E-07 ±0.52 ±2.624E-05 ±1.252E-03 ±4.267E-03 ±0.079 ±0.092 ±0.0044 POM 09-2/base 20.65 29.44 0.597 6.075E-05 19.00 6.636E-03 1.261E-01 1.815E+00 7.820 7.583 1.8361
±0.17 ±0.006 ±9.79E-07 ±0.31 ±6.077E-05 ±1.884E-03 ±5.368E-03 ±0.123 ±0.166 ±0.006 POM 09-2/B 16.4 39.99 0.245 8.434E-05 64.38 2.001E-03 1.289E-01 1.798E+00 8.077 8.004 1.8176
±0.20 ±0.003 ±1.89E-06 ±1.29 ±1.936E-05 ±2.710E-03 ±4.065E-03 ±0.176 ±0.180 ±0.004 POM 09-2/C 7.5 49.04 0.228 1.044E-04 85.37 1.524E-03 1.301E-01 1.759E+00 8.346 8.290 1.7776
±0.25 ±0.002 ±1.12E-06 ±0.90 ±1.058E-05 ±1.302E-03 ±3.910E-03 ±0.089 ±0.092 ±0.004 POM 09-2/A 4.6 24.02 0.097 4.984E-05 95.85 1.323E-03 1.268E-01 1.773E+00 8.062 8.013 1.7911
±0.11 ±0.001 ±8.74E-07 ±1.71 ±1.147E-05 ±2.200E-03 ±4.037E-03 ±0.146 ±0.148 ±0.004 POM 09-2/XXII 2.7 28.59 0.140 6.261E-05 83.63 1.552E-03 1.338E-01 1.816E+00 8.311 8.255 1.8361
±0.09 ±0.002 ±9.18E-07 ±1.37 ±1.992E-05 ±1.928E-03 ±5.327E-03 ±0.126 ±0.129 ±0.0054 POM 09-2/XXIII 1.45 31.08 0.190 7.192E-05 71.51 1.918E-03 1.414E-01 1.916E+00 8.321 8.256 1.9387
±0.10 ±0.002 ±1.06E-06 ±1.08 ±2.125E-05 ±2.172E-03 ±5.269E-03 ±0.134 ±0.138 ±0.0054 POM 09-2/D 0 20.72 0.406 1.060E-04 48.78 6.407E-03 3.126E-01 2.097E+00 17.384 17.189 2.1563
±0.12 ±0.004 ±1.17E-06 ±0.53 ±4.260E-05 ±3.102E-03 ±4.978E-03 ±0.190 ±0.206 ±0.006
for initial Th, combined with the young age of the stalag-mite which yields low230Th /232Th activity ratios (<10) for six of the age determinations. Two samples (POM 09-2 / III and POM 09-2 / VI) were entirely dominated by detrital Th, with230Th /232Th activity ratios<0.5 and have not yielded resolvable U–Th ages.
We measured U and Th isotopes on a sample from the top of the actively forming stalagmite in order to assess a reliable correction factor. The results show a 238U concen-tration of 18.3±0.1 ng g−1 and a 232Th concentration of 12.2±0.1 ng g−1. The measured230Th in the top sample is assumed to be entirely of detrital origin and the apparent age of 8.3 ka a result of initial thorium contamination. The 230Th/232Th activity ratio of this sample is 0.6±0.05, which indicates detrital activity ratios for230Th/232Th,234U/232Th and238U/232Th of 0.6±0.05, if we assume the detritus to be in secular equilibrium. We note that this factor is well within the range of the bulk earth value of 0.8±0.4 (Wedepohl, 1995). We therefore use the value of 0.6 with a conservative uncertainty of 50 % to correct for initial Th.
The growth model of stalagmite POM2 (Fig. 5) was generated using the StalAge algorithm of Scholz and Hoffmann (2011).
3.2 Cave monitoring results
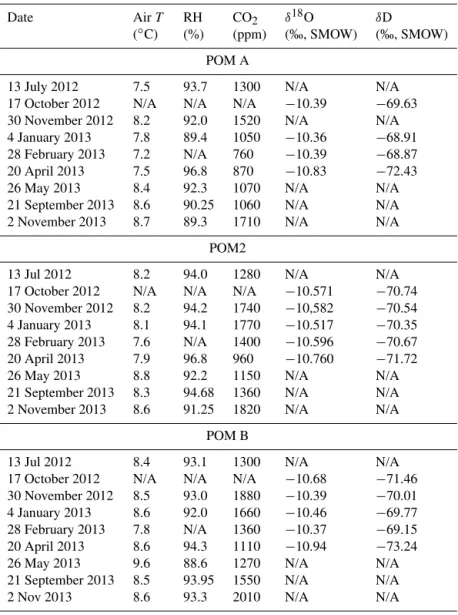
Monitoring data show a stable average temperature of 8.2±0.6◦C at the stalagmite site. Relative humidity is also stable around 94±2.5 % during the year, especially at sam-pling sites POM2 (where stalagmite POM2 was sampled) and POM B situated deeper inside the cave (Table 2).
Isotope measurements of drip waters at POM2 site show rather consistent values for both δ18O (−10.57±0.04 ‰) and δD (−70.58±0.20 ‰), during the autumn–winter months. This may indicate an efficient mixing of waters in the aquifer, without capturing any individual rain events.
Analysis of calcite farmed on glass plates also revealed rel-atively constant values with meanδ13C of−10.30±0.8 ‰ andδ18O of−7.91±0.2 ‰ for both POM2 and an adjacent stalagmite, POM X (Table 3).
Table 2.Spot measurements of physical climate parameters in Ascuns˘a Cave, including water stable isotopes.
Date AirT RH CO2 δ18O δD
(◦C) (%) (ppm) (‰, SMOW) (‰, SMOW)
POM A
13 July 2012 7.5 93.7 1300 N/A N/A 17 October 2012 N/A N/A N/A −10.39 −69.63 30 November 2012 8.2 92.0 1520 N/A N/A 4 January 2013 7.8 89.4 1050 −10.36 −68.91 28 February 2013 7.2 N/A 760 −10.39 −68.87 20 April 2013 7.5 96.8 870 −10.83 −72.43 26 May 2013 8.4 92.3 1070 N/A N/A 21 September 2013 8.6 90.25 1060 N/A N/A 2 November 2013 8.7 89.3 1710 N/A N/A
POM2
13 Jul 2012 8.2 94.0 1280 N/A N/A 17 October 2012 N/A N/A N/A −10.571 −70.74 30 November 2012 8.2 94.2 1740 −10,582 −70.54 4 January 2013 8.1 94.1 1770 −10.517 −70.35 28 February 2013 7.6 N/A 1400 −10.596 −70.67 20 April 2013 7.9 96.8 960 −10.760 −71.72 26 May 2013 8.8 92.2 1150 N/A N/A 21 September 2013 8.3 94.68 1360 N/A N/A 2 November 2013 8.6 91.25 1820 N/A N/A
POM B
13 Jul 2012 8.4 93.1 1300 N/A N/A 17 October 2012 N/A N/A N/A −10.68 −71.46 30 November 2012 8.5 93.0 1880 −10.39 −70.01 4 January 2013 8.6 92.0 1660 −10.46 −69.77 28 February 2013 7.8 N/A 1360 −10.37 −69.15 20 April 2013 8.6 94.3 1110 −10.94 −73.24 26 May 2013 9.6 88.6 1270 N/A N/A 21 September 2013 8.5 93.95 1550 N/A N/A 2 Nov 2013 8.6 93.3 2010 N/A N/A
To test the existence of equilibrium fractionation condi-tions at the POM2 site, we used drip water δ18O values to calculate a theoretical δ18O value of the farmed calcite, us-ing the equation given by Tremaine et al. (2011):
1000 lnα=16.1(±0.65)×103T−1−24.6(±2.2).
The resulting value of−8.5±0.1 ‰ is slightly below the av-erage of−7.9 ‰ measured on calcite farmed at POM2 and POM X sites. The 0.6 ‰ offset from generally predicted val-ues could indicate some kinetic fractionation. However, the average drip water value derived from point-sampling in time may not exactly represent the annual amount-weighted aver-age rainfall and its isotopic composition. As such, calcite pre-cipitation may still be considered to have taken place close to equilibrium during the monitored period. The offset is some-what larger when the calibration of Kim and O’Neill (1997) or Day and Henderson (2011) are used (−9.2 ‰ and−9.6 ‰, respectively). In this study, we base our calculations on the
empirical equation of Tremaine et al. (2011), which appears to better characterise conditions in Ascuns˘a Cave.
3.3 Speleothem records
3.3.1 Theδ18O record in Romanian speleothems
Figure 6. Comparison between global meteoric water lines (GMWL; Craig, 1961) and Mediterranean meteoric water lines (MMWL; Gat and Carmi, 1970), as well as Ascuns˘a Cave ground-water line.
longitude at low altitudes (Fig. 8a). The general trends of measured values agree to a variable degree with modelled Rayleigh distillation of Atlantic air masses at low altitude (McDermott et al., 2011). A somewhat more negative mea-suredδ18O overall at Ascuns˘a Cave (Fig. 8b) could reflect the higher altitude of the cave and higher rainout on route lead-ing to increaslead-ingly lowerδ18O in the moisture arriving at the cave site, but the observed trend may not be explained com-pletely by this model. Poleva Cave shows slightly higher cal-citeδ18O values after 4 ka (−7.6 ‰) in comparison to>6 ka (−8.3 ‰ ) and Constantin et al. (2007) interpret this increase as a general warming trend. At Ur¸silor Cave (NW Romania), late Holoceneδ18O values are slightly higher (by 0.2 ‰) than during the middle Holocene and Onac et al. (2002) suggests that an apparent lack of variability at this site reflects rela-tively stable climate conditions.
Well-known rapid climate change events (Mayewski et al., 2004) such as the 8.2 ka event are not always clearly ex-pressed in Romanian speleothemδ18O records (Onac et al., 2002; T˘ama¸s et al., 2005; Constantin et al., 2007). This ab-sence in the speleothem δ18O record is in contrast to re-ports from the marine records from the eastern Mediter-ranean (Rohling et al., 2002), and lacustrine records from the wider Balkan region (Feurdean et al., 2008, Pross et al., 2009). An exception is a common negative excursion occur-ring at ∼3.2 ka that is recorded in the δ18O time series of Ascuns˘a and Poleva caves in the Southern Carpathians. This century-long cold event has been identified in marine records
Table 3.Stable isotope values of farmed calcite in Ascuns˘a Cave.
Sample δ13C δ18O
POM A Sep 2010–Jan 2011 −10.657 −8.264 POM A Jan 2011–Jul 2012 −9.455 −7.510 POM A Jul 2012–Oct 2012 −9.485 −7.826
POM2 Jan 2011–Jul 2012 −10.403 −7.550 POM2 Jul 2012–Oct 2012 −10.369 −7.844 POM2 Dec 2012– Jan 2013 −10.434 −7.964 POM2 Jan 2013–Apr 2013 −11.129 −8. 097
POM X Sep 2010–Jan 2011 −9.801 −8.312 POM X Jan 2011–Jul 2012 −10.427 −7.877 POM X Jul 2012–Oct 2012 −9.594 −7.780 POM X Oct 2012–Dec 2012 −10.234 −7.912 POM X Dec 2012–Feb 2013 −10.009 −7.869 POM X Feb 2013–Apr 2013 −10.360 −7.915
from the eastern Mediterranean (Rohling et al., 2002) and in lacustrine records from the Balkan region (Feurdean et al., 2008).
3.3.2 Constraining regional temperature change in the speleothemδ18O record with independent
temperature reconstructions
Stable oxygen isotopes in individual speleothems are po-tentially influenced by local effects, such as cave hydrol-ogy and cave ventilation, which may obscure the regional climate signal (Tremaine et al., 2011; Riechelmann et al., 2013). Here, we employ coeval data recorded in more than one cave to account for such potential biases. We specifi-cally address the three features reported above: (1) the gen-eral mid-Holocene trend by comparing the isotopic differ-ence between 2000 years averaged time intervals between the early and late Holocene, from 8–6 ka and 4–2 ka, respectively (Fig. 8a); (2) the absence of an unambiguous 8.2 ka event in isotopic speleothem records from Romania, and (3) the na-ture of a clear isotope excursion ∼3.2 ka in two Southern Carpathian speleothems.
Figure 7.δ18O andδ13C profiles of stalagmite POM2 with nine-point smoothed values (black).
Table 2) and (2) the coldest and warmest months define the range of temperature-controlled oxygen isotope fractionation during condensation of rain, one may calculate an expected range for relative changes in speleothemδ18O based entirely on temperature variation. To do this, we employ pollen-based temperature reconstructions of the annual average surface air temperature (TANN – Temperature ANNual), surface air temperature of the coldest month (MTCO – Mean Temper-ature of the COldest month), and surface air temperTemper-ature of the warmest month (MTWA – Mean Temperature of the WArmest month) for two zonal sectors from central Europe and the Mediterranean, respectively (Davis et al., 2003), to derive a pollen temperature-constrained range of expected δ18O change (1δ18Oc_ptc).
In this calculation, we use the empirical equation of Tremaine et al. (2011) for temperature-dependent oxygen isotope fractionation during calcite precipitation:
1000 lnα=16.1(103T−1)−24.6. (1) For theδ18O–temperature relationship in rainwater we use the empirical global mid-latitude relationship suggested by Rozanski et al. (1993):
δ18Ow/1T =0.58‰◦C−1. (2)
For calcite precipitation, 1δ18Oc/1T is∼ −0.18 ‰◦C−1 (Tremaine et al., 2011). Therefore, the combined effect of temperature change in speleothem calcite (1δ18Oc_spel) is dominated by rainfall temperature change and result-ing changes in drip waterδ18Ow(1δ18Oc≈ −1/31δ18Ow). Sources of error in this approach are discussed along with the details of calculation in the Appendix. We compare the cal-culated temperature-constrained range of relativeδ18O varia-tion – the range of1δ18Oc_ptc– with1δ18Oc_spelobserved in
Table 4.Regional pollen data sets (after Davis et al., 2003) and from Steregoiu (Feurdean et al., 2008) used for the calculation of the temperature effect on speleothem isotopic values between 6 and 4 ka. Steregoiu data were converted to temperature anomalies with respect to the latest 100 years.
Pollen region Average TA Average TA 1TA 8–6 ka 4–2 ka 6–4 ka
TANN CW Europe −0.26 −0.08 0.18 TANN SE Europe −0.51 0.04 0.56 TANN CE Europe 1.29 1.02 −0.27 TANN SW Europe −2.03 −0.82 1.21 TANN Steregoiu 0.00 0.60 0.59 MTWA CW Europe 0.32 0.18 −0.14 MTWA SE Europe −0.88 −0.41 0.47 MTWA CE Europe 0.36 0.10 −0.26 MTWA SW Europe −1.72 −0.67 1.05 MTWA Steregoiu 0.45 1.35 0.91 MTCO CW Europe −0.49 0.37 0.87 MTCO SE Europe 0.20 0.31 0.11 MTCO CE Europe 0.29 0.12 −0.16 MTCO SW Europe −1.51 −0.38 1.13 MTCO Steregoiu −0.90 −0.58 0.32
several Romanian speleothem records in order to identify the likelihood of additional changes in other climate–hydrology related parameters (e.g. rainfall seasonality, evaporation from the soil, or variable moisture sources and pathways).
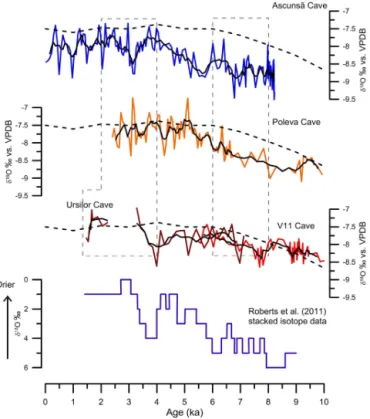
Figure 8a.Comparison betweenδ18O records from Ascuns˘a, Pol-eva, Ur¸silor and V11 caves. Isotopic values from a Rayleigh dis-tillation model (McDermott et al., 2011) for low-altitude caves at 22◦E longitude are represented as dashed line. Stacked ISOMED lacustrineδ18O for Mediterranean lakes after Roberts et al. (2008). Dashed-line boxes represent the time windows (4–2 and 8–6 ka) used in the calculation (see text).
further add to the distance of1δ18Oc_spelfrom the range of 1δ18Oc_ptc.
3.3.3 Temperature and hydrology-related changes in speleothemδ18O records from Romania and the Mediterranean basin
We analyse the broadδ18O change across the time interval 6–4 ka as outlined above for the Romanian stalagmites and also for a selection of southern European records (Fig. 9). The pollen-based temperature reconstruction by Davis et al. (2003) divides Europe into six main regions: northwest-ern (NW), northeastnorthwest-ern (NE), westnorthwest-ern (CW), central-eastern (CE), southwestern (SW) and southcentral-eastern (SE). The boundary between central and southern zones is 45◦N, the
boundary between western and eastern zones is 15◦E. This
places the Alps and much of northern Italy inside the CW zone and divides Romania between the CE and SE zone along the Southern Carpathians. Across the last 8000 years the CW shows a slight winter warming, the CE zone shows only little change, the SW zone shows a 2◦C warming trend for both seasons, and the SE zone shows a 1◦C warming dur-ing summer (Davis et al., 2003). The specific regionally
aver-Figure 8b.Stack ofδ18O records from Ascuns˘a, Poleva, Ur¸silor and V11 caves. Isotopic values from a Rayleigh distillation model (McDermott et al., 2011) for low-altitude caves at 22◦E longitude are represented as dashed line.
aged pollen data sets used to calculate isotopic variability in different cave records are summarised in Table 4 and calcu-lation details are given in Table 5. Potential shortcomings of the chosen pollen zones are also discussed in the Appendix.
For Ascuns˘a Cave, which is inside the SE pollen zone of Davis et al. (2003), speleothem 1δ18O6−4 ka is 0.69 ‰, whereas values expected from the pollen-based temper-ature reconstruction are between 0.16 ‰ (summer) and
−0.05 ‰ (winter) (Fig. 9). This implies that across the middle Holocene transition speleothem δ18O values at the cave site became higher than expected if only temperature change occurred. Asδ18O increases in the majority of ob-served speleothems from the eastern Mediterranean domain across the 6–4 ka interval beyond the temperature-controlled amount (Fig. 9), there must have been a common large-scale change of climate–hydrology. This may include a combi-nation of change in rainfall seasonality with any other hy-drological factor, such as local evaporation, a change in the proportion of Atlantic vs. Mediterranean moisture source (Rozanski et al., 1993), or a change in the isotopic compo-sition of the two vapour sources.
To rule out local climate effects, we compare our speleothem record with other isotope records from Poleva (Constantin et al., 2006) and Ur¸silor (Onac et al., 2002) caves. Considering that the Davis et al. (2003) CE pollen zone is not well represented around 45◦N latitude in
Table 5.Speleothem isotope data and calculation results of temperature-constrained speleothem isotope values for the mid-Holocene transi-tion.
Site δ−18O
c_spel δ−18Oc_spel 1δ18Oc_spel Cave TANN 1δ18Oct MTWA MTCO 1δ18Ow−summer 1δ18Ow−winter 1δ18Oc_pct 1δ18Oc_pct
8–6 ka 4–2 ka 6–4 ka T◦C 1TA 6–4 ka 1TA 1TA 6–4 ka 6–4 ka 6–4 ka summer 6–4 ka winter
(VPDB) (VPDB) (VPDB) 6–4 ka (VSMOW) 6–4 ka 6–4 ka (VSMOW) (VSMOW) (VPDB) (VPDB)
Ursilor −7.80 −7.60 0.20 10.0 0.59 −0.12 0.91 0.32 0.53 0.19 0.39 0.07 Ursilor+V11 −8.00 −7.60 0.40 − 0.59 −0.12 0.91 0.32 0.53 0.19 0.39 0.07 Ascunsa −8.65 −7.96 0.69 8.0 0.56 −0.11 0.47 0.11 0.27 0.07 0.16 −0.05 Poleva −8.25 −7.62 0.63 10.0 0.56 −0.11 0.47 0.11 0.27 0.07 0.16 −0.04 Sofular −8.53 −8.12 0.41 13.3 0.56 −0.11 0.47 0.11 0.27 0.07 0.16 −0.04 Soreq −5.91 −5.40 0.51 18.0 0.56 −0.11 0.47 0.11 0.27 0.07 0.16 −0.04 Jeita −5.40 −4.76 0.64 22.0 0.56 −0.10 0.47 0.11 0.27 0.07 0.17 −0.04 Renella −3.96 −3.94 0.02 12.0 0.18 −0.04 −0.14 0.87 −0.08 0.50 −0.11 0.45 Clamouse −4.92 −4.56 0.36 14.5 1.21 −0.24 1.05 1.13 0.61 0.65 0.36 0.40 Spannagel −7.81 −7.64 0.17 1.9 0.18 −0.04 −0.14 0.87 −0.08 0.50 −0.11 0.45
Figure 9. Comparison of isotopic changes in stalagmites across different longitudes in Europe in the interval 6–4 ka,1δ18Oc_spel, with pollen temperature-constrained range of1δ18Oc_pct(summer and winter) calculated by using data from Davis et al. (2003) and Feurdean et al. (2008). For Ur¸silor Cave, two options are shown: (I)1δ18O6−4 kabased on the Ur¸silor data alone, (II)1δ18O6−4 ka based on the combination of Ur¸silor and V-11 isotope data.
towards lower values in comparison to Ur¸silor (V-11 is at 1254 m, Ur¸silor is at 486 m). Altogether, the data suggest that the 6–4 ka transition at Ascuns˘a and Poleva in the Southern Carpathians marks a significant hydrologic change in south-ern Romania that is not obvious in the Apuseni Mountains of NW Romania. A similar gradient in the expression of Holocene climate change can also be found in other parts of Europe at these latitudes (see review in Magny et al., 2013).
To verify a suspected large-scale gradient in the nature of climate change across Southern Europe, we calculated similar pollen temperature-constrainedδ18O values for sev-eral cave records around the Mediterranean, across the same 6–4 ka transition. These records are: Grotte de Clamouse, France (McDermott et al., 1999), in combination with the Davis et al. (2003) SW European temperature time series; Buca della Renella, Italy (Drysdale et al., 2006) and
Span-nagel Cave, Austria (Vollweiler et al., 2006), each in combi-nation with the Davis et al. (2003) CW European tempera-ture time series; and finally Sofular Cave, Turkey (Fleitmann et al., 2009), Soreq Cave, Israel (Bar-Matthews et al., 2003) and Jeita Cave, Lebanon (Verheyden et al., 2008), each in combination with the Davis et al. (2003) SE European tem-perature time series. The pollen reconstructions show rising temperatures throughout the year for the SW zone (Davis et al., 2003), whereas in the CW zone, increasing winter tem-peratures offset decreasing summer temtem-peratures. The results are also shown in Fig. 9. It is apparent that isotope values from the western Mediterranean (Clamouse) and CW Eu-rope south of the Alpine divide (Renella and Spannagel) show a change inδ18O that is explained almost entirely by pollen-constrained temperature change. Only at the Renella site, could a small hydrologic influence be argued for, as the observed change is close to the summer end of the range (Fig. 9). This likely represents a shift towards the present-day rainfall domination by the winter season (Scholz et al., 2012). On the other hand, sites in Turkey (Sofular), Israel (Soreq), Lebanon (Jeita) and southern Romania (Poleva and Ascuns˘a) that are potentially influenced by the eastern Mediterranean plot well above the temperature-constrained change. Thus, it appears that across the middle Holocene transition, the entire eastern Mediterranean domain including the South-ern Carpathians underwent a significant moisture-balance change in addition to some temperature change, whereas in the western Mediterranean and the southern Alps such change in climate–hydrology is not apparent.
vir-Figure 10. Comparison of isotopic changes in speleothems (1δ18Oc_spel)for the 8.2 ka event (left) and 3.2 ka event (right) in stalagmites from Ascuns˘a and V11 caves with pollen temperature-constrained range of1δ18Oc_pct(summer and winter) calculated by using data from Steregoiu peat bog (Feurdean et al., 2008 and Lake Maliq (Bordon et al., 2009).
tually no rainfall during summer in the Levant, and rainfall is significantly reduced over SE Europe. Precipitation is at a minimum in August in SW Romania (Fig. 2). Subsidence and accompanying low humidity over the eastern Mediter-ranean may, however, have increased evaporation from the soil, which would be in agreement with rising summer tem-peratures in SE Europe across the Holocene (Davis et al., 2003). Evaporation in the soil and epikarst drives drip water δ18O towards more positive values, resulting in higherδ18O in speleothem calcite (Bar-Matthews et al., 1996; Fairchild et al., 2006). A measurable effect of evaporation at Ascuns˘a may be implied from the slope of the local drip water line (see Sect. 3.2).
Alternatively, the proportion of summer rain could have been higher just because winter rainfall decreased. McDer-mott et al. (2011) suggested lower rainout efficiency dur-ing winter along a west–east transect across central Europe. However, higher winter temperatures were only observed in the western Mediterranean region (Davis et al., 2003, SW Europe quadrant). This would increase the temperature gra-dient between SW Romania and the source of cyclones in the Gulf of Genoa – which is inside the SW Europe quad-rant – possibly increasing rainout efficiency in South Europe. An interesting analysis of synoptic-scale mid-tropospheric (500 mbar) pressure distribution of exceptionally wet win-ters in the Levant points to a possible physical mechanism causing the climate changes discussed above (Enzel et al. 2004). Such years coincide with a large-scale negative pres-sure anomaly centred over Asia Minor and the Middle East that encompasses all the eastern Mediterranean speleothem sites discussed above. Scenarios (1) enhanced summer evap-oration and (2) reduced winter rainfall notably do not exclude each other.
The third factor that may have added to the observed in-crease in speleothemδ18O is a change in the isotopic com-position of the Mediterranean mixed layer. A steady increase inδ18O by approximately 0.7 ‰ was derived fromδ18O in
tests of surface dwelling foraminifera and an independent sea surface temperature estimate for the Aegean Sea between 8 and 4 ka BP, which is uncorrelated with the abundance of cold water species (Marino et al., 2009). In the Adriatic Sea, an increase by 0.5 ‰ was recorded inδ18O of foraminifera at the same time (Siani et al., 2010). As such, a combina-tion of warmer summer temperatures, enhanced evaporacombina-tion from the soil, and higherδ18O of the eastern Mediterranean moisture source are currently the favoured explanation for the observed increase inδ18O of speleothems across the mid-Holocene from the eastern Mediterranean domain.
3.3.4 Theδ13C record
Interpretation of speleothemδ13C data (Fig. 7) is generally hampered by a host of local factors such as changes in soil CO2production and content, closed versus open system dis-solution of carbonates in the soil/epikarst system, residence time and mixing of waters along the pathway to the drip point, or solution degassing (Hendy, 1971; Bar-Matthews et al., 1996; Fairchild et al., 2006).
Percolating water degassing could be greater during cer-tain periods at POM2 sampling site, as the CO2 content of the cave’s atmosphere drops from∼1800 ppm in November– December to∼1000 ppm in April–May. This seasonal vari-ation in the CO2content of cave air is likely the combined result of soil CO2productivity and cave ventilation (Spötl et al., 2005, Kowalczk and Froelich, 2010; Frisia et al., 2011; Tremaine et al., 2011; Riechelmann et al., 2013).
At the POM A site, which is the shallowest and closest to the entrance, the CO2 concentration reaches a minimum value of 760 ppm, well above values of outside air (between 200 and 310 ppm). The two deeper sites, POM2 and POM B, show even less ventilation, with minimal values of 960 ppm. This indicates that cave ventilation is moderate (although continuous) at Ascuns˘a Cave.
Supposing that the cave ventilation regime remained un-changed during the middle Holocene, cave air CO2was prob-ably controlled mostly by soil/vegetation dynamics. If so, higher speleothemδ13C values are indicative of reduced CO2 input from the soil and/or prior precipitated calcite (Fairchild et al., 2000). These two processes could be the result of drier conditions being established across the mid-Holocene and might have been responsible for producing the upward trend observed inδ13C values between 6 and 4 ka BP.
3.3.5 The 8.2 ka and 3.2 ka events
(Bar-Matthews et al., 2000) and marine faunal composition from the Aegean Sea (Rohling et al., 2002) document a decrease in winter temperature and precipitation, while summer condi-tions remained rather stable. Similar to other Romanian sta-lagmites (T˘ama¸s et al., 2005; Constantin et al., 2007), the POM2δ18O andδ13C records do not show significant vari-ability across the 8.2 ka event. The only indication of chang-ing environmental conditions is that the growth rate was six times higher during this event compared to the rest of the Holocene in the Ascuns˘a Cave.
Figure 10 shows a comparison of calculated 1δ18Oc_ptc measured 1δ18Oc_spel values for the 8.2 and 3.2 ka events. For the 8.2 ka event, 1δ18Oc_ptc is calculated as the dif-ference between a 500-year interval succeeding the event (8.1–7.6 ka) and the event itself (8.3–8.1 ka). Here we used pollen-based temperature reconstructions as follows: for V11 Cave, those from the Steregoiu peat bog in northern Roma-nia (Feurdean et al., 2008), and for Ascuns˘a Cave, the Lake Maliq in Macedonia (Bordon et al., 2009).
The shift in isotopic values after the 8.2 ka event at V-11 and Ascuns˘a Cave is well explained by the pollen-based tem-perature rise (Feurdean et al., 2008; Bordon et al., 2009). The pollen data suggest a significant warming in winter and very slight cooling in summer after the 8.2 ka cold event. Lake Maliq suggests a strong warming in winter and a lesser warming in summer after the event.1δ18Oc_spel gen-erally agrees with calculated 1δ18Oc_pct Nevertheless, as 1δ18Oc_spel from Ascuns˘a falls closer to the summer end of 1δ18Oc_ptc, a climate-related hydrological influence on the speleothem data could be argued for. A 1δ18Oc_spel close to the low-δ18O summer end of the calculated range of 1δ18Oc_ptcmay be interpreted as a slight increase in the proportion of winter rain after the 8.2 ka event. Lower winter rainfall during the 8.2 ka event is in agreement with precipita-tion reconstrucprecipita-tion from Lake Maliq and Steregoiu (Bordon et al., 2009; Feurdean et al., 2008), but the speleothem data would only support a small reduction of winter rain during the 8.2 ka event. However, a high speleothem precipitation rate during the 8.2 ka event may suggest a high infiltration rate and more rain. The apparent high infiltration rate of drip water could mean that instead of a reduction in winter rain, summer rainfall increased during the 8.2 ka event.
The 0.4 ‰ increase inδ18O values in the Ascuns˘a record between the average of periods 3.2–2.9 ka and 2.9–2.5 ka de-fines the 3.2 ka event. Both Ascuns˘a and Poleva (Constantin et al., 2007) show a comparable signal, although with a small difference in chronology. This difference in timing is still within chronological uncertainty. The magnitude of ris-ing δ18O values in both speleothems after the event is out-side the pollen-defined expected range of1δ18Oc_ptcdue to temperature change. Thus, the event likely reflects a change also related to climate–hydrology. The interval coincides with events documented in both archaeological and palaeo-climate records around the eastern Mediterranean (see re-view in Drake, 2012) that may have led to cultural demise
at the end of the late Bronze Age. Associated with this cold event is a decrease of the Aegean Sea winter surface tem-peratures, as documented by Rohling et al. (2002). Changes in climate–hydrology are reflected by drought in Cyprus and Syria (Kaniewski et al., 2010, 2013), and a drop of the Dead Sea level (Migowski et al., 2006). In northern Romania, tes-tate amoebae data also indicate a dry phase between 3.4 and 3.0 ka (Schnitchen et al., 2006).
The calculated range of 1δ18Oc_ptc (2.9–2.5 ka to 3.2– 2.9 ka) using pollen reconstructed temperatures from Lake Maliq (Bordon et al., 2009) is from −0.13 ‰ for the cold season (reflecting a slight cooling after the event) to 0.27 ‰ for summer season (reflecting a warming). The1δ18Oc_spel from Ascuns˘a Cave is 0.4‰ . This offset (0.13‰ with respect to the upper margin of1δ18Oc_ptc) indicates that changes related to climate–hydrology contributed significantly to the speleothemδ18O signal. In this case the isotopic evolution out of the 3.2 ka event suggests an increase in summer rain-fall or a reduction in winter rain after the 3.2 ka event. The event itself would consequently be characterised by either lower summer rainfall or higher winter rainfall. Higher win-ter rainfall is not in agreement with widespread drought in the winter rain-dominated eastern Mediterranean. The Mediterranean plays an important role as winter moisture source for southwestern Romania (Bojariu and Paliu, 2001). Consequently, a change in moisture source composition of Mediterranean-derived rainfall could potentially have con-tributed, but is not observable in Mediterranean foraminifera records (Rohling et al., 2002; Siani et al., 2010). It seems that pollen data from Lake Maliq and marine records from the Mediterranean are not in agreement concerning the timing of temperature change, perhaps due to chronological uncer-tainty. We note that significant winter cooling is apparent in the abundance record of planktic foraminifera species in the Aegean Sea (Rohling et al., 2002), whereas the Lake Maliq pollen record shows a winter cooling centred between 2.9 and 2.8 ka. Aligning Lake Maliq with the marine chronology would change the sign of1δ18Oc_spel and1δ18Oc_pct, and the interpretation would be a winter drought for the 3.2 ka event. As such, a change in climate–hydrology is evident for the 3.2 ka event, but cannot currently be defined given chronological uncertainty. However, there is clear evidence for coincidence of a climate event which includes a hydro-logic component with a time interval of significant cultural change.
4 Conclusions
temperatures as documented by pollen assemblages (Davis et al., 2003), but also a combination of influences related to changes in climate–hydrology. The approach presented in this study relies on using pollen-based temperature recon-structions to constrain temperature-driven isotopic changes of speleothem calcite. This method considers isotope frac-tionation occurring during water vapour condensation and calcite precipitation. A constrained range of temperature-driven isotopic changes between winter and summer is obtained, and the deviation of measured data from this range suggests that additional climate–hydrology factors contributed to isotopic variability over the studied period.
Between 6 and 4 ka,δ18O gradually shifted towards higher values in a variety of speleothems across the Mediterranean. Using this approach we find that the middle Holocene en-richment in SW Romania was 0.5–0.6 ‰ greater than val-ues attributable to rising temperatures. A similar situation persists throughout the eastern Mediterranean domain. In the Atlantic-dominated western Romania, as in all parts of the western Mediterranean domain analysed here, changes in δ18O of speleothems largely reflect temperature varia-tions. This reveals a different climate response between the two regions. In the eastern Mediterranean, a combination of higher summer temperatures, enhanced evaporation from the soil and a higherδ18O of the Mediterranean surface wa-ter may plausibly explain the observed evolution ofδ18O in speleothems across the mid-Holocene.
Appendix A: Calculation method of temperature constrained isotope values
The calculation of the temperature-related part of an ob-served change in speleothem calciteδ18O from pollen-based temperature reconstructions relies on two basic assumptions: (1) the cave temperature reflects the annual average surface air temperature and only fluctuates very little around that value (i.e. temperatures in the Ascuns˘a Cave chamber from which the POM2 stalagmite was collected vary by 0.6◦C over the year); (2) the coldest and warmest month reason-ably define the range of temperature-controlled oxygen iso-tope fractionation during rainfall. This cannot be currently tested for the Ascuns˘a Cave site due to lack of a continu-ously recording of stable isotopes in precipitation. However, this assumption is based on information from a large number of European station recordings (Rozanski et al., 1993). In the following, we only consider temperature-related aspects con-tributing to an observed isotopic change, 1δ18O. This has the advantage that accuracy of 1δ18O is determined only by the much less relevant difference of slopes between var-ious water–calcite calibration functions rather than the con-siderable offsets. For example, the difference in 1δ18Ofor a temperature change from 10 to 20◦C that would result from using the calibration functions by Kim et al. (2007) and Tremaine et al. (2011), respectively, is only 0.22 ‰, whereas the difference in absoluteδ18O values is 0.75 ‰ for 10◦C
and 0.97 ‰ for 20◦C between the two calibration functions.
Generally, δ18O in calcite (δ18Oc) is determined by the calcification temperature and the isotopic composition of ambient water (Epstein et al., 1953), the latter reflecting rain formation temperature among other hydrologic fac-tors (Rozanski et al., 1993). Consequently, the temperature-related 1δ18Oc can be broken down into 1δ18Oct – the
contribution due to changing calcification temperature in the cave – and1δ18Ow– the contribution due to changing rain-fall temperature. The relative change ofδ18O between two time intervals,t1 andt2, in a speleothem is
1δ18Oc(t1−t2)=1δ18Oct(t1−t2)+1δ18Ow(t1−t2) (A1)
=δ18Oc(t1)−δ18Oc(t2).
Likewise, the change in pollen temperature anomaly (Davis et al., 2003) is
1TApollent1−t2=TApollent1 −TApollent2 . (A2) The absolute pollen-derived temperature at any given timet is
Ttpollen=Ttoday+TApollent . (A3)
The empirically determined fractionation factorαfor oxy-gen isotopes between water and calcite in speleothems is de-fined as (Tremaine et al., 2011)
1000 lnα=16.1(103T−1)−24.6. (A4) The fractionation factor is related to measured values for δ18Ocandδ18Owby (e.g. Sharp, 2007)
1000 ln(α)≈δ18Oc−δ18Ow, (A5) where we express both δ18O values in relation to SMOW. Consequently, the right-hand term in Eq. (A4) equalsδ18Oct
in the initial definition made for Eq. (A1). In the case of δ18Ow=0, Eq. (A5) reduces to
1000 ln(α)≈δ18Oc. (A6)
In this case,δ18Oc=δ18Oct. Although the approximation in
Eq. (A6) would deviate somewhat from the true relationship at the given 25–30 ‰ difference between the twoδ18O val-ues, most of the error cancels out when calculating
1δ18Oc(t1−t2)=δ18Oc(t1)−δ18Oc(t2). (A7)
From Eqs. (A3), (A4), (A6) and (A7) we have
1δ18Oc(t1−t2)=16.1
1 Ttpollen1
− 1
Ttpollen2 !
1000. (A8)
To constrain the range of temperature-related variability of δ18Ow we use the empirical relationship of 0.58 ‰ (δ18O) /◦C for mid-latitudes (Rozanski et al., 1993):
1δ18Ow(t1−t2)=0.58(‰◦C−1)1TAp −seasonal
t1−t2 (A9)
Appendix B: Sources of uncertainty of the calculation
The precision of the pollen-constrained temperature range can in principle be estimated by a full propagation of er-rors, but these are not generally available for pollen recon-structions. This uncertainty may generally be minimised by averaging reconstructions from many sites, like in Davis et al. (2003). Accuracy will depend on a number of aspects. One is the choice of calcite–water fractionation function (see above). In most cases, however, Holocene temperature changes in Europe rarely exceed 2◦C (Davis et al., 2003),
for which the inaccuracy on1δ18Oas a result of calibration function difference reduces to∼0.05 ‰ – which is below an-alytical precision forδ18Omeasurements in calcite. Results from Eq. (A9) will also be affected by spatial and tempo-ral variability of the 0.58 ‰ (δ18Ow)/◦C slope defined by
Acknowledgements. We wish to thank the authors who made their data available either upon request or by uploading them to online repositories. V. Dr˘agu¸sin acknowledges the financial support provided from programmes co-financed by the Sectoral Operational Programme Human Resources Development, Con-tract POSDRU 6/1.5/S/3 – “Doctoral studies: through science towards society”. V. Dr˘agu¸sin acknowledges CENIEH (Burgos, Spain) for hosting a research visit during 2010. V. Dr˘agu¸sin and D. Veres are grateful for the financial support received from the PCCE-IDEI 31/2008 grant “Karsthives – Climate Archives in Karst” (PI Silviu Constantin). V. Dr˘agu¸sin and M. Staubwasser acknowledge the financial support received from the Collaborative Research Centre 806 “Our Way to Europe” funded by the German Research Foundation. V. Ersek was supported by the European Commission under a Marie Curie Intra-European Fellowship for Career Development. D. Veres acknowledges the support by a grant of the Ministry of National Education, CNCS – UEFISCDI, project number PN-II-ID-PCE-2012-4-0530. F. Forray is thanked for running the stable isotopes analysis on drip water at the Lab-oratory of Geochemistry, Babet-Bolyai University (Cluj-Napoca, Romania). V. Dr˘agu¸sin wishes to thank Emilian Isverceanu and his family for the invaluable support during fieldwork in the study area. Also, M. Terente, G. Ruic˘a and M. Oprea are thanked for their help during field sampling and cave climate measurements.
Edited by: F. Schäbitz
References
Alley, R. B., Mayewski, P. A., Sowers, T., Stuiver, M., Taylor, K. C., and Clark, P. U.: Holocene climatic instability: A prominent, widespread event 8,200 years ago, Geology, 25, 483–486, 1997. Apostol, L.: The Mediterranean cyclones – the role in ensuring wa-ter resources and their potential of climatic risk, in the east of Romania, Present Environment and Sustainable Development, 2, 143–163, 2008.
Balt˘a, D. and Geicu, A.: Factorii dinamici ai atmosferei, In: Clima României, edited by: Sandu, I., Pescaru, V. I., Poian˘a, I., Editura Academiei Române, Bucure¸sti, 38–51, 2008.
Bar-Matthews, M., Ayalon, A., Matthews, A., Sass, E., and Hal-icz, L.: Carbon and oxygen isotope study of the active water-carbonate system in a karstic Mediterranean cave: Implications for paleoclimate research in semiarid regions, Geochim. Cos-mochim. Ac., 60, 337–347, 1996.
Bar-Matthews, M., Ayalon, A., and Kaufman, A.: Timing and hy-drological conditions of Sapropel events in the Eastern Mediter-ranean, as evident from speleothems, Soreq cave, Israel, Chem. Geol., 169, 145–156, 2000.
Bar-Matthews, M., Ayalon A., Gilmour M., Matthews A., and Hawkesworth C. J.: Sea-land oxygen isotopic relationships from planktonic foraminifera and speleothems in the Eastern Mediter-ranean region and their implication for paleorainfall during in-terglacial intervals, Geochim. Cosmochim. Ac., 67, 3181–3199, 2003.
Bojariu, R. and Paliu, D. M.: North Atlantic Oscillation projection on Romanian climate fluctuations in the cold season, In: De-tecting and Modelling Regional Climate Change and Associated Impacts, edited by: Brunet, M., and Lopez, D., Springer-Verlag, Berlin, Heidelberg, 345–356, 2001.
Bordon, A., Peyron, O., Lezine, A.-M., Brewer, S., and Fouache, E.: Pollen-inferred Late-Glacial and Holocene climate in southern Balkans (Lake Maliq), Quatern. Int., 200, 19–30, 2009. Brand, W. A., Geilmann, H., Crosson, E. R., and Rella, C. W.:
Cav-ity ring-down spectroscopy versus high-temperature conversion isotope ratio mass spectrometry; a case study onδ2H andδ18O of pure water samples and alcohol/water mixtures, Rapid Commun. Mass. Sp., 23, 1879–1884, 2009.
Craig, H.: Isotope variations in meteoric waters, Science, 133, 1702–1703, 1961.
Codarcea, A., R˘aileanu, G., N˘ast˘aseanu, S., Bercia, I., Bercia, E., and Bi¸sioanu, C.: Geological map of Romania, scale 1:200 000, L-34-XXIX, Baia de Aram˘a sheet, Institutul Geologic, Bu-cure¸sti, 1964.
Constantin, S., Bojar, A.-V., Lauritzen, S.-E., and Lundberg, J.: Holocene and Late Pleistocene climate in the sub-Mediterranean continental environment: A speleothem record from Poleva Cave Southern Carpathians, Romania, Palaeogeogr. Palaeocl., 243, 322–338, 2007.
Davis, B. A. S., Brewer, S., Stevenson, A., Guiot, J., and Data Con-tributors: The temperature of Europe during the Holocene recon-structed from pollen data, Quat. Sci. Rev., 22, 1701–1716, 2003. Day, C. and Henderson, G. M.: Oxygen isotopes in calcite grown under cave-analogue conditions, Geochim. Cosmochim. Ac., 75, 3956–3972, 2011.
Dragot˘a, C. and Baciu, M.: Cantit˘aiile medii lunare ¸si anuale de pre-cipita?ii (in Romanian), in: Clima României, edited by: Sandu, I., Pescaru, V. I., and Poian˘a, I., Editura Academiei Române, Bu-cureiti, 245–264, 2008.
Drake, B. L.: The influence of climatic change on the Late Bronze Age Collapse and the Greek Dark Ages, J. Archaeol. Sci., 39, 1862–1870, 2012.
Drysdale, R., Zanchetta, G., Hellstrom, J., Maas, R., Fallick, A., Pickett, M., Cartwright, I., and Piccini, L.: Late Holocene drought responsible for the collapse of Old World civilizations is recorded in an Italian cave flowstone, Geology, 34, 101–104, 2006.
Enzel, Y., Bookman, R. (Ken Tor), Sharon, D., Gvirtzman, H., Dayan, U., Ziv, B., and Stein, M.: Late Holocene climates of the Near East deduced from Dead Sea level variations and modern regional winter rainfall. Quat. Res., 60, 263–273, 2003. Epstein, S., Buchsbaum, R., Lowenstamm, H., and Urey, H. C.:
Revised carbonate-isotopic temperature scale, Bull. Geol. Soc. Am., 64, 1315–1326, 1953.
Fairchild, I. J., Smith, C. L., Baker, A., Fuller, L., Spötl, C., Mat-tey, D., McDermott, F., and E. I. M. F.: Modification and preser-vation of environmental signals in speleothems, Earth-Sci. Rev., 75, 105–153, 2006.
Feurdean, A., Klotz, S., Mosbrugger, V., and Wohlfarth, B.: Pollen-based quantitative reconstructions of Holocene climate variabil-ity in NW Romania, Palaeogeogr. Palaeocl., 260, 494–504, 2008. Fleitmann, D., Cheng, H., Badertscher, S., Edwards, R. L., Mudelsee, M., Göktürk, O. M., Frankhauser, A., Pickering, R., Raible, C. C., Matter, A., Kramers, J., and Tüysüz, O.: Timing and climatic impact of Greenland interstadials recorded in sta-lagmites from northern Turkey, Geophys. Res. Lett., 36, L19707, doi:10.1029/2009GL040050, 2009.
isotope exchange processes in dynamic caves, Geochim. Cos-mochim. Ac., 75, 380–400, 2011.
Frogley, R. M., Griffiths, I. H., and Heaton, H. E. T.: Historical bio-geography and Late Quat. environmental change of Lake Pamvo-tis, Ioannina (north-western Greece): evidence from ostracods, J. Biogeogr., 28, 745–756, 2001.
Gat, J. and Carmi, I.: Evolution of the isotopic composition of atmo-spheric waters in the Mediterranean Sea area, J. Geophys. Res., 75, 3039–3048, 1970.
Hendy, C. H.: The isotopic geochemistry of speleothems I. The cal-culation of the effects of different modes of formation on the isotopic composition of speleothems and their applicability as palaeoclimatic indicators, Geochim. Cosmochim. Ac., 35, 801– 824, 1971.
Hoffmann, D. L.:230Th isotope measurements of femtogram quan-tities for U-series dating using multi ion counting MIC MC-ICPMS, Int. J. Mass. Spectrom., 275, 75–79, 2008.
Hoffmann, D. L., Prytulak, J., Richards, D. A., Elliott, T., Coath, C. D., Smart, P. L., and Scholz, D.: Procedures for accurate U and Th isotope measurements by high precision MC-ICPMS, Int. J. Mass. Spectrom., 264, 97–109, 2007.
Kaniewski, D., Paulissen, E., Van Campo, E., Weiss, H., Otto, T., Bretschneider, J., and Van Lerberghe, K.: Late second–early first millennium BC abrupt climate changes in coastal Syria and their possible significance for the history of the Eastern Mediter-ranean, Quat. Res., 74, 207–215, 2010.
Kaniewski, D., Van Campo, E., Guiot, J., Le Burel, S., Otto, T., and Baeteman, C.: Environmental Roots of the Late Bronze Age Crisis, PLoS ONE 8, e71004, doi:10.1371/journal.pone.007100, 2013.
Kim S.-T. and O’Neil, J. R.: Equilibrium and nonequilibrium oxygen isotope effects in synthetic carbonates, Geochim. Cos-mochim. Ac., 61, 3461–3475, 1997.
Kowalczk, A. J. and Froelich, P. N.: Cave air ventilation and CO2 outgassing by radon-222 modeling: How fast do caves breathe?, Earth Planet. Sc. Lett., 289, 209–219, 2010.
Lachniet, M. S.: Climatic and environmental controls on speleothem oxygen-isotope values, Quat. Sci. Rev., 28, 412–432, 2009.
Leng, M. J., Baneschi, I., Zanchetta, G., Jex, C. N., Wagner, B., and Vogel, H.: Late Quat. palaeoenvironmental reconstruction from Lakes Ohrid and Prespa (Macedonia/Albania border) using sta-ble isotopes, Biogeosciences, 7, 3109–3122, doi:10.5194/bg-7-3109-2010, 2010.
Magny, M., Combourieu-Nebout, N., de Beaulieu, J. L., Bout-Roumazeilles, V., Colombaroli, D., Desprat, S., Francke, A., Joannin, S., Ortu, E., Peyron, O., Revel, M., Sadori, L., Siani, G., Sicre, M. A., Samartin, S., Simonneau, A., Tinner, W., Vannière, B., Wagner, B., Zanchetta, G., Anselmetti, F., Brugiapaglia, E., Chapron, E., Debret, M., Desmet, M., Didier, J., Essallami, L., Galop, D., Gilli, A., Haas, J. N., Kallel, N., Millet, L., Stock, A., Turon, J. L., and Wirth, S.: North–south palaeohydrological contrasts in the central Mediterranean during the Holocene: ten-tative synthesis and working hypotheses, Clim. Past, 9, 2043– 2071, 2013,
http://www.clim-past.net/9/2043/2013/.
Magyari, E., Buczkó, K., Jakab, G., Braun, M., Pál, Z., Karátson, D., and Pap, I.: Palaeolimnology of the last crater lake in the East-ern Carpathian Mountains: a multiproxy study of Holocene
hy-drological changes, Palaeolimnological Proxies as Tools of Envi-ronmental Reconstruction in Fresh Water, Develop. Hydrobiol., 208, 29–63, 2009.
Marino, G., Rohling, E. J., Sangiorgi, F., Hayes, A., Casford, J. L., Lotter, A. F., Kucera, M., and Brinkhuis, H.: Early and middle Holocene in the Aegean Sea: interplay between high and low latitude climate variability, Quat. Sci. Rev., 28, 3246–3262, 2009. Mayewski, P. A., Rohling, E., Stager, J. C., Karlén, W., Maasch, K. A., Meeker, L. D., Meyerson, E. A., Gasse, F., van Kreveld, S., Holmgren, K., Lee-Thorp, J., Rosqvist, G., Rack, F., Staub-wasser, M., Schneider, R. R., and Steig, E. J.: Holocene climate variability, Quat. Res., 62, 243–255, 2004.
McDermott, F., Frisia, S., Huang, Y., Longinelli, A., Spiro, B., Heaton, T. H. E., Hawkesworth, C. J., Borsato, A., Keppens, E., Fairchild, I. J., van der Borg, K., Verheyden, S., and Selmo, E.: Holocene climate variability in Europe: Evidence fromδ18O, textural and extension-rate variations in three speleothems, Quat. Sci. Rev., 18, 1021–1038, 1999.
McDermott, F.: Palaeo-climate reconstruction from stable isotope variations in speleothems: a review, Quat. Sci. Rev., 23, 901–918, 2004.
McDermott, F., Atkinson, T. C., Fairchild, I. J., Baldini, L. M., and Mattey, D. P.: A first evaluation of the spatial gradients inδ18O recorded by European Holocene speleothems, Global Planet. Change, 79, 275–287, 2011.
Migowski, C., Stein, M., Prasad, S., Negendank, J. F. W., and Agnon, A.: Holocene climate variability and cultural evolution in the Near East from the Dead Sea sedimentary record, Quat. Res., 66, 421–431, 2006.
Onac, B. P., Constantin, S., Lundberg, J., and Lauritzen S.-E.: Iso-topic climate record in a Holocene stalagmite from Ur¸silor Cave Romania, J. Quat. Sci., 17, 319-327, 2002.
Panagiotopoulos, K., Aufgebauer, A., Schäbitz, F., and Wagner, B.: Vegetation and climate history of the Lake Prespa region since the Lateglacia, Quatern. Int., 293, 157–169, 2013.
Pross, J., Kotthoff, U., Müller, U. C., Peyron, O., Dormoy, I., Schmiedl, G., Kalaitzidis, S., and Smith, A. M.: Massive per-turbation in terrestrial ecosystems of the Eastern Mediterranean region associated with the 8.2 kyr B. P. climatic event, Geology, 37, 887–890, 2009.
Riechelmann, D. F. C., Deininger, M., Scholz, D., Riechelmann, S., Schröder-Ritzrau, A., Spötl, C., Richter, D. K., Mangini, A., and Immenhauser, A.: Disequilibrium carbon and oxygen isotope fractionation in recent cave calcite: Comparison of cave precipi-tates and model data, Geochim. Cosmochim. Ac. 103, 232–244, 2013.
Roberts, N., Jones, M. D., Benkaddour, A., Eastwood, W. J., Fil-ippi, M. L., Frogley, M. R., Lamb, H. F., Leng, M. J., Reed, J. M., Stein, M., Stevens, L., Valero-Garcés, B., and Zanchetta, G.: Stable isotope records of Late Quat. climate and hydrology from Mediterranean lakes: the ISOMED synthesis, Quat. Sci. Rev., 27, 2426–2441, 2008.
Roberts, N., Eastwood, W. J., Kuzucuo˘glu, C., Fiorentino, G., and Caracuta V.: Climatic, vegetation and cultural change in the east-ern Mediterranean during the mid-Holocene environmental tran-sition, Holocene, 21, 147–162, 2011.
Rohling, E. J. and Pälike, H.: Centennial-scale climate cooling with a sudden cold event around 8,200 years ago, Nature, 434, 975– 979, 2005.
Rohling, E. J., Mayewski, P. A., Abu-Zied, R. H., Casford, J. S. L., and Hayes, A.: Holocene atmosphere-ocean interactions: records from Greenland and the Aegean Sea, Clim. Dynam., 18, 587– 593, 2002.
Rossignol-Strick, M.: The Holocene climatic optimum and pollen records of sapropel 1 in the eastern Mediterranean, 9000– 6000 BP, Quat. Sci. Rev., 18, 515–530, 1999.
Rozanski, K., Sonntag C., and Münnich K. O.: Factors controlling stable isotope composition of modern European precipitation, Tellus, 34, 142–150, 1982.
Rozanski, K., Araguás-Araguás, L., and Gonfiantini, R.: Isotopic patterns in modern global precipitation, In: Climate change in continental isotopic records (eds: Swart, P. K., Lohmann, K. C., McKenzie, J., and Savin, S.), Geoph. Monog. Series, 78, 1–36, 1993.
Schnitchen, C., Charman, D. J., Magyari, E., Braun, M., Grig-orszky, I., Tóthmérész, B., Molnár, M., and Szántó, Z.: Recon-structing hydrological variability from testate amoebae analysis in Carpathian peatlands, J. Paleolimnol., 36, 1–17, 2006. Scholz, D. and Hoffmann, D. L.: StalAge: An algorithm designed
for construction of speleothem age models, Quat. Geochronol., 6, 369–382, 2011.
Scholz, D., Frisia, S., Borsato, A., Spötl, C., Fohlmeister, J., Mudelsee, M., Miorandi, R., and Mangini, A.: Holocene climate variability in north-eastern Italy: potential influence of the NAO and solar activity recorded by speleothem data, Clim. Past, 8, 1367–1383, 2012,
http://www.clim-past.net/8/1367/2012/.
Sharp, Z.: Principles of stable isotope geochemistry, Pearson Edu-cation Inc., pp344, Upper Saddle River, 2007.
Siani, G., Paterne, M., and Colin, C.: Late glacial to Holocene planktic foraminifera bioevents and climatic record in the South Adriatic Sea, J. Quat. Sci., 25, 808–821, 2010.
Spötl, C., Fairchild, I. J., and Tooth, A.: Cave air control on dripwater geochemistry, Obir Caves (Austria): Implications for speleothem deposition in dynamically ventilated caves, Geochim. Cosmochim. Ac., 69, 2451–2468, 2005.
Staubwasser, M., and Weiss, H.: Holocene climate and cultural evo-lution in late prehistoric-early historic West Asia – Introduction, Quat. Res., 66, 372–387, 2006.
Tãma¸s, T., Onac, B. P., and Bojar, A.-V.: Lateglacial-Middle Holocene stable isotope records in two coeval stalagmites from the Bihor Mountains, NW Romania, Geol. Q., 49, 185–194, 2005.
Tremaine, D. M., Froelich, and P. N., Wang. Y.: Speleothem calcite farmed in situ: Modern calibration ofδ18O andδ13C paleocli-mate proxies in a continuously-monitored natural cave system, Geochim. Cosmochim. Ac., 75, 4929–4950, 2011.
Trigo, I. F., Bigg, G. R., and Davies, T. D.: Climatology of cyclo-genesis mechanisms in the Mediterranean, Mon. Weather Rev., 130, 549–569, 2002.
Verheyden, S., Nader, F., Cheng, H., Edwards, L., and Swennen, R.: Paleoclimate reconstruction in the Levant region from the geo-chemistry of a Holocene stalagmite from the Jeita cave, Lebanon, Quat. Res., 70, 368–381, 2008.
Vollweiler, N., Scholz, D., Mühlinghaus, C., Mangini, A., and Spötl, C.: A precisely dated climate record for the last 9 kyr from three high alpine stalagmites, Spannagel Cave, Austria, Geophys. Res. Lett., 33, L20703, doi:10.1029/2006GL027662, 2006.
Wanner, H., Beer, J., Bütikofer, J., Crowley, T. J., Cubasch, U., Flückiger, J., Goosse, H., Grosjean, M., Joos, F., Kaplan, J. O., Küttel, M. l., Müller, S. A., Prentice, I. C., Solomina, O., Stocker, T. F., Tarasov, P., Wagner, M., and Widmann, M.: Mid-to Late Holocene climate change: an overview, Quat. Sci. Rev., 27, 1791–1828, 2008.
Wanner, H., Solomina, O., Grosjean, M., Ritz, S. P., and Jetel, M.: Structure and origin of Holocene cold events, Quat. Sci. Rev., 30, 3109–3123, 2011.