AMTD
7, 7883–7922, 2014
Volcanic SO2 from
MLS
H. C. Pumphrey et al.
Title Page Abstract Introduction Conclusions References
Tables Figures
◭ ◮
◭ ◮
Back Close
Full Screen / Esc
Printer-friendly Version Interactive Discussion
Discussion
P
a
per
|
Discus
sion
P
a
per
|
Discussion
P
a
per
|
Discussion
P
a
per
|
Atmos. Meas. Tech. Discuss., 7, 7883–7922, 2014 www.atmos-meas-tech-discuss.net/7/7883/2014/ doi:10.5194/amtd-7-7883-2014
© Author(s) 2014. CC Attribution 3.0 License.
This discussion paper is/has been under review for the journal Atmospheric Measurement Techniques (AMT). Please refer to the corresponding final paper in AMT if available.
Observations of volcanic SO
2
from MLS
on Aura
H. C. Pumphrey1, W. G. Read2, N. J. Livesey2, and K. Yang3
1
School of GeoSciences, The University of Edinburgh, Edinburgh EH9 3JN, UK
2
Jet Propulsion Laboratory, California Institute of Technology, Pasadena, CA 91109-8099, USA
3
Department of Atmospheric and Oceanic Science, University of Maryland, College Park, MD 20742, USA
Received: 29 May 2014 – Accepted: 20 June 2014 – Published: 31 July 2014
Correspondence to: H. C. Pumphrey ([email protected])
AMTD
7, 7883–7922, 2014
Volcanic SO2 from
MLS
H. C. Pumphrey et al.
Title Page Abstract Introduction Conclusions References
Tables Figures
◭ ◮
◭ ◮
Back Close
Full Screen / Esc
Printer-friendly Version Interactive Discussion
Discussion
P
a
per
|
Discus
sion
P
a
per
|
Discussion
P
a
per
|
Discussion
P
a
per
|
Abstract
Sulphur dioxide (SO2) is an important atmospheric constituent, particularly in the
af-termath of volcanic eruptions. These events can inject large amounts of SO2 into the
lower stratosphere, where it is oxidised to form sulphate aerosols; these in turn have
a significant effect on the climate. The MLS instrument on the Aura satellite has
ob-5
served the SO2 mixing ratio in the upper troposphere and lower stratosphere from
August 2004 to the present, during which time a number of volcanic eruptions have
significantly affected those regions of the atmosphere. We describe the MLS SO2data
and how various volcanic events appear in the data. As the MLS SO2data are currently
not validated we take some initial steps towards their validation. First we establish the 10
level of internal consistency between the three spectral regions in which MLS is
sensi-tive to SO2. We compare SO2column values calculated from MLS data to total column
values reported by the OMI instrument. The agreement is good in cases where the
SO2is clearly at altitudes above 147 hPa.
1 Introduction
15
Sulphur dioxide (SO2) is an important minor constituent of the atmosphere. Natural
tro-pospheric sources include volcanoes, while anthropogenic sources include combustion of fossil fuels and smelting of sulphur-containing metal ores. Tropospheric emission of
SO2 has a variety of detrimental effects on air quality and ecosystems; in particular it
can be a major contributor to acid rain (Likens and Bormann, 1974). The high solubil-20
ity of SO2 in water which leads to acid rain means that very little of the SO2 emitted
AMTD
7, 7883–7922, 2014
Volcanic SO2 from
MLS
H. C. Pumphrey et al.
Title Page Abstract Introduction Conclusions References
Tables Figures
◭ ◮
◭ ◮
Back Close
Full Screen / Esc
Printer-friendly Version Interactive Discussion
Discussion
P
a
per
|
Discus
sion
P
a
per
|
Discussion
P
a
per
|
Discussion
P
a
per
|
surface by a process which is sufficiently energetic to loft it to that altitude. A volcanic
eruption is the only such process that is of any importance.
Once in the stratosphere, SO2becomes an important component of the climate
sys-tem (Robock, 2000). It is oxidised on a time-scale of about a month, becoming aerosol particles which have a lifetime in the stratosphere of over a year. These particles alter 5
the albedo of the Earth, reflecting a fraction of sunlight back into space and thereby re-ducing the Earth’s temperature. Based on six of the largest eruptions of between 1875
and 1991, Robock and Mao (1995) show that the cooling can be on the order of 0.1◦C
to 0.2◦C.
A variety of techniques exist for the remote sensing of atmospheric SO2 from
satel-10
lites. Nadir sounding provides good horizontal resolution but little or no vertical resolu-tion. Both thermal emission in the infra-red (IR) (Clarisse et al., 2012) and
backscat-tered sunlight in the ultraviolet (UV) (Yang et al., 2007) can be used. Note that SO2layer
heights may also be retrieved from hyper-spectral UV observations when the columns
are sufficiently large (Yang et al., 2010). Limb sounding instruments provide
vertically-15
resolved profiles but with limited horizontal resolution. Thermally-emitted radiation in both the infra-red (Höpfner et al., 2013) and microwave (Read et al., 1993) regions can be used for limb sounding.
The Microwave Limb Sounder or MLS (Waters et al., 2006) is one of the four in-struments on NASA’s Aura satellite (Schoeberl et al., 2006). MLS measures the con-20
centrations of a suite of 14 chemical species in the upper troposphere and middle
atmosphere. Sulphur dioxide (SO2) is one of the species measured. The sensitivity of
the measurement is not sufficient to detect the background levels of SO2, but the
en-hanced levels present following a sufficiently-large volcanic eruption are detected; it is
these observations which we report in this paper. We describe the instrument and the 25
measurement process in more detail in Sect. 2, give an overview of the volcanic events observed in Sect. 3, and examine three of the larger events in more detail in Sect. 4. In
AMTD
7, 7883–7922, 2014
Volcanic SO2 from
MLS
H. C. Pumphrey et al.
Title Page Abstract Introduction Conclusions References
Tables Figures
◭ ◮
◭ ◮
Back Close
Full Screen / Esc
Printer-friendly Version Interactive Discussion
Discussion
P
a
per
|
Discus
sion
P
a
per
|
Discussion
P
a
per
|
Discussion
P
a
per
|
volcanic eruptions of the last decade. In Sect. 6 we make an initial attempt to validate the data.
2 Data
2.1 The MLS instrument
Aura (Schoeberl et al., 2006) was launched in July 2004, and the MLS instrument (Wa-5
ters et al., 2006) has operated with little interruption from August 2004 to date. The satellite orbits at an altitude of 705 km, performing approximately 14.5 orbits per day. The MLS instrument consists of a 1.6 m parabolic dish antenna feeding heterodyne radiometers operating at 118, 190, 240 and 640 GHz. A separate small antenna feeds another radiometer operating at 2.5 THz. The output of the radiometers is analysed by 10
banks of filters. The antenna looks forward from the Aura platform, in the plane of the orbit, and is scanned across the Earth’s limb 240 times per orbit. As the orbit is inclined
at 98◦to the equator, the instrument observes a latitude range from 82◦S to 82◦N every
day. The observations are of thermal emission from the atmosphere and can therefore be made day and night. The orbit is sun-synchronous, so the observations are always 15
made at the same two local times for a given latitude. The radiances reported by the filter banks are used as input to a software package (Livesey et al., 2006) which esti-mates profiles of temperature, and of the mixing ratios of the target chemical species.
Most MLS estimated profiles, including SO2, are reported on pressure levels spaced at
6 levels per pressure decade, a spacing of approximately 2.7 km in altitude. The esti-20
mated profiles are spaced 1.5◦ (167 km) apart along the orbit track. All mixing ratios in
AMTD
7, 7883–7922, 2014
Volcanic SO2 from
MLS
H. C. Pumphrey et al.
Title Page Abstract Introduction Conclusions References
Tables Figures
◭ ◮
◭ ◮
Back Close
Full Screen / Esc
Printer-friendly Version Interactive Discussion
Discussion
P
a
per
|
Discus
sion
P
a
per
|
Discussion
P
a
per
|
Discussion
P
a
per
|
2.2 The MLS SO2measurement
The SO2molecule, like the H2O and O3molecules, is a nonlinear triatomic molecule.
A combination of this shape, a moderately large dipole moment (similar to that of wa-ter) and a large moment of inertia leads to a spectrum with a large number of strong
lines and an even larger number of weak ones. There are reasonably strong SO2lines
5
present in the passband of all MLS radiometers. The software makes separate attempts
to estimate the SO2 mixing ratio from the 190, 240 and 640 GHz radiometers but only
the 240 GHz product is of sufficient quality for general use.
Three versions of the MLS data have been released to the public: V1.5, V2 and
V3. Although V3 is an improvement on V2 in most respects, CO and SO2 data in
10
the upper troposphere are distinguished less well from clouds in V3 than in V2. For
this reason we use the V2 data in this paper. The pressure levels on which SO2 is
reported and where significant amounts have been observed are 316, 215, 147, 100, 68 and 46 hPa. At altitudes below the 316 hPa level no retrieval is attempted. Retrieval is attempted between 316 hPa and 1 hPa; the sensitivity and vertical resolution of the 15
retrieval become rapidly poorer at altitudes above 10 hPa. Between 215 hPa and 10 hPa the vertical resolution is close to the spacing between the pressure levels; about 3 km. Although retrieval is attempted at 315 hPa the data at this level are not recommended for general use. We present them in this paper but are cautious about drawing any conclusions from them. Further details on the data quality are given in Livesey et al. 20
(2007).
Figure 1 shows data from a single pressure level, for all profiles on two different days.
On 7 August 2008 the SO2mixing ratio, as observed by MLS, was very small compared
to the measurement noise. The additional scatter seen in the tropics is caused by high clouds interfering with the retrieval. On 11 August 2008 there are a collection of points 25
with large and positive values; as we show in more detail below these points represent
SO2emitted from the eruption of Kasatochi on 8 August 2008. Those points which are
AMTD
7, 7883–7922, 2014
Volcanic SO2 from
MLS
H. C. Pumphrey et al.
Title Page Abstract Introduction Conclusions References
Tables Figures
◭ ◮
◭ ◮
Back Close
Full Screen / Esc
Printer-friendly Version Interactive Discussion
Discussion
P
a
per
|
Discus
sion
P
a
per
|
Discussion
P
a
per
|
Discussion
P
a
per
|
standard deviation used are for the un-marked points only; an iterative procedure was
used to separate the marked points. The choice of 7.7 standard deviations as a cut-off
is arbitrary and was chosen by trial and error in order to have only a small number of false positives while still identifying the major volcanic events. Figure 1 suggests that
there are a number of points which are affected by volcanic SO2but which are below
5
this threshold.
Figure 1 also suggests that the daily zonal mean MLS SO2 mixing ratio is not quite
zero. Inspection of a time series (not shown) shows that it varies somewhat throughout the year. At most altitudes the annual cycle is largest at the poles, where it has an
amplitude of about 2 ppbv. We do not consider this feature of the data to be due to SO2
10
in the atmosphere for several reasons. Firstly, recent observations of the background
SO2amounts by Höpfner et al. (2013) show that the true background levels are much
smaller than this. Secondly, the seasonal cycles in MLS SO2 show many features in
common with the seasonal cycles in MLS measurements of ozone and nitric acid; these species have strong spectral lines in the passband of the 240 GHz radiometer. 15
We conclude that the seasonal cycles seen in the zonal mean SO2data are essentially
leakage of information from the O3 and HNO3 measurements. While the MLS data
appear promising for the study of enhanced levels of SO2caused by volcanoes, it is not
currently possible to average them down in an attempt to study seasonal variability of the non-volcanic background or other features with amplitudes below about 2–3 ppbv. 20
In Fig. 2 we show some profiles for two days for latitude bands affected by volcanic
eruptions. Points with mixing ratios greater than 7.7 standard deviations above the mean are identified as for Fig. 1 and profiles containing such a point are shown in
black. The two events shown differ from each other in the vertical distribution of SO2; in
one event the SO2is all at the 68 hPa level, in the other it is distributed between 68 hPa
25
AMTD
7, 7883–7922, 2014
Volcanic SO2 from
MLS
H. C. Pumphrey et al.
Title Page Abstract Introduction Conclusions References
Tables Figures
◭ ◮
◭ ◮
Back Close
Full Screen / Esc
Printer-friendly Version Interactive Discussion
Discussion
P
a
per
|
Discus
sion
P
a
per
|
Discussion
P
a
per
|
Discussion
P
a
per
|
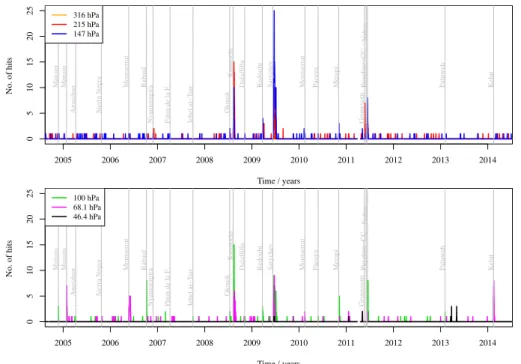
3 Event detection
We apply the detection procedure used for Figs. 1 and 2 to the entire mission; the result is shown in Fig. 3. The times of volcanic eruptions that are detected by MLS are marked on the figure. The larger events are very obvious. Some of the smaller ones are not obvious; detection was confirmed by a combination of independent reports of an 5
eruption and co-located observations of enhanced SO2by the OMI instrument (also on
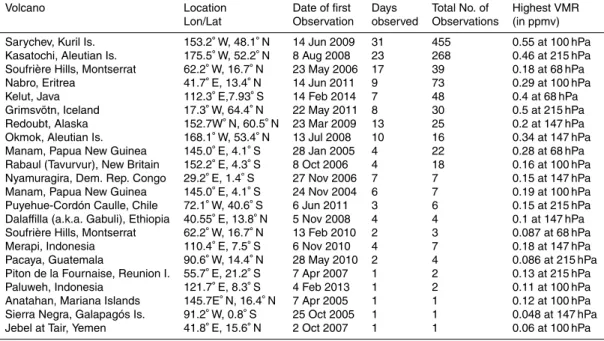
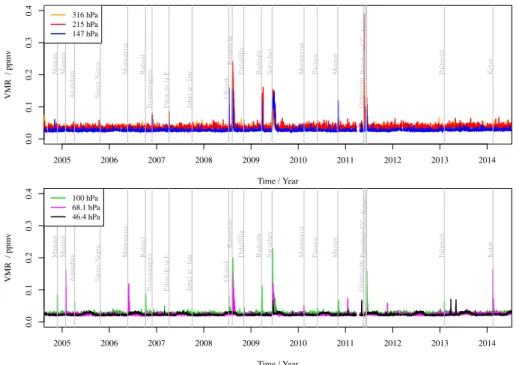
Aura). The events marked on Fig. 3 are summarised in Table 1. Much of the information about names and locations of volcanoes, and times of eruptions, was provided by the Smithsonian Global Volcanism Program (http://www.volcano.si.edu). Figure 4 shows the typical mixing ratios observed in the volcanic plumes; where there is no plume the 10
maximum value observed that day is shown. Figures 3 and 4 show a few spikes in 2011 and 2013 which on closer inspection appear to be faults or glitches in the data and do not appear to be associated with any volcanic activity.
4 Major events in more detail
In this section we examine in more detail several of the volcanic eruptions shown in 15
Fig. 3 and Table 1.
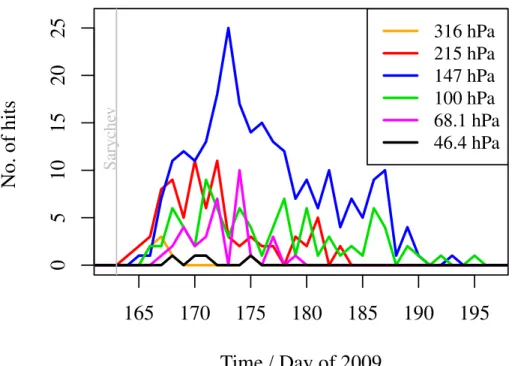
4.1 Sarychev, June 2009
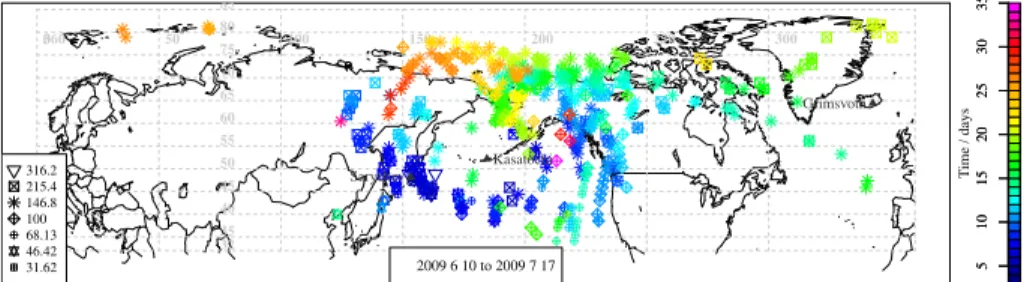
The Sarychev Peak volcano is located in the Russian Kuril Island chain, between Japan and the Kamchatka peninsula. A major eruption of the volcano occurred between 11 and 16 June 2009; the eruption is described by Rybin et al. (2011) and a detailed 20
chronology of the explosion is given by Matoza et al. (2011). The most energetic phases of the eruption were between 12 June and 16 June. We show the time
se-ries of MLS observations of elevated SO2in Fig. 5 and a map of the locations of these
AMTD
7, 7883–7922, 2014
Volcanic SO2 from
MLS
H. C. Pumphrey et al.
Title Page Abstract Introduction Conclusions References
Tables Figures
◭ ◮
◭ ◮
Back Close
Full Screen / Esc
Printer-friendly Version Interactive Discussion
Discussion
P
a
per
|
Discus
sion
P
a
per
|
Discussion
P
a
per
|
Discussion
P
a
per
|
Figure 5 is produced in the same manner as Fig. 3. Note that the greatest number of observations occurs at the 147 hPa level, but that the first observations (days 164
and 165; 13 and 14 June) are at 215 hPa. Figure 6 suggests that most of the SO2
trav-elled eastwards away from the volcano, curving Northwards over Canada and Alaska and dividing into two parts, one of which travelled Westwards to disperse over Eastern 5
Russia, the other of which travelled westwards across Northern Canada and
Green-land. A portion of the SO2travelled westwards away from the volcano; closer inspection
suggests that this is the SO2that was emitted towards the end of the eruption.
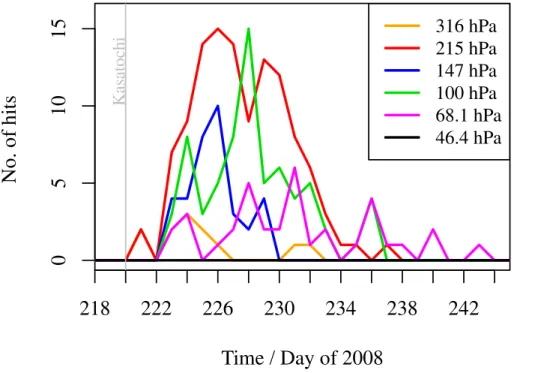
4.2 Kasatochi
The Kasatochi volcano in the Aleutian island chain erupted rather unexpectedly on 7–8 10
August 2008. The eruption is described by Waythomas et al. (2010) and the evolution
of the SO2plume as observed by OMI is described by Krotkov et al. (2010).
We show the time series of MLS observations of elevated SO2in Fig. 7 and a map of
the locations of these observations in Fig. 8. The SO2plume appears to be at a slightly
lower altitude than that from Sarychev; there are no detections at 46 hPa and the largest 15
number occur at 215 hPa rather than 146 hPa. All of the observations are to the east of the volcano; the upper level winds were presumably westerly at all altitudes at which
MLS observed any volcanic SO2. The plume experiences considerable wind shear
once over North America; the SO2 at 215 hPa travelling rapidly eastwards across the
North Atlantic while that at 100 and 68 hPa remains over North America. The obser-20
vations persist for a longer time at these three levels than at the intervening 147 hPa level.
4.3 Montserrat
The Soufrière Hills volcano on the island of Montserrat in the West Indies underwent a long phase of eruptive activity between 1995 and 2009. The eruption was char-25
AMTD
7, 7883–7922, 2014
Volcanic SO2 from
MLS
H. C. Pumphrey et al.
Title Page Abstract Introduction Conclusions References
Tables Figures
◭ ◮
◭ ◮
Back Close
Full Screen / Esc
Printer-friendly Version Interactive Discussion
Discussion
P
a
per
|
Discus
sion
P
a
per
|
Discussion
P
a
per
|
Discussion
P
a
per
|
(2010) and references therein). Most of this activity made little impact on regions of the atmosphere observable by MLS; the main exception was the dome collapse on 20
May 2006. The collapse is described by Loughlin et al. (2010) and the SO2release by
Carn and Prata (2010) and by Prata et al. (2007).
We show the time series of MLS observations of elevated SO2in Fig. 9 and a map of
5
the locations of these observations in Fig. 10. Note that the SO2is confined to a narrow
layer, affecting only the 68 hPa level in the MLS data. This is in agreement with the
modelling results in Prata et al. (2007) which show the SO2forming a layer centred at
a height of 20 km and width (FWHM) of 2 km. It is some days after the eruption before
MLS observes any volcanic SO2. Inspection of data from the OMI instrument, which
10
has a higher horizontal resolution, shows that the plume was of a small size and fell between the MLS orbits between 20 May and 22 May.
5 Total SO2burden
We calculated the total mass of SO2in a suitable latitude region for each major
erup-tion. To do this, we first calculated daily zonal means of mixing ratio. These were then 15
integrated vertically as in Sec. 6.2.1 to give zonal mean column amounts. Finally, the column amounts are weighted by area and summed for a suitable range of latitudes. Both the latitude range and the highest pressure used in the vertical integration are chosen separately for each eruption.
The results are in most cases dominated by the spurious seasonal cycle described 20
in Sect. 2.2. As this varies smoothly we can remove it by fitting annual and semi-annual
cycles to the data for the time unaffected by the eruption; a typical example is shown
in Fig. 11.
The excess mass, Mt, above the spurious background can be adequately fitted as
a function of time,t, by a decaying exponential:
25
Mt=M0exp
−(t−t
0)
τ
⇔logeMt=logeM0−(t −t0)
AMTD
7, 7883–7922, 2014
Volcanic SO2 from
MLS
H. C. Pumphrey et al.
Title Page Abstract Introduction Conclusions References
Tables Figures
◭ ◮
◭ ◮
Back Close
Full Screen / Esc
Printer-friendly Version Interactive Discussion
Discussion
P
a
per
|
Discus
sion
P
a
per
|
Discussion
P
a
per
|
Discussion
P
a
per
|
whereM0 is the total mass injected by the volcano at timet0, and τ is the e-folding
time for the conversion of SO2to sulphate aerosol. An example of such a fit is shown
in Fig. 11 and a summary of the largest events observed by MLS is shown in Fig. 12.
Table 2 shows the two fitted parametersM0andτfor each of these events.
The agreement between injected mass estimates from MLS and those found in the 5
literature are generally good. Clear discrepancies are the much larger values reported by Clarisse et al. (2012) for Grimsvötn and Nabro. For Grimsvötn this is unsurprising as
most of the SO2observed by MLS is at 316 and 215 hPa; it seems likely that a fraction
of the plume was at rather low altitudes, where MLS would be unable to observe it.
For Nabro, most of the SO2 observed by MLS is at 100 and 147 hPa, where we would
10
expect the MLS observations to be reasonably good. However, Nabro is at a rather low latitude, where the ability of MLS to observe at lower altitudes is more likely to be
adversely affected by high levels of water vapour in the upper troposphere. A more
recent paper (Clarisse et al., 2014) gives a mass of 650 Gg above 10 km for the initial phase of the eruption; this is in somewhat better agreement with the MLS estimate. It 15
should be noted that all of the eruptions during the Aura mission to date have been small compared to the eruption of Mount Pinatubo in 1991; Read et al. (1993) give
a total mass ofMt=17 000 Gg for that eruption. The e-folding time for Pinatubo was
approximately 33 days, in reasonable agreement with the values in Table 2.
6 Initial validation of the MLS data
20
The data we have described have not been validated. They appear reasonable at a first glance in that the values are smaller than the measurement noise except shortly after the eruption of volcanoes which have been observed erupting from the ground and from other satellites. Further validation from in-situ measurements is not
straightfor-ward as for most of the time and at most places there is not sufficient SO2 for MLS
25
AMTD
7, 7883–7922, 2014
Volcanic SO2 from
MLS
H. C. Pumphrey et al.
Title Page Abstract Introduction Conclusions References
Tables Figures
◭ ◮
◭ ◮
Back Close
Full Screen / Esc
Printer-friendly Version Interactive Discussion
Discussion
P
a
per
|
Discus
sion
P
a
per
|
Discussion
P
a
per
|
Discussion
P
a
per
|
is to cross-validate the various satellite SO2measurements against each other. While
this process can not be considered watertight, we can feel some increased confidence
if several satellite measurements using different spectral ranges and observation
ge-ometries are in agreement with each other.
In this section we compare the standard MLS product against SO2 estimates from
5
the 190 GHz and 640 GHz radiometers on the same instrument. We then compare integrated column values calculated from the MLS data to column values from the OMI instrument.
6.1 Internal consistency
As we noted in Sect. 2.2, MLS makes three partly-independent estimates of SO2: from
10
the 190 GHz, 240 GHz and 640 GHz radiometers. Some errors are common to all these estimates: these include errors from the temperature/pointing retrieval. Other errors, such as those from spectroscopic data, should be more-or-less uncorrelated between the three estimates. The field of view of the three radiometers is very similar, to the extent that we can consider the three measurements to made at exactly the same time 15
and place.
We compare the 190 GHz and 640 GHz products against the standard 240 GHz
prod-uct in Fig. 13. In order to avoid plotting an excessive number of points which are eff
ec-tively zero we consider only periods of time after a major eruption. We also show only points from profiles which contain a point at some level which is more than 5.5 standard 20
deviations above the mean for that level; this criterion is less restrictive than that used in earlier sections. For each scatter plot in Fig. 13 we fit a straight line to the data in two ways: first we assume that the standard product is the independent variable and that
all the errors are in the 640 GHz or 190 GHz product (dashed liney ∼x in the figure).
Next, we assume that all the errors are in the standard product (dot-dash linex∼y).
25
We note that in general the 640 GHz SO2 appears to under-estimate the standard
240 GHz SO2; the slopes of the fit lines tend to be considerably less than 1. In
AMTD
7, 7883–7922, 2014
Volcanic SO2 from
MLS
H. C. Pumphrey et al.
Title Page Abstract Introduction Conclusions References
Tables Figures
◭ ◮
◭ ◮
Back Close
Full Screen / Esc
Printer-friendly Version Interactive Discussion
Discussion
P
a
per
|
Discus
sion
P
a
per
|
Discussion
P
a
per
|
Discussion
P
a
per
|
is very little correlation between the different SO2 products, but we note that the four
points with mixing ratios above 0.06 ppmv lie close to the 1 : 1 line. At 68 and 100 hPa the correlation is much stronger and a larger fraction of the points are responsible for it.
6.2 Comparison with OMI
5
The OMI instrument is described by Levelt et al. (2006). OMI is a nadir UV/visible imaging spectrometer. In its usual operating mode it observes a 2600 km-wide swath with 60 image pixels across the width of the swath. The pixels are 24 km across at nadir, becoming wider towards the edges of the swath. In the along-track direction
the pixels are 13 km across. The algorithm used to derive total column SO2 from OMI
10
measurements is described by Yang et al. (2007). It is suitable for most conditions but underestimates the total column where that column is very large. The error can be as large as 70 % for a column of 400 DU dropping to 20 % for a column of 100 DU. The
formula used requires that the vertical distribution of SO2 is specified. The data files
contain four separate estimates of column SO2, each with a different assumption about
15
the vertical profile. The estimates are called PBL, TRL, TRM and STL, corresponding
to centre-of-mass altitudes of 0.9, 2.5, 7.5 and 17 km respectively. As the useful SO2
measurements from MLS are at 10 km or above we compare them only to the STL product from OMI.
The OMI instrument has been affected by a somewhat mysterious problem known as
20
the “row anomaly”. This anomaly first appears in the data on 25 June 2007 and affects
an increasing number of pixels over the subsequent years.
6.2.1 Method
As the MLS data are vertical profiles of mixing ratio and the OMI data are total column amounts it is necessary to integrate the MLS profiles with respect to a vertical co-25
AMTD
7, 7883–7922, 2014
Volcanic SO2 from
MLS
H. C. Pumphrey et al.
Title Page Abstract Introduction Conclusions References
Tables Figures
◭ ◮
◭ ◮
Back Close
Full Screen / Esc
Printer-friendly Version Interactive Discussion
Discussion
P
a
per
|
Discus
sion
P
a
per
|
Discussion
P
a
per
|
Discussion
P
a
per
|
column value will always be a partial column as the instrument can not observe SO2at
altitudes below the 315 hPa level. The formula used is derived in Appendix A of Livesey and Snyder (2004), assuming that, between the standard MLS pressure levels, the
mixing ratio varies linearly in loge(p). The column amount due only to the SO2value at
thejth pressure level is:
5
Nj= A
Mgfj
∆+p
∆+(log
e(p))
− ∆
− p
∆−(log
e(p))
wherep is pressure, Ais Avogadro’s number, g is the acceleration due to gravity, M
is the average mole mass of air andfj is the retrieved mixing ratio at thejth pressure
level. We use the notation that∆+x means the change in x between the jth and the
j+1 th level;∆−x is the change inxbetween thejth and thej−1 th level. The column
10
value for MLS is obtained by summing theNj values over a suitable range ofj and is
then divided by a factor of 2.687×10²⁰in order to convert from molecules per unit area
to Dobson units.
The OMI data are provided as column values in Dobson units. As OMI is a nadir sounder and is on the same platform as MLS, its measurement at a given location is 15
made at 425±10 s after the MLS measurement. This 7 min delay is small enough that
we do not attempt to correct for it. As the MLS horizontal field of view is narrower than an OMI pixel we only consider those OMI pixels which are less than 18 km from the line joining successive MLS profile positions. For each MLS profile we form an average of those OMI pixels which meet this criterion and which are closer to that MLS profile 20
than to any other. For most MLS profiles this means that the single MLS column is compared to a mean value of between 12 and 26 OMI pixels. We also calculate the standard deviation of this set of pixels. The slight oblateness of the Earth means that the coincident pixels are not all in the same pixel row of the OMI swath; the coincident row varies from row 31 (of 60) near the poles to row 39 near the equator. During the 25
AMTD
7, 7883–7922, 2014
Volcanic SO2 from
MLS
H. C. Pumphrey et al.
Title Page Abstract Introduction Conclusions References
Tables Figures
◭ ◮
◭ ◮
Back Close
Full Screen / Esc
Printer-friendly Version Interactive Discussion
Discussion
P
a
per
|
Discus
sion
P
a
per
|
Discussion
P
a
per
|
Discussion
P
a
per
|
MLS and OMI column values for a region in the north-east Pacific. Both instruments show a region of large column values; this is due to the eruption of Kasatochi which occurred a few days earlier.
6.2.2 Results
Comparisons as described above can not be performed after January 2009 as the 5
OMI row anomaly affects pixel rows 28–38 from that time onward. We therefore
per-form such comparisons for periods immediately following the eruptions of Kasatochi on 8 August 2008, Montserrat on 20 May 2006, Rabaul on 8 October 2006 and Manam on 28 January 2005. The results are shown in Figs. 15 to 18.
The agreement between MLS and OMI is good for Rabaul, Manam and Montser-10
rat, where the SO2 profile peaks at 68 hPa or 100 hPa. For Kasatochi, where there
are measurable amounts of SO2 down to (and presumably below) 315 hPa, the MLS
column tends to underestimate the OMI column.
6.3 Further validation possibilities
6.3.1 ACE-FTS
15
The ACE-FTS instrument (Bernath et al., 2005) measures a wide range of chemical species in the upper troposphere and middle atmosphere using the solar occultation technique at visible and near-infrared wavelengths. The technique provides great sen-sitivity at the cost of limited geographical coverage; data are only available at 15 sun-rises and 15 sunsets per day. The latitude at which these events occur changes slowly 20
throughout the year. SO2is not a standard ACE-FTS data product, but an experimental
SO2dataset has been produced (Doeringer et al., 2012). We have attempted to
com-pare this dataset to the MLS data with no success; the limited coverage of ACE-FTS ensures that on no occasion do the ACE-FTS measurement latitudes coincide with
a region of SO2which is concentrated enough to be observable by MLS.
AMTD
7, 7883–7922, 2014
Volcanic SO2 from
MLS
H. C. Pumphrey et al.
Title Page Abstract Introduction Conclusions References
Tables Figures
◭ ◮
◭ ◮
Back Close
Full Screen / Esc
Printer-friendly Version Interactive Discussion
Discussion
P
a
per
|
Discus
sion
P
a
per
|
Discussion
P
a
per
|
Discussion
P
a
per
|
6.3.2 MIPAS
MIPAS (Fischer et al., 2008) was an infra-red limb-sounding instrument on Envisat. The MIPAS spectrometer was a Fourier-transform type, producing spectra with a high spec-tral resolution. Only a few species were retrieved from these spectra on an operational basis, but experimental retrievals have been produced for a number of other molecules 5
of which SO2is one.
Monthly zonal means of SO2have been produced by Höpfner et al. (2013).
Compar-ison of these data to MLS have not proved to be useful as the non-volcanic background in the MLS data is, as we have noted earlier, dominated by systematic errors. The small
contribution to the monthly zonal mean from volcanoes affects too small a number of
10
months and latitude bins to provide any kind of useful statistics.
A single-profile retrieval of SO2from MIPAS is in development (M. Höpfner, personal
communication, 2014). A forthcoming paper describing that dataset will include a com-parison with MLS.
6.3.3 IASI
15
Several recent papers (Clarisse et al., 2012, 2014) have demonstrated the potential of
the IASI instrument to provide useful SO2measurements. In particular, Clarisse et al.
(2014) compare the centre of mass of MLS profiles with plume heights estimated from IASI and find very good agreement.
7 Discussion
20
Although the progress we have made in validating the MLS SO2 data is limited, the
results so far are encouraging in that the measurements agree well with OMI, and
total masses of SO2 estimated from the MLS data are in line with values previously
AMTD
7, 7883–7922, 2014
Volcanic SO2 from
MLS
H. C. Pumphrey et al.
Title Page Abstract Introduction Conclusions References
Tables Figures
◭ ◮
◭ ◮
Back Close
Full Screen / Esc
Printer-friendly Version Interactive Discussion
Discussion
P
a
per
|
Discus
sion
P
a
per
|
Discussion
P
a
per
|
Discussion
P
a
per
|
As a tool for studying the dispersion of volcanic SO2, MLS has both advantages and
disadvantages over other currently-operating satellite instruments. Its main advantage is that it provides vertical profiles (see Fig. 2) and not just column amounts. The altitude
of the SO2 is therefore measured directly rather than requiring to be inferred from
the known meteorology. Its main disadvantage is that the horizontal coverage is very 5
sparse compared to that of most nadir sounders, as shown in Fig. 14. Designs for a future MLS-like instrument (Livesey et al., 2008) provide for viewing directions at a number of angles to the orbit track, allowing for global coverage at a resolution of 50 km; such an instrument would combine the advantages of MLS with those of nadir
sounding instruments and would be particularly valuable for the study of volcanic SO2.
10
8 Conclusions
The MLS instrument on Aura has observed enhanced SO2 mixing ratios following
a number of volcanic eruptions of various sizes. Total injected masses of SO2
cal-culated from the MLS data agree with previously-published values in most cases.
The total column SO2 calculated from the MLS profiles agrees well with the total
15
column reported by the OMI instrument under the right circumstances. The agreement
is very good for events where most of the SO2is clearly in the stratosphere (Montserrat
and Rabaul in 2006, Manam in 2005). Agreement is less good for events where some
of the SO2is at lower altitudes. This may be because there are significant amounts at
altitudes below 215 hPa, where the MLS sensitivity to SO2is reduced or zero.
20
The MLS V2 data show a seasonal cycle with an amplitude of about 2 ppmv which
is thought to be spurious. The seasonal effect is smaller than the random error in an
individual profile but becomes obvious if sufficient profiles are averaged. This seasonal
cycle needs to be removed with some care if calculating the total mass of SO2due to
a volcanic eruption. Its presence means that the MLS V2 data can not currently be used 25
AMTD
7, 7883–7922, 2014
Volcanic SO2 from
MLS
H. C. Pumphrey et al.
Title Page Abstract Introduction Conclusions References
Tables Figures
◭ ◮
◭ ◮
Back Close
Full Screen / Esc
Printer-friendly Version Interactive Discussion
Discussion
P
a
per
|
Discus
sion
P
a
per
|
Discussion
P
a
per
|
Discussion
P
a
per
|
Acknowledgements. The authors thank Michael Höpfner and Chris Boone for providing
prelim-inary SO2retrievals from MIPAS and ACE-FTS for comparison. The authors thank the RCUK
open access publication fund for paying publication charges. Work on MLS in the UK has been funded by NERC. MLS data used in this research was produced by the Jet Propulsion Labora-tory, California Institute of Technology, under contract with the National Aeronautics and Space
5
Administration.
References
Bernath, P. F., McElroy, C. T., Abrams, M. C., Boone, C. D., Butler, M., Camy-Peyret, C., Car-leer, M., Clerbaux, C., Coheur, P.-F., Colin, R., DeCola, P., DeMaziere, M., Drummond, J. R., Dufour, D., Evans, W. F. J., Fast, H., Fussen, D., Gilbert, K., Jennings, D. E., Llewellyn, E. J.,
10
Lowe, R. P., Mahieu, E., McConnell, J. C., McHugh, M., McLeod, S. D., Michaud, R., Mid-winter, C., Nassar, R., Nichitiu, F., Nowlan, C., Rinsland, C. P., Rochon, Y. J., Rowlands, N., Semeniuk, K., Simon, P., Skelton, R., Sloan, J. J., Soucy, M.-A., Strong, K., Tremblay, P., Turnbull, D., Walker, K. A., Walkty, I., Wardle, D. A., Wehrle, V., Zander, R., and Zou, J.: At-mospheric Chemistry Experiment (ACE): mission overview, Geophys Res. Lett, 32, L15S01,
15
doi:10.1029/2005GL022386, 2005. 7896
Brühl, C., Lelieveld, J., Crutzen, P. J., and Tost, H.: The role of carbonyl sulphide as a source of stratospheric sulphate aerosol and its impact on climate, Atmos. Chem. Phys., 12, 1239– 1253, doi:10.5194/acp-12-1239-2012, 2012. 7884
Carn, S. A. and Prata, F. J.: Satellite based constraints on explosive SO2release from Soufrière
20
Hills Volcano, Montserrat, Geophys. Res. Lett, 37, L00E22, doi:10.1029/2010GL044971, 2010. 7891, 7904
Carn, S. A., Krueger, A. J., Krotkov, N. A., Yang, K., and Evans, K.: Tracking volcanic sulfur diox-ide clouds for aviation hazard mitigation, Nat. Hazards, 51, 325–343, doi:10.1007/s11069-008-9228-4, 2008. 7904
25
AMTD
7, 7883–7922, 2014
Volcanic SO2 from
MLS
H. C. Pumphrey et al.
Title Page Abstract Introduction Conclusions References
Tables Figures
◭ ◮
◭ ◮
Back Close
Full Screen / Esc
Printer-friendly Version Interactive Discussion
Discussion
P
a
per
|
Discus
sion
P
a
per
|
Discussion
P
a
per
|
Discussion
P
a
per
|
Clarisse, L., Coheur, P.-F., Theys, N., Hurtmans, D., and Clerbaux, C.: The 2011 Nabro eruption,
a SO2 plume height analysis using IASI measurements, Atmos. Chem. Phys., 14, 3095–
3111, doi:10.5194/acp-14-3095-2014, 2014. 7892, 7897, 7904
D’Amours, R., Malo, A., Servranckx, R., Bensimon, D., Trudel, S., and Gauthier-Bilodeau, J.-P.: Application of the atmospheric Lagrangian particle dispersion model MLDP0 to the
5
2008 eruptions of Okmok and Kasatochi volcanoes, J. Geophys. Res, 115, D00L11, doi:10.1029/2009JD013602, 2010. 7904
Doeringer, D., Eldering, A., Boone, C. D., González Abad, G., and Bernath, P. F.:
Ob-servation of sulfate aerosols and SO2 from the Sarychev volcanic eruption using data
from the Atmospheric Chemistry Experiment (ACE), J. Geophys. Res, 117, D03203,
10
doi:10.1029/2011JD016556, 2012. 7896
Fischer, H., Birk, M., Blom, C., Carli, B., Carlotti, M., von Clarmann, T., Delbouille, L., Dud-hia, A., Ehhalt, D., Endemann, M., Flaud, J. M., Gessner, R., Kleinert, A., Koopman, R., Langen, J., López-Puertas, M., Mosner, P., Nett, H., Oelhaf, H., Perron, G., Remedios, J., Ridolfi, M., Stiller, G., and Zander, R.: MIPAS: an instrument for atmospheric and climate
15
research, Atmos. Chem. Phys., 8, 2151–2188, doi:10.5194/acp-8-2151-2008, 2008. 7897 Haywood, J. M., Jones, A., Clarisse, L., Bourassa, A., Barnes, J., Telford, P., Bellouin, N.,
Boucher, O., Agnew, P., Clerbaux, C., Coheur, P., Degenstein, D., and Braesicke, P.: Ob-servations of the eruption of the Sarychev volcano and simulations using the HadGEM2 climate model, J. Geophys. Res, 115, D21212, doi:10.1029/2010JD014447, 2010. 7904
20
Höpfner, M., Glatthor, N., Grabowski, U., Kellmann, S., Kiefer, M., Linden, A., Orphal, J.,
Stiller, G., von Clarmann, T., and Funke, B.: Sulfur dioxide (SO2) as observed by
MI-PAS/Envisat: temporal development and spatial distribution at 15–45 km altitude, Atmos. Chem. Phys. Discuss., 13, 12389–12436, doi:10.5194/acpd-13-12389-2013, 2013. 7885, 7888, 7897
25
Krotkov, N. A., Schoeberl, M. R., Morris, G. A., Carn, S., and Yang, K.: Dispersion and lifetime
of the SO2cloud from the August 2008 Kasatochi eruption, J. Geophys. Res., 115, D00L20,
doi:10.1029/2010JD013984, 2010. 7890, 7904
Levelt, P. F., van den Oord, G. H. J., Dobber, M. R., Mälkki, A., Visser, H., de Vries, J., Stammes, P., Lundell, J., and Saari, H.: The Ozone Monitoring Instrument, IEEE T. Geosci.
30
Remote, 44, 1093–1101, doi:10.1109/TGRS.2006.872333, 2006. 7894
AMTD
7, 7883–7922, 2014
Volcanic SO2 from
MLS
H. C. Pumphrey et al.
Title Page Abstract Introduction Conclusions References
Tables Figures
◭ ◮
◭ ◮
Back Close
Full Screen / Esc
Printer-friendly Version Interactive Discussion
Discussion
P
a
per
|
Discus
sion
P
a
per
|
Discussion
P
a
per
|
Discussion
P
a
per
|
Livesey, N. J. and Snyder, W. V.: EOS MLS Retrieval Processes Algorithm Teoretical Basis, Tech. Rep. JPL D-16159, JPL, version 2.0, 2004. 7895
Livesey, N. J., Snyder, W. V., Read, W. G., and Wagner, P. A.: Retrieval algorithms for the EOS Microwave Limb Sounder (MLS) instrument, IEEE T. Geosci. Remote, 44, 1144–1155, 2006.
5
7886
Livesey, N. J., Read, W. G., Lambert, A., Cofield, R. E., Cuddy, D. T., Froidevaux, L., Fuller, R. A., Jarnot, R. F., Jiang, J. H., Jiang, Y. B., Knosp, B. W., Kovalenko, L. J., Pick-ett, H. M., Pumphrey, H. C., Santee, M. L., Schwartz, M. J., Stek, P. C., Wagner, P. A., Wa-ters, J. W., and Wu., D. L.: Earth Observing System (EOS) Aura Microwave Limb Sounder
10
(MLS) Version 2.2 Level 2 data quality and description document., Tech. Rep. JPL D-33509, NASA Jet Propulsion Laboratory California Institute of Technology, Pasadena, California, 91109–8099, 2007. 7886, 7887
Livesey, N., Santee, M., Stek, P., Waters, J., Levelt, P., Veefkind, P., Kumer, J., and Roche, A.: A future “Global Atmospheric Composition Mission” (GACM) concept, in: 2008 IEEE
15
Aerospace Conference, IEEE, doi:10.1109/AERO.2008.4526243, 2008. 7898
Loughlin, S. C., Luckett, R., Ryan, G., Christopher, T., Hards, V., Angelis, S. D., Jones, L., and Strutt, M.: An overview of lava dome evolution, dome collapse and cyclicity at Soufrière Hills Volcano, Montserrat, 2005–2007, Geophys. Res. Lett., 37, L00E16, doi:10.1029/2010GL042547, 2010. 7890, 7891
20
Matoza, R. S., Pichon, A. L., Vergoz, J., Herry, P., Lalande, J.-M., Il Lee, H., Che, I.-Y., and Ry-bin, A.: Infrasonic observations of the June 2009 Sarychev Peak eruption, Kuril Islands: im-plications for infrasonic monitoring of remote explosive volcanism, J. Volcanol. Geoth. Res., 200, 35–48, 2011. 7889
Prata, A. J., Carn, S. A., Stohl, A., and Kerkmann, J.: Long range transport and fate of a
25
stratospheric volcanic cloud from Soufrière Hills volcano, Montserrat, Atmos. Chem. Phys., 7, 5093–5103, doi:10.5194/acp-7-5093-2007, 2007. 7891
Read, W. G., Froidevaux, L., and Waters, J. W.: Microwave Limb Sounder measurement of
stratospheric SO2 from the Mt. Pinatubo volcano., Geophys. Res. Lett., 20, 1299–1302,
doi:10.1029/93GL00831, 1993. 7885, 7892
30
Robock, A.: Volcanic eruptions and climate, Rev. Geophys., 38, 191–219,
doi:10.1029/1998RG000054, 2000. 7885
AMTD
7, 7883–7922, 2014
Volcanic SO2 from
MLS
H. C. Pumphrey et al.
Title Page Abstract Introduction Conclusions References
Tables Figures
◭ ◮
◭ ◮
Back Close
Full Screen / Esc
Printer-friendly Version Interactive Discussion
Discussion
P
a
per
|
Discus
sion
P
a
per
|
Discussion
P
a
per
|
Discussion
P
a
per
|
Rybin, A., Chibisova, M., Webley, P., Steensen, T., Izbekov, P., Neal, C., and Realmuto, V.: Satellite and ground observations of the June 2009 eruption of Sarychev Peak volcano, Matua Island, Central Kuriles, B. Volcanol., 73, 1377–1392,
doi:10.1007/s00445-011-0481-5
0, 2011. 7889
Schoeberl, M. R., Douglass, A. R., Hilsenrath, E., Bhartia, P. K., Barnett, J., Beer, R., Waters, J., Gunson, M., Froidevaux, L., Gille, J., Levelt, P. F., and DeCola, P.: Overview of the EOS Aura Mission, IEEE T. Geosci. Remote, 44, 1066–1074, 2006. 7885, 7886
Waters, J. W., Froidevaux, L., Harwood, R., Jarnot, R., Pickett, H., Read, W., Siegel, P.,
10
Cofield, R., Filipiak, M., Flower, D., Holden, J., Lau, G., Livesey, N., Manney, G., Pumphrey, H., Santee, M., Wu, D., Cuddy, D., Lay, R., Loo, M., Perun, V., Schwartz, M., Stek, P., Thurstans, R., Boyles, M., Chandra, S., Chavez, M., Chen, G.-S., Chudasama, B., Dodge, R., Fuller, R., Girard, M., Jiang, J., Jiang, Y., Knosp, B., LaBelle, R., Lam, J., Lee, K.,
Miller, D., Oswald, J., Patel, N., Pukala, D., Quintero, O., Scaff, D., Snyder, W., Tope, M.,
15
Wagner, P., and Walch, M.: The Earth Observing System Microwave Limb Sounder (EOS MLS) on the Aura satellite, IEEE T. Geosci. Remote, 44, 1106–1121, 2006. 7885, 7886 Waythomas, C. F., Scott, W. E., Prejean, S. G., Schneider, D. J., Izbekov, P., and Nye, C. J.:
The 7–8 August 2008 eruption of Kasatochi Volcano, central Aleutian Islands, Alaska, J. Geophys. Res., 115, B00B06, doi:10.1029/2010JB007437, 2010. 7890
20
Yang, K., Krotkov, N. A., Krueger, A. J., Carn, S. A., Bhartia, P. K., and Levelt, P. F.: Retrieval
of large volcanic SO2columns from the Aura Ozone Monitoring Instrument: comparison and
limitations, J. Geophys. Res., 112, D24S43, doi:10.1029/2007JD008825, 2007. 7885, 7894 Yang, K., Liu, X., Bhartia, P. K., Krotkov, N. A., Carn, S. A., Hughes, E. J., Krueger, A. J.,
Spurr, R. J. D., and Trahan, S. G.: Direct retrieval of sulfur dioxide amount and altitude from
25
AMTD
7, 7883–7922, 2014
Volcanic SO2 from
MLS
H. C. Pumphrey et al.
Title Page Abstract Introduction Conclusions References
Tables Figures
◭ ◮
◭ ◮
Back Close
Full Screen / Esc
Printer-friendly Version Interactive Discussion
Discussion
P
a
per
|
Discus
sion
P
a
per
|
Discussion
P
a
per
|
Discussion
P
a
per
|
Table 1.Table summarising MLS observations of SO2 during various volcanic eruptions. The eruptions are sorted roughly in order of impact. For the purposes of this table an “observation” is a point in the MLS profile which is more than 7.7 standard deviations above the usual zonal mean value for that pressure and latitude.
Volcano Location Date of first Days Total No. of Highest VMR
Lon/Lat Observation observed Observations (in ppmv)
Sarychev, Kuril Is. 153.2◦
W, 48.1◦
N 14 Jun 2009 31 455 0.55 at 100 hPa
Kasatochi, Aleutian Is. 175.5◦
W, 52.2◦
N 8 Aug 2008 23 268 0.46 at 215 hPa
Soufrière Hills, Montserrat 62.2◦
W, 16.7◦
N 23 May 2006 17 39 0.18 at 68 hPa
Nabro, Eritrea 41.7◦
E, 13.4◦
N 14 Jun 2011 9 73 0.29 at 100 hPa
Kelut, Java 112.3◦
E,7.93◦
S 14 Feb 2014 7 48 0.4 at 68 hPa
Grimsvötn, Iceland 17.3◦
W, 64.4◦
N 22 May 2011 8 30 0.5 at 215 hPa
Redoubt, Alaska 152.7W◦
N, 60.5◦
N 23 Mar 2009 13 25 0.2 at 147 hPa
Okmok, Aleutian Is. 168.1◦
W, 53.4◦
N 13 Jul 2008 10 16 0.34 at 147 hPa
Manam, Papua New Guinea 145.0◦
E, 4.1◦
S 28 Jan 2005 4 22 0.28 at 68 hPa
Rabaul (Tavurvur), New Britain 152.2◦
E, 4.3◦
S 8 Oct 2006 4 18 0.16 at 100 hPa
Nyamuragira, Dem. Rep. Congo 29.2◦
E, 1.4◦
S 27 Nov 2006 7 7 0.15 at 147 hPa
Manam, Papua New Guinea 145.0◦
E, 4.1◦
S 24 Nov 2004 6 7 0.19 at 100 hPa
Puyehue-Cordón Caulle, Chile 72.1◦
W, 40.6◦
S 6 Jun 2011 3 6 0.15 at 215 hPa
Dalaffilla (a.k.a. Gabuli), Ethiopia 40.55◦
E, 13.8◦
N 5 Nov 2008 4 4 0.1 at 147 hPa
Soufrière Hills, Montserrat 62.2◦
W, 16.7◦
N 13 Feb 2010 2 3 0.087 at 68 hPa
Merapi, Indonesia 110.4◦
E, 7.5◦
S 6 Nov 2010 4 7 0.18 at 147 hPa
Pacaya, Guatemala 90.6◦
W, 14.4◦
N 28 May 2010 2 4 0.086 at 215 hPa
Piton de la Fournaise, Reunion I. 55.7◦
E, 21.2◦
S 7 Apr 2007 1 2 0.13 at 215 hPa
Paluweh, Indonesia 121.7◦
E, 8.3◦
S 4 Feb 2013 1 2 0.11 at 100 hPa
Anatahan, Mariana Islands 145.7E◦
N, 16.4◦
N 7 Apr 2005 1 1 0.12 at 100 hPa
Sierra Negra, Galapagós Is. 91.2◦
W, 0.8◦
S 25 Oct 2005 1 1 0.048 at 147 hPa
Jebel at Tair, Yemen 41.8◦
E, 15.6◦
AMTD
7, 7883–7922, 2014
Volcanic SO2 from
MLS
H. C. Pumphrey et al.
Title Page Abstract Introduction Conclusions References
Tables Figures
◭ ◮
◭ ◮
Back Close
Full Screen / Esc
Printer-friendly Version Interactive Discussion
Discussion
P
a
per
|
Discus
sion
P
a
per
|
Discussion
P
a
per
|
Discussion
P
a
per
|
Table 2.Total injected SO2 massM0 and decay timeτ for a selection of the volcanic events
observed by MLS. Estimates ofM0from other sources are shown for comparison. Krotkov et al.
(2010) also give an estimate ofτ=9 days for Kasatochi. For Sarychev we show two estimates
for two choices of highest pressure used (pmax). The 215 hPa result is more use for comparison
with nadir-sounder data but is less satisfactory as it proved difficult to remove the seasonal
background for this case.
Name pmax/ τ/days M0/Gg M0/Gg (from other sources)
hPa
Sarychev 147 27±2 571±42
Sarychev 215 17±3 1160±180 1200±200 (Haywood et al., 2010) 900
(Clarisse et al., 2012)
Kasatochi 215 27±1 1350±38 1373 (D’Amours et al., 2010), 1500–
2500 (Richter et al.) 2200 (Krotkov et al., 2010)
Nabro 147 20±2 543±45 1500 (Clarisse et al., 2012), 650
(above 10 km) (Clarisse et al., 2014)
Grimsvotn 215 17±2 108±11 350–400 (Clarisse et al., 2012)
Kelut 100 34±7 144±12 200
http://so2.gsfc.nasa.gov/pix/special/ 2014/kelut/Kelut_summary_Feb14_ 2014.html
Rabaul 100 34±5 190±14 230 (Carn et al., 2008)
Montserrat 68.1 22±4 139±24 123–233 (Carn and Prata, 2010)