Hippocampal Neurons Show Increased Expression in
Patients at Mid-Stage Alzheimer’s Disease
Patricia F. Kao1, David A. Davis1, Meredith G. Banigan2, Charles R. Vanderburg2, Sudha Seshadri3, Ivana Delalle1*
1Department of Pathology and Laboratory Medicine, Boston University School of Medicine, Boston, Massachusetts, United States of America,2Advanced Tissue Research Center, Harvard NeuroDiscovery Center, Massachusetts General Hospital, Charlestown, Massachusetts, United States of America,3Department of Neurology, Boston University School of Medicine, Boston, Massachusetts, United States of America
Abstract
During the progression of Alzheimer’s disease (AD), hippocampal neurons undergo cytoskeletal reorganization, resulting in degenerative as well as regenerative changes. As neurofibrillary tangles form and dystrophic neurites appear, sprouting neuronal processes with growth cones emerge. Actin and tubulin are indispensable for normal neurite development and regenerative responses to injury and neurodegenerative stimuli. We have previously shown that actin capping protein beta2 subunit, Capzb2, binds tubulin and, in the presence of tau, affects microtubule polymerization necessary for neurite outgrowth and normal growth cone morphology. Accordingly, Capzb2 silencing in hippocampal neurons resulted in short, dystrophic neurites, seen in neurodegenerative diseases including AD. Here we demonstrate the statistically significant increase in the Capzb2 expression in the postmortem hippocampi in persons at mid-stage, Braak and Braak stage (BB) III-IV, non-familial AD in comparison to controls. The dynamics of Capzb2 expression in progressive AD stages cannot be attributed to reactive astrocytosis. Moreover, the increased expression of Capzb2 mRNA in CA1 pyramidal neurons in AD BB III-IV is accompanied by an increased mRNA expression of brain derived neurotrophic factor (BDNF) receptor tyrosine kinase B (TrkB), mediator of synaptic plasticity in hippocampal neurons. Thus, the up-regulation of Capzb2 and TrkB may reflect cytoskeletal reorganization and/or regenerative response occurring in hippocampal CA1 neurons at a specific stage of AD progression.
Citation:Kao PF, Davis DA, Banigan MG, Vanderburg CR, Seshadri S, et al. (2010) Modulators of Cytoskeletal Reorganization in CA1 Hippocampal Neurons Show Increased Expression in Patients at Mid-Stage Alzheimer’s Disease. PLoS ONE 5(10): e13337. doi:10.1371/journal.pone.0013337
Editor:Paul A. Adlard, Mental Health Research Institute and the University of Melbourne of Victoria, Australia
ReceivedJune 28, 2010;AcceptedSeptember 15, 2010;PublishedOctober 13, 2010
Copyright:ß2010 Kao et al. This is an open-access article distributed under the terms of the Creative Commons Attribution License, which permits unrestricted use, distribution, and reproduction in any medium, provided the original author and source are credited.
Funding:Patricia Kao and David Davis were supported by the National Institutes of Health grant T32 AG00015-21. The funders had no role in study design, data collection and analysis, decision to publish, or preparation of the manuscript.
Competing Interests:The authors have declared that no competing interests exist.
* E-mail: idelalle@bu.edu
Introduction
Genes implicated in the development of AD influence microtubule and actin filaments responsible for neuronal mor-phology[1]. The presence of an apolipoprotein E4 allele[2], correlates with the simplification of dendritic branching patterns in the brains of AD patients[3]. Consistent with this observation in human brains, the apolipoprotein E4 inhibits neurite outgrowth in cultured neuronal cells[4]. Interestingly, amyloid precursor protein concentrates in lamellipodia where it is proposed to play a role in growth cone motility and neurite outgrowth[5].
Upon acute neuronal injury, such as axotomy, the first critical steps that initiate regenerative response are microtubule polymer-ization and F-actin cytoskeleton rearrangement leading to the formation of a motile growth cone in a stable axonal segment[6]. Actin cytoskeleton regulator CP (F-actin capping protein, CapZ) is an a/b heterodimer that binds the barbed end of F-actin thus blocking the access of actin monomers to the fast growing end. Both mammalian andDrosophilaCP subunits play a critical role in the organization and dynamics of lamellipodia and filopodia in non-neuronal cells[7]. One of the mammalianb-subunit isoforms, Capzb2, is predominantly expressed in the brain[8]. We have
demonstrated that Capzb2 not only caps F-actin barbed end but also bindsbIII-tubulin directly, affecting the rate and the extent of microtubule polymerization in the presence of tau[9]. Moreover, Capzb2 - bIII-tubulin interaction is indispensable for normal growth cone morphology and neurite length[9].
As hyperphosphorylated tau gives rise to neurofibrillary tangles in AD, dystrophic neurites, marked by reduced length and poor branching, become apparent. In parallel, perisomatic proliferation of dendrites and sprouting of distal dystrophic neurites take place[20]. The presence of growth cone-like structures on distal ends of dystrophic neurites suggests that regenerative response accompanies degenerative cytoskeletal changes in AD[20]. These morphological changes in neurons during AD progression indicate major cytoskeletal reorganization raising the possibility that microtubules and microfilaments may represent a target for pathobiological mechanisms underlying AD. Here we report a significant increase in Capzb2 protein and mRNA levels in hippocampal CA1 pyramidal neurons at mid-stage non-familial AD (Braak and Braak, BB, stage III-IV). The up-regulation of Capzb2 at this stage is accompanied by an increase in mRNA levels of BDNF primary receptor, TrkB. BDNF/TrkB signaling modulates cell morphology and neurite length[21,22]. Our data suggest that Capzb2, a recently established link in microfilament -microtubule assembly, together with BDNF/TrkB signaling, may play a role in cytoskeletal reorganization and possibly regenerative changes at specific stages of AD progression.
Results
Capzb2 protein expression shows a specific increase in the hippocampal CA1 region in AD BB stage III-IV
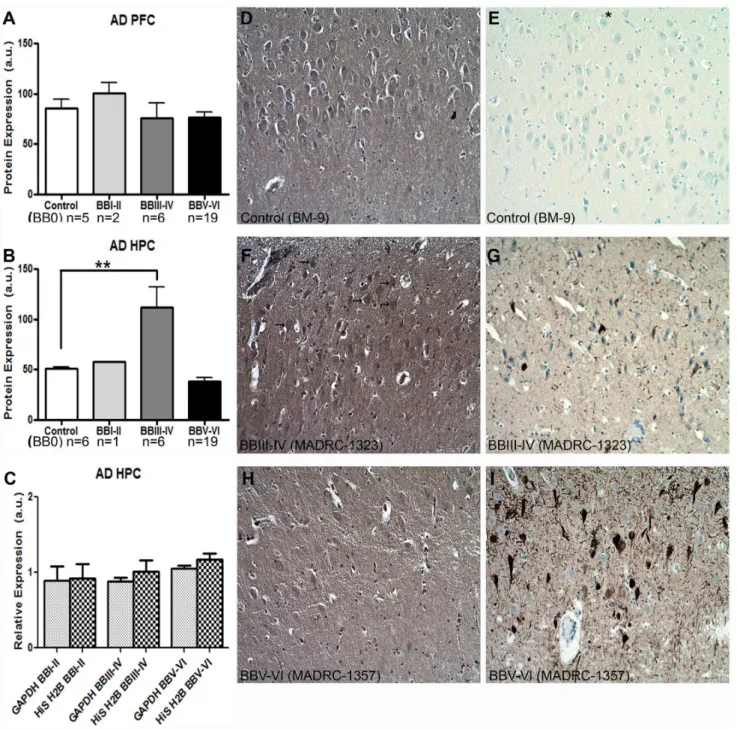
We examined Capzb2 protein expression levels in the whole tissue homogenates of hippocampal CA1 region and prefrontal cortex (Brodmann area 9) from the brains deposited at the Massachusetts Alzheimer Disease Research Center (MADRC) in the Massachusetts General Hospital and from brain autopsies performed at Boston Medical Center (BM) (Table 1). While Capzb2 expression remained steady in the prefrontal cortex (PFC) throughout progressive AD stages, it significantly increased in the hippocampal CA1 region (HPC) in BBIII-IV (p,0.01; One-way ANOVA, Figure 1A and 1B). To confirm the specificity of this increase, we examined, in addition to GAPDH (our loading control, see Western Blotsection in MATERIALS AND METH-ODS), the expression of another unrelated protein, histone H2b (His H2b) (Figure 1C). The expression of GAPDH and His H2b in the examined hippocampi in AD BBI-VI did not change significantly across stages. We further examined the Capzb2 immunoreactivity in CA1 region in control, AD BBIII-IV and AD BBV-VI cases (Figure 1D–I). As expected[9], Capzb2 immuno-reactivity was seen in cytoplasm and neuropil, and appeared most robust in the cytoplasm of pyramidal neurons in AD BBIII-IV cases (Figure 1F, arrows).
Since Capzb2 expression is not neuron-specific, we considered the possibility that the increase in Capzb2 signal might be due to reactive gliosis. We compared the number of GFAP- immunore-active astrocytes in CA1 region of BBIII-IV AD and control brains (Figure 2A, 2B, and 2C). We also examined the GFAP expression by Western Blot (Figure 2D) and by Luminex analysis using the capture sandwich immunoassay (Figure 2E). Our results suggest that the observed increase in Capzb2 expression in the CA1 region of AD BBIII-IV brains could not be attributed to an increase in GFAP-immunoreactive glial cells.
The increase in Capzb2 mRNA expression in CA1 pyramidal neurons in AD BBIII-IV is accompanied by the up-regulation of TrkB mRNA
In order to further elucidate the origin of the Capzb2 expression increase, we used laser capture microdissection (LCM) to examine a cell population particularly vulnerable to AD from the selected
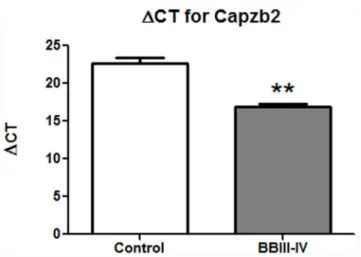
cases studied above with protein expression analysis. Visualization of hippocampal neurons prior to LCM was achieved using HistoGene stain (Figure S1). To generate cDNA for qPCR analysis, we obtained RNA from approximately 2, 000 CA1 pyramidal neurons from each of AD BBIII-IV (MADRC-912 and MADRC-1323) and control brains (BM-16 and BM-17) that had satisfactory RNA integrity numbers (RINs; Table 1, see alsoRNA quality control section in MATERIALS AND METHODS). The PCR quantification curves for control, house keeping gene 18S rRNA (Figures S2A, S3A, S3C) and for Capzb2 (Figure S2, S3B, S3D) were generated from each cDNA. Change in Cycle Threshold (DCT) between the Capzb2 and the house keeping gene 18S rRNA was calculated[23]. Two cDNA concentrations (full strength and 1:2 dilution) were used to calculateDCT in order to confirm that the obtainedDCT values were consistent with the cDNA concentrations. As duplicate samples were run, the average CT value for Capzb2 was subtracted from the average CT value for 18S rRNA, giving theDCT-Capzb2 value. The control brains’ cDNAs show higher DCT for Capzb2 than cDNAs from AD BBIII-IV brains, indicating lower expression of Capzb2 in the control brains (Figure 3).
Since the subset of CA1 pyramidal neurons in AD BB III-IV displays defining AD intraneuronal cytoskeletal abnormalities, neurofibrillary tangles (NFTs), we next examined Capzb2 mRNA expression in relation to the presence of NFTs (Figure 4). Approximately 1,500 tangled and 1,500 non-tangled CA1 pyramidal neurons from AD BBIII-IV (MADRC-1403, Table 1) and 1,500 (non-tangled) CA1 pyramidal neurons from control brains (BM16 and BM-17, Table 1) were dissected for qPCR analysis (Figures 4 and S4). The mRNA levels of Capzb2 were higher in both tangled and non-tangled neurons of the AD BBIII-IV brain compared to the controls, while similar in tangled and non-tangled neurons of the AD BBIII-IV brain (Figure 4C).
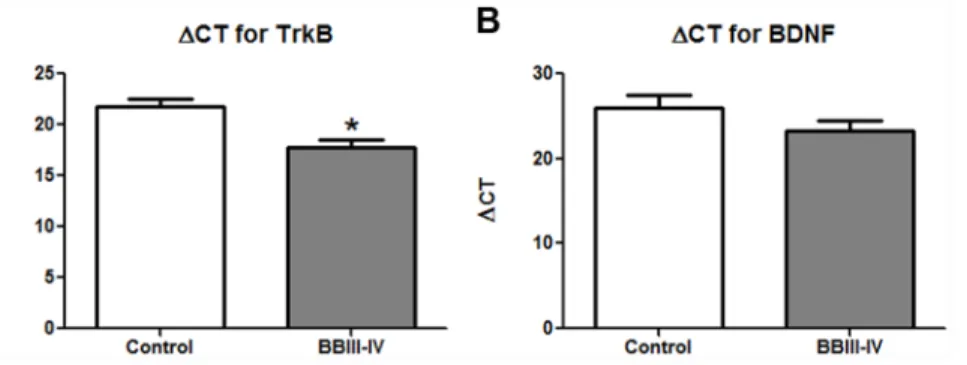
Because of their role in memory and cognition, BDNF and TrkB have been previously studied in the brains of AD patients[24–27], but without the information on Braak and Braak stage of AD associated neuropathology. Braak and Braak staging, introduced in 1997 and widely accepted thereafter, is based on the extent of cortical involvement by neurofibrillary tangles[28]. Using LCM and qPCR, we examined the expression of BDNF and TrkB mRNAs in the developing, mid-stage (BBIII-IV), rather than in the end-stage (BBVI) AD[24] (see DISCUSSION). Similar to Capzb2, the mRNA level of TrkB in the CA1 neurons in AD BBIII-IV brains was higher than that in the control brains (Figures 5 and S5).
Discussion
transgenic neurons in comparison to controls[29]. Dendritic proliferation and sprouting in human AD brain have been observed by Golgi impregnation[30] and by MAP2 and tau immunohisto-chemistry highlighting growth cones present both in perisomatic dendrites and in distal, dystrophic neurites[20]. Thus, an AD transgenic model and a human diseased brain share the hallmark of cytoskeletal reorganization underlying degenerative (dystrophic neurites) as well as regenerative changes (sprouting of processes and the presence of growth cones).
Here we report an increase in the expression of Capzb2, a protein necessary for normal growth cone morphology and neurite length[9], specifically in the hippocampal CA1 region at mid-stage AD (BBIII-IV) (Figure 1). This increase in Capzb2 expression
could not have been aided by the astrocytic gliosis was less prominent in AD BBIII-IV brains than in control brains (Figure 2). Consistent with our findings are previously reported GFAP mRNA age-related increase in archi- and neo-cortex of both rats and humans[31]and widespread astrocytic gliosis in both Alzhei-mer’s and normal aging cerebrum[32]. Important for our analysis was the definition of normal, ‘‘control’’ cases considering that the cognitive function appears to be degraded in the non-demented individuals who do exhibit AD- related neuropathological changes[33]. We performed tau immunohistochemistry on all of the studied hippocampal blocks and considered as controls only those without any neurofibrillary tangles (BB 0; Figures 1, 2, and data not shown).
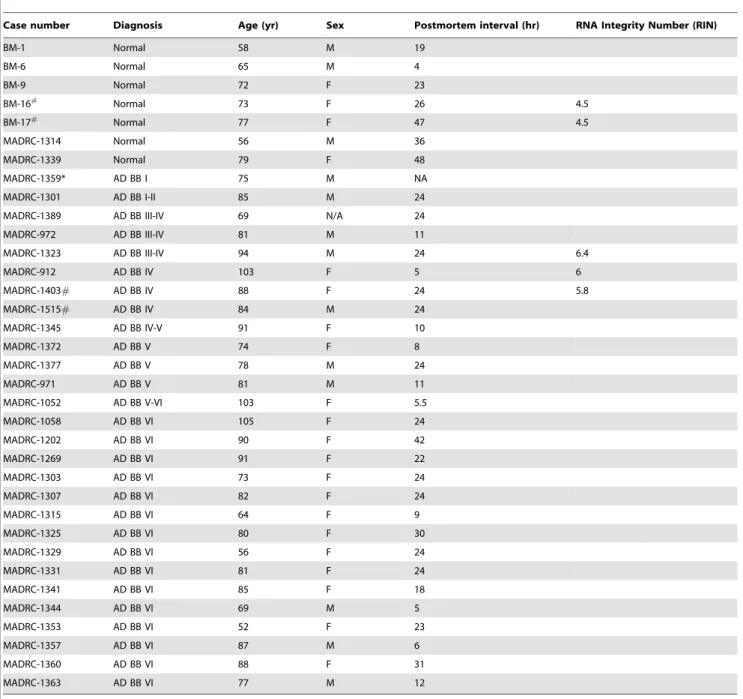
Table 1.Analyzed human autopsy brains.
Case number Diagnosis Age (yr) Sex Postmortem interval (hr) RNA Integrity Number (RIN)
BM-1 Normal 58 M 19
BM-6 Normal 65 M 4
BM-9 Normal 72 F 23
BM-16#
Normal 73 F 26 4.5
BM-17#
Normal 77 F 47 4.5
MADRC-1314 Normal 56 M 36
MADRC-1339 Normal 79 F 48
MADRC-1359* AD BB I 75 M NA
MADRC-1301 AD BB I-II 85 M 24
MADRC-1389 AD BB III-IV 69 N/A 24
MADRC-972 AD BB III-IV 81 M 11
MADRC-1323 AD BB III-IV 94 M 24 6.4
MADRC-912 AD BB IV 103 F 5 6
MADRC-1403# AD BB IV 88 F 24 5.8
MADRC-1515# AD BB IV 84 M 24
MADRC-1345 AD BB IV-V 91 F 10
MADRC-1372 AD BB V 74 F 8
MADRC-1377 AD BB V 78 M 24
MADRC-971 AD BB V 81 M 11
MADRC-1052 AD BB V-VI 103 F 5.5
MADRC-1058 AD BB VI 105 F 24
MADRC-1202 AD BB VI 90 F 42
MADRC-1269 AD BB VI 91 F 22
MADRC-1303 AD BB VI 73 F 24
MADRC-1307 AD BB VI 82 F 24
MADRC-1315 AD BB VI 64 F 9
MADRC-1325 AD BB VI 80 F 30
MADRC-1329 AD BB VI 56 F 24
MADRC-1331 AD BB VI 81 F 24
MADRC-1341 AD BB VI 85 F 18
MADRC-1344 AD BB VI 69 M 5
MADRC-1353 AD BB VI 52 F 23
MADRC-1357 AD BB VI 87 M 6
MADRC-1360 AD BB VI 88 F 31
MADRC-1363 AD BB VI 77 M 12
*only PFC tissue was available; #
The protein expression analysis of the CA1 region is supported by the data on Capzb2 mRNA expression in hippocampal CA1 neurons obtained via LCM (Figure 3). Several pathologic features of AD make cell population expression profiling a rational alternative to whole brain homogenates: 1) defined vulnerable neuronal populations; 2) distinct intracellular abnormalities found in some but not all of the cells; and 3) the poor understanding of the
relationship between the presence of distinct extra- and intra-cellular abnormalities and neuronal function and survival. The importance of cell population expression profiles is in their potential to identify new rational targets for pharmacotherapeutic interven-tions in progressive neurodegenerative disorders such as AD. Mature brain derived neurotrophic factor or BDNF shows high-affinity binding to the neurotrophic tyrosine kinase receptor TrkB.
Figure 1. Capzb2 protein expression changes specifically in the hippocampal CA1 region (HPC) during progression of AD.(A) Capzb2 protein levels in PFC do not change significantly during the progressive stages of AD in comparison to control cases; (B) Capzb2 protein levels in HPC in AD BBIII-IV are significantly increased in comparison to control brains (**p,0.01, One-way ANOVA with subsequent Tukey’s test); (C) when normalized to the expression in control brains, two unrelated proteins used as loading controls (GAPDH and histone H2b, His H2b) do not differ significantly in their level of expression in the hippocampal CA1 region regardless of the AD stage. Hippocampal sections of the representative cases form the progressive AD stages were processed for Capzb2 (D,F,H) and tau immunohistochemistry (E,G,I). As the AD progresses, neurofibrillary tangles highlighted by tau immunohistochemistry accumulate (E,G,I). and the density of CA1 pyramidal neurons decreases (D–I). Capzb2 signal is seen in the cytoplasms and neuropil, and appears stronger in AD BBIII-IV stage (arrows,F) in comparison to both normal control (BB 0;D) and advanced disease (AD BBV-VI;H). The asterisk in E indicates the direction of pial surface inD–I.
The molecular basis for new learning is a rapid effect on synaptic transmission (short-term memory) followed by persistent changes, such as long-term potentiation, across neuronal synapses (synaptic plasticity) that consolidate long-term memories. BDNF appears to facilitate both synaptic transmission and long-term potentiation in glutamergic hippocampal synapses acting through post-synaptic TrkB receptors[34]. Conditional knock-out mice lacking forebrain TrkB and mice treated with blocking antibodies to hippocampal BDNF[35] show decreased development of LTP and impaired learning. Animal studies suggest that asb-amyloid accumulates in the hippocampus, it interferes with the normal function of BDNF[36]. One clinical study suggested that patients with AD have low whereas those with mild cognitive impairment (a stage preceding clinical dementia) had intermediate BDNF levels compared to normal controls[37]; others have suggested raised BDNF levels in early AD[38,39]. A well-documented role of BDNF/TrkB signaling in memory formation and retention via cytoskeletal reorganization[16,17] has been driving the interest in studying the expression of these molecules in relation to AD pathological hallmarks[24]. Using immunohistochemical
double-labeling, Fujimura et al. (2010) showed that the number of tangled neurons that expressed BDNF was similar in AD and controls[24]. In the same study, quantitative RT-PCR analysis of AD and control hippocampal neurons, revealed that the expressions of BDNF and TrkB in AD were equally low in Ab-containing and Ab-free neurons and lower than that in control brains[24]. Importantly, the three AD cases examined were all in advanced BB stages (VI, VI, and V). Considering that a fully developed neurodegenerative process may obscure the mechanisms driving the disease progres-sion, we examined the expression of BDNF and TrkB mRNAs in mid-stage AD (BBIII-IV) when Capzb2 was specifically up-regulated (Figure 1, 2, 3, and 4). Similar to Capzb2, the expression of TrkB in hippocampal CA1 neurons in AD BBIII-IV hippocampi was higher than that in the control (Figure 5). Importantly, our control hippocampi did not contain neurofibrillary tangles or dystrophic neurites (Figure 4A) whereas the three cases used as controls by Fujimura at al. (2010) did demonstrate AD-related changes: two brains were categorized as BBI and one as BBII[24]. Understanding the role of BDNF/TrkB signaling in AD pathogenesis could be of great clinical and public health
Figure 2. Reactive astrogliosis in CA1 region of AD BBIII-IV does not contribute to the increased Capzb2 expression.The number of GFAP positive cells (A–C; bar inA, B = 50mm), as well as the analysis of GFAP signal by Western Blot (D) and by Luminex capture sandwich immunoassay (E) indicate more reactive astrogliosis in control than in AD BB III-IV brains.
importance since BDNF is inducible and may be one of the key molecules mediating the beneficial effect of certain lifestyle measures (lower caloric intake, increased aerobic physical activity, environmental enrichment)[40–42]on the risk of developing dementia. These modifiable environmental interventions increase brain and serum BDNF levels[43–46]. Aerobic exercise for example induces both short-term and longer-term increases in circulating BDNF levels, in parallel with improvements in memory performance[47].
Our study shows that the expression of TrkB and Capzb2 mRNAs in hippocampal CA1 pyramidal neurons during mid-stage AD (BBIII-IV) is up-regulated in comparison to the control hippocampus containing no AD- related cytoskeletal abnormalities (Figure 3, 4, and 5). Similar levels of Capzb2 mRNA expression in tangled and non-tangled neurons in mid-stage AD (Figure 4) support the observations that both populations undergo cytoskel-etal reorganization that includes regenerative changes[20,30]. It is conceivable that the progression of AD and concomitant cytoskeletal reorganization is accompanied by the expression of molecular markers of endogenous neuronal resistance to degen-eration and/or molecular markers of regendegen-eration. The expression of these markers may reflect neuronal changes associated with regeneration and possibly memory performance warranting future
Figure 3. Capzb2 mRNA expression in CA1 pyramidal neurons of AD BBIII-IV is increased in comparison to control. Control brains (BM-16 and BM-17) cDNA shows higherDCT for Capzb2 gene than for the average of two AD BBIII-IV brains (912 and MADRC-1323); **p,0.01, Student’s t test.
doi:10.1371/journal.pone.0013337.g003
Figure 4. Capzb2 mRNA expression in CA1 pyramidal neurons is increased in AD BBIII-IV regardless of NFTs presence.NFTs are absent from the population of pyramidal neurons dissected from the control CA1 region (A), whereas moderate number of tangles are found in the pyramidal neurons dissected from AD BBIII-IV CA1 region (B; both tangled and non-tangled neurons as well as numerous dystrophic neurites are present). (C) cDNA of control CA1 pyramidal (non-tangled) neurons shows higherDCT value than the cDNAs from either tangled or non-tangled CA1 pyramidal neurons from AD BBIII-IV brain (**p,0.01; One-way ANOVA with subsequent Tukey’s test); tangled and non-tangled CA1 pyramidal neurons at AD BBIII-IV have similarDCT values.
correlation studies with the cognitive status information in individual AD patients.
Methods
Ethics Statement
The Institutional Review Board at Boston University School of Medicine provided an exemption for the protocol describing research on postmortem human brain tissue analyzed in this study. We examined the hippocampal CA1 region (HPC) and the prefrontal cortex (PFC, Brodmann area 9) available from the brains deposited at Massachusetts Alzheimer Disease Research Center (MADRC) at Massachusetts General Hospital and from brain autopsies performed at Boston Medical Center (BM), (Table 1).
Immunohistochemistry
Hippocampal blocks (level of lateral geniculate nucleus) were fixed in 4% paraformaldehyde and embedded in paraffin. For detection of Capzb2 signal in hippocampal CA1 neurons, 10-mm sections were incubated with an affinity isolated anti-CAPZB antibody produced in rabbit (designed for immunohistochemistry application, Sigma-Aldrich, 1:100) for 30 min at RT, washed in phosphate buffered saline (pH 7.4; PBS), incubated with a secondary antibody (Universal HRP multimer containing cocktail of HRP labeled goat anti-rabbit) and visualized by DAB (Figure 1D, 1F, 1H). For the detection of reactive astrocytes, sections were incubated with a rabbit polyclonal anti-GFAP antibody (1: 2,000, Dako) overnight at 4uC, washed in PBS, incubated with a secondary antibody (Universal HRP multimer containing cocktail of HRP labeled goat anti-rabbit) and visualized by DAB (Figure 2A and 2B). Tiled images (470mm6470mm) were acquired from the CA1 region under the 20x magnification. GFAP- immunoreactive astrocytes were counted in 20 tiled images from the CA1 region (a total area of 4.42 mm2).
For the detection of neurofibrillary tangles (Figure 1E, 1G, 1I, 4A and 4B), paraffin sections were incubated with anti-tau antibody (rabbit polyclonal, 1: 5,000, Dako, or mouse monoclonal, PHF-1, 1:1,000; a gift from Dr. Peter Davies) overnight at 4uC, washed with PBS, incubated with a secondary antibody incubation (Super Sensitive Link Label IHC Detection Systems kit, Biogenex) and visualized by DAB. Slides were counterstained with hematoxylin and dehydrated with ethanol and xylene. Before laser capturing to obtain neurons for qPCR analysis in Figure 4, 10-mm frozen sections were incubated with the same anti-tau
antibody (PHF-1, 1:50) for 10 min on ice, washed with PBS,
incubated with anti-mouse IgG HRP (Pierce, 1:50) for 10 min and visualized by DAB. Slides were counterstained with hematoxylin and dehydrated with ethanol and xylene.
Western Blot
The whole tissue lysates of hippocampal CA1 regions were prepared in RIPA buffer containing protease inhibitors (Roche). The final protein concentration of the lysates were determined by BCA assay. Lysates were subjected to SDS-PAGE and immuno-blotting with anti-Capzb2 (DSHB, 1: 1,000), anti-GFAP (Sigma, 1: 1,500), anti-histone H2B (Abcam, 1: 2,000), and anti-GAPDH (Ambion, 1:10,000) using appropriate secondary HRP-conjugated antibodies at 1:5,000 (Santa Cruz) (6 repetitions). A chemilumi-nescent detection system (Pierce) was used to visualize protein expression on an electronic capture imager (Kodak). Densitometry measurements were performed using ImageJ version 1.37v software (National Institutes of Health). For Capzb2 expression, values were calculated as (intensity x area of Capzb2 signal)/ (intensity x area of GAPDH signal) (Figure 1A and 1B). In Figure 1C the expressions (intensity x area of signal) of two unrelated proteins (GAPDH and Histone H2b) in each BB group were normalized to their expressions in the control group.
Luminex analysis
A mouse monocolonal GFAP antibody (GFAP mAb, 25mg, Sigma) was coupled to 1.25 million Microplex microspheres 133 (Luminex) using EDC (Thermo Scientific) and Sulfo-NHS (Thermo Scientific) as directed by the manufacturer protocol. A rabbit polyclonal GFAP antibody (GFAP pAb, 145mg, Dako) was coupled to biotin using EZ-link Sulfo-NHS-LC-Biotin reagent (Pierce) as directed by the manufacturer protocol. Brain lysates (0.5mg/50ml) were incubated with 50ml of GFAP
mAb-microspheres (100 MS/ml) in a 100ml reaction for 30 min at
room temperature (RT) in a 1.2mm filter plate (Millipore) with
agitation. The GFAP mAb-microspheres were washed twice with PBS-1%BSA and resuspended in 50ml PBS-1% BSA. 50 ul of
GFAP pAb-biotin (50ml, 1mg/ml) was then added and the
mixture was incubated at RT for 30 min. Microspheres were then washed twice, resuspended in 50ml PBS-1% BSA and 50ml of
Streptavidin-R-phycoerythrin reporter (Invitrogen) (4mg/ml), and incubated for 30 min at RT. Upon another wash, the microsphere complexes were resuspended in 100ml of PBS-1% BSA and analyzed on a Luminex 200. GFAP expression was reported as the mean fluorescence signal per 100 microspheres. The assay was performed three times.
Figure 5. The expression of TrkB mRNAs in CA1 pyramidal neurons of AD BBIII-IV is increased in comparison to control.The cDNA from two control brains (BB0; BM-16 and BM-17) CA1 pyramidal neurons has higherDCT value for TrkB (A) in comparison to the average of two AD BBIII-IV (MADRC-912 and MADRC-1323) values indicating lower amount of TrkB mRNA; *p,0.05, Student’s t test. BDNF mRNA levels in the examined AD BB III-IV cases are not significantly different from those found in control cases (B).
RNA quality control
We have examined the RNA quality of the hippocampal blocks used for LCM and subsequent qPCR analysis by the commonly accepted quantitative digital analysis of Agilent 2100 Bioanalyzer generated electropherograms. The resulting RNA Integrity Number (RIN) of 1 (poor) to 10 (best) is obtained based on the presence and ratio of the 5S, 18S and 28S ribosomal RNA peaks in a sample of total cellular RNA. Banked postmortem brain tissues across institutions have been reported to display range of RIN values from 2.9 to 9.2 (mean = 6.8+/21.0)[48]. We have found that even partially degraded RNA with a RIN value of 3.1 shows fairly well preserved mRNA profile (unpublished data). The hippocampi used for qPCR displayed RIN values from 4.5 to 6.4 (Table 1).
Laser Capture Microdissection (LCM)
In preparation for LCM, frozen blocks of the hippocampal tissue (level of the lateral geniculate) were oriented and affixed to cryotome chucks with OCT embedding compound. Ten mm
cryosections were stained to visualize cells (Figure S1). We found that approximately 2,000 CA1 pyramidal neurons yielded enough cDNA for qPCR of four genes (our genes of interest - Capzb2, BDNF, TrkB - and housekeeping gene, 18S rRNA). Veritas LCM system was used to collect CA1 pyramidal neurons onto optically clear collecting caps that contain a thin plastic film impregnated with a laser sensitive dye. Caps were placed over the area of interest and illuminated with a monochromatic IR laser pulse which selectively heats the plastic/dye combination at a set size (sizes are set anywhere between a diameter of 4 and 50mm) and
lifts the precisely microdissected underlying tissue when the cap is lifted. The isolated material was viewed to verify its integrity before RNA extraction. For the visualization of neurons, each section was lightly fixed in 70% ethanol (EtOH), rinsed with RNase-free dH2O, incubated in HistoGene stain solution (MDS Analytical Technologies), and dehydrated in ethanol solutions and xylene. For the visualization of neurofibrillary tangles, see Immunohisto-chemistrysection. After neurons were collected, RNA was prepared using the Arcturus picopure RNA isolation system (Arcturus, MDS Analytical Technologies). Briefly, plastic LCM collecting caps with captured neurons were incubated at 42uC for 30 minutes in 25ml of GITC-containing extraction buffer. After brief centrifugation, tubes containing the extraction buffer were frozen at -80uC. Samples are thawed and pooled prior to purification on Picopure RNA columns. The RNAs from the cell homogenate were attached to the column filter. After DNase treatment, genomic DNA was removed. Total cellular RNA from each column was eluted in 12ml of elution buffer. RNA was converted into cDNAs using a 20ml total reaction volume via the Standard Superscript
III (Invitrogen) protocol for qPCR analysis.
Primer design and qPCR analysis
For Capzb2 PCR, multiple pairs of primers were generated by the Primer3 software and produced by Invitrogen. The PCR products obtained with these primers were tested in Bioanalzyer gel and Bioanalzyer Electropherograms (Figure S2). The successful Capzb2 primers (forward: gcaaatcgagaaaaacctca; reverse: ctccaagggagggtcatact) were used in qPCR analysis. Similarly, successful primers for BDNF (forward: cagctgccttgatggttact; reverse: ccaatgatgtcaagcctctt) and TrkB (forward: ggacgtgtacag-cactgact; reverse: tgccataggtgaaaatctcc) were obtained. All the primers were tested using standard cDNA from normal human brain as template provided by ATRC Reagent Bank. The Bank also provided primers for PCR of 18S rRNA, a house keeping gene often used as an internal control.
Statistical analysis
One way ANOVA analysis was performed in multiple groups comparisons (Figure 1 and 4C) except for the comparison between the control group and BB stage I-II in Figure 1B where Student’s t test was performed because of only one hippocampus specimen (Table 1). Student’s t test was also performed in the rest of the statistical analysis where two groups/samples were compared (Figure 2C, 2D, 2E, 3, 4C, and 5).
Supporting Information
Figure S1 Hippocampal CA1 region prepared for LCM of pyramidal neurons. Visualization of the cells using HistoGene stain at 2x (A: area magnified from the red square on the insert) and 20x (B: pyramidal neurons are identified for capturing by LCM).
Found at: doi:10.1371/journal.pone.0013337.s001 (3.54 MB TIF)
Figure S2 Bioanalyzer gel of PCR products obtained with primers for Capzb2 and 18S rRNA genes (A) and electrophero-gram for Capzb2 PCR product (B). The bioanalyzer gel indicates the correct sizes of PCR products: Capzb2 -198 bp, and 18S rRNA -177 bp. The electropherogram shows the number of fluorescent units (FU) on the Y axis that corresponds with each bp size on the X axis. The highest peak is at 198 bp (the correct size of Capzb2 PCR product).
Found at: doi:10.1371/journal.pone.0013337.s002 (1.45 MB TIF)
Figure S3 qPCRs for 18S rRNA (A, C) and Capzb2 (B, D). These figures complement Figure 3. The Y axis shows the amplification and the X axis shows the number of cycles. Each line traces the amplification of either full strength or 1:2 diluted cDNA from analyzed cases: BM-16 (control, BB0), BM-17 (control, BB0), MADRC-912 (AD BBIII-IV), and MADRC-1323 (AD BBIII-IV). Reactions with dilutions of each cDNA were run in duplicates. qPCRs for 18S rRNA for control cases (A) show control case BM-16 in navy (full strength) and blue (1:2 dilution) and control case BM-17 in dark green (full strength) and light green (1:2 dilution). The same shades are used for Capzb2 qPCRs in those cases (B). qPCRs in AD BBIII-IV cases for 18S rRNA (C) and for Capzb2 (D) show AD BBIV case MADRC-912 in navy (full strength) and blue (1:2 dilution); AD BBIII-IV case MADRC-1323 is shown in dark green (full strength) and light green (1:2 dilution).
Found at: doi:10.1371/journal.pone.0013337.s003 (1.67 MB TIF)
Figure S4 qPCRs for 18S rRNA (A, B) and Capzb2 (C, D). These figures complement Figure 4. Each line traces the amplification of either full strength or 1:2 diluted cDNA (shades of the same color; in duplicates) in non-tangled neurons from control (BB0) cases BM-16 (full strength -navy; 1:2 dilution -blue) and BM-17 (full strength -dark green; 1:2 dilution -light green) for 18S rRNA (A) and Capzb2 (C). qPCRs for 18S rRNA in tangled neurons from AD BBIV case MADRC-1403 is in navy (full strength) and blue (1:2 dilution) and in non-tangled neurons from the same section in dark green (full strength) and light green (1:2 dilution) (B). qPCRs for Capzb2 in tangled (full strength -navy; 1:2 dilution -blue) and non-tangled (full strength -dark green; 1:2 dilution -light green) neurons of AD BBIV case MADRC-1403 (D).
Found at: doi:10.1371/journal.pone.0013337.s004 (1.71 MB TIF)
and BM-17) and AD BBIII-IV cases (912 and MADRC-1323). Reactions with dilutions of each cDNA were run in duplicates. Navy (full strength) and blue (1:2 dilution) labelings are used for amplicons from control case BM-16 (A, B, E, F) and from AD BBIV case MADRC-912 (C, D, G, H). Shades of green are amplicons from control case BM-17 (A, B, E, F) and from AD BBIV case MADRC-1323 (C, D, G, H) (full strength -dark green; 1:2 dilution -light green).
Found at: doi:10.1371/journal.pone.0013337.s005 (3.43 MB TIF)
Author Contributions
Conceived and designed the experiments: PFK CRV SS ID. Performed the experiments: PFK DAD MGB. Analyzed the data: PFK DAD CRV SS ID. Contributed reagents/materials/analysis tools: CRV ID. Wrote the paper: ID.
References
1. McMurray CT (2000) Neurodegeneration: diseases of the cytoskeleton? Cell Death Differ 7: 861–865.
2. Li Y, Grupe A (2007) Genetics of late-onset Alzheimer’s disease: progress and prospect. Pharmacogenomics 8: 1747–1755.
3. Arendt T, Schindler C, Bruckner MK, Eschrich K, Bigl V, et al. (1997) Plastic neuronal remodeling is impaired in patients with Alzheimer’s disease carrying apolipoprotein epsilon 4 allele. J Neurosci 17: 516–529.
4. Nathan BP, Chang KC, Bellosta S, Brisch E, Ge N, et al. (1995) The inhibitory effect of apolipoprotein E4 on neurite outgrowth is associated with microtubule depolymerization. J Biol Chem 270: 19791–19799.
5. Sabo SL, Ikin AF, Buxbaum JD, Greengard P (2003) The amyloid precursor protein and its regulatory protein, FE65, in growth cones and synapses in vitro and in vivo. J Neurosci 23: 5407–5415.
6. Spira ME, Oren R, Dormann A, Gitler D (2003) Critical calpain-dependent ultrastructural alterations underlie the transformation of an axonal segment into a growth cone after axotomy of cultured Aplysia neurons. J Comp Neurol 457: 293–312.
7. Mejillano MR, Kojima S, Applewhite DA, Gertler FB, Svitkina TM, et al. (2004) Lamellipodial versus filopodial mode of the actin nanomachinery: pivotal role of the filament barbed end. Cell 118: 363–373.
8. Schafer DA, Korshunova YO, Schroer TA, Cooper JA (1994) Differential localization and sequence analysis of capping protein beta-subunit isoforms of vertebrates. J Cell Biol 127: 453–465.
9. Davis DA, Wilson MH, Giraud J, Xie Z, Tseng HC, et al. (2009) Capzb2 interacts with beta-tubulin to regulate growth cone morphology and neurite outgrowth. PLoS Biol 7: e1000208.
10. Nelson TJ, Backlund PS, Jr., Alkon DL (2004) Hippocampal protein-protein interactions in spatial memory. Hippocampus 14: 46–57.
11. Kitanishi T, Sakai J, Kojima S, Saitoh Y, Inokuchi K, et al. (2010) Activity-dependent localization in spines of the F-actin capping protein CapZ screened in a rat model of dementia. Genes Cells 15: 737–747.
12. Linnarsson S, Bjorklund A, Ernfors P (1997) Learning deficit in BDNF mutant mice. Eur J Neurosci 9: 2581–2587.
13. Schaaf MJ, Workel JO, Lesscher HM, Vreugdenhil E, Oitzl MS, et al. (2001) Correlation between hippocampal BDNF mRNA expression and memory performance in senescent rats. Brain Res 915: 227–233.
14. Croll SD, Ip NY, Lindsay RM, Wiegand SJ (1998) Expression of BDNF and trkB as a function of age and cognitive performance. Brain Res 812: 200–208. 15. Wu A, Ying Z, Gomez-Pinilla F (2008) Docosahexaenoic acid dietary supplementation enhances the effects of exercise on synaptic plasticity and cognition. Neuroscience 155: 751–759.
16. Rex CS, Lin CY, Kramar EA, Chen LY, Gall CM, et al. (2007) Brain-derived neurotrophic factor promotes long-term potentiation-related cytoskeletal changes in adult hippocampus. J Neurosci 27: 3017–3029.
17. Lu Y, Christian K, Lu B (2008) BDNF: a key regulator for protein synthesis-dependent LTP and long-term memory? Neurobiol Learn Mem 89: 312–323. 18. Goutan E, Marti E, Ferrer I (1998) BDNF, and full length and truncated TrkB
expression in the hippocampus of the rat following kainic acid excitotoxic damage. Evidence of complex time-dependent and cell-specific responses. Brain Res Mol Brain Res 59: 154–164.
19. Avwenagha O, Campbell G, Bird MM (2003) Distribution of GAP-43, beta-III tubulin and F-actin in developing and regenerating axons and their growth cones in vitro, following neurotrophin treatment. J Neurocytol 32: 1077–1089. 20. McKee AC, Kowall NW, Kosik KS (1989) Microtubular reorganization and dendritic growth response in Alzheimer’s disease. Ann Neurol 26: 652–659. 21. Miyamoto Y, Yamauchi J, Tanoue A, Wu C, Mobley WC (2006) TrkB binds
and tyrosine-phosphorylates Tiam1, leading to activation of Rac1 and induction of changes in cellular morphology. Proc Natl Acad Sci U S A 103: 10444–10449. 22. Luo L (2000) Rho GTPases in neuronal morphogenesis. Nat Rev Neurosci 1:
173–180.
23. Gutala RV, Reddy PH (2004) The use of real-time PCR analysis in a gene expression study of Alzheimer’s disease post-mortem brains. J Neurosci Methods 132: 101–107.
24. Fujimura RK, Reiner T, Ma F, Phillips V, de las Pozas A, et al. Changes in the expression of genes associated with intraneuronal amyloid-beta and tau in Alzheimer’s disease. J Alzheimers Dis 19: 97–109.
25. Phillips HS, Hains JM, Armanini M, Laramee GR, Johnson SA, et al. (1991) BDNF mRNA is decreased in the hippocampus of individuals with Alzheimer’s disease. Neuron 7: 695–702.
26. Connor B, Young D, Yan Q, Faull RL, Synek B, et al. (1997) Brain-derived neurotrophic factor is reduced in Alzheimer’s disease. Brain Res Mol Brain Res 49: 71–81.
27. Connor B, Young D, Lawlor P, Gai W, Waldvogel H, et al. (1996) Trk receptor alterations in Alzheimer’s disease. Brain Res Mol Brain Res 42: 1–17. 28. Braak H, Braak E (1997) Diagnostic criteria for neuropathologic assessment of
Alzheimer’s disease. Neurobiol Aging 18: S85–88.
29. Moolman DL, Vitolo OV, Vonsattel JP, Shelanski ML (2004) Dendrite and dendritic spine alterations in Alzheimer models. J Neurocytol 33: 377–387. 30. Scheibel AB (1979) Dendritic changes in senile and presenile dementias. Res
Publ Assoc Res Nerv Ment Dis 57: 107–124.
31. Nichols NR, Day JR, Laping NJ, Johnson SA, Finch CE (1993) GFAP mRNA increases with age in rat and human brain. Neurobiol Aging 14: 421–429. 32. Beach TG, Walker R, McGeer EG (1989) Patterns of gliosis in Alzheimer’s
disease and aging cerebrum. Glia 2: 420–436.
33. Price JL, McKeel DW, Jr., Buckles VD, Roe CM, Xiong C, et al. (2009) Neuropathology of nondemented aging: presumptive evidence for preclinical Alzheimer disease. Neurobiol Aging 30: 1026–1036.
34. Suzuki S, Numakawa T, Shimazu K, Koshimizu H, Hara T, et al. (2004) BDNF-induced recruitment of TrkB receptor into neuronal lipid rafts: roles in synaptic modulation. J Cell Biol 167: 1205–1215.
35. Alonso M, Vianna MR, Depino AM, Mello e Souza T, Pereira P, et al. (2002) BDNF-triggered events in the rat hippocampus are required for both short- and long-term memory formation. Hippocampus 12: 551–560.
36. Poon WW, Blurton-Jones M, Tu CH, Feinberg LM, Chabrier MA, et al. (2009) beta-Amyloid impairs axonal BDNF retrograde trafficking. Neurobiol Aging Jun 18;Available: doi:10.1016/j.neurobiolaging.2009.05.012.
37. Peng S, Wuu J, Mufson EJ, Fahnestock M (2005) Precursor form of brain-derived neurotrophic factor and mature brain-brain-derived neurotrophic factor are decreased in the pre-clinical stages of Alzheimer’s disease. J Neurochem 93: 1412–1421.
38. Angelucci F, Spalletta G, di Iulio F, Ciaramella A, Salani F, et al. (2010) Alzheimer’s disease (AD) and Mild Cognitive Impairment (MCI) patients are characterized by increased BDNF serum levels. Curr Alzheimer Res 7: 15–20. 39. Laske C, Stransky E, Leyhe T, Eschweiler GW, Wittorf A, et al. (2006) Stage-dependent BDNF serum concentrations in Alzheimer’s disease. J Neural Transm 113: 1217–1224.
40. Verghese J, Lipton RB, Katz MJ, Hall CB, Derby CA, et al. (2003) Leisure activities and the risk of dementia in the elderly. N Engl J Med 348: 2508–2516. 41. Larson EB, Wang L, Bowen JD, McCormick WC, Teri L, et al. (2006) Exercise is associated with reduced risk for incident dementia among persons 65 years of age and older. Ann Intern Med 144: 73–81.
42. Pasinetti GM, Zhao Z, Qin W, Ho L, Shrishailam Y, et al. (2007) Caloric intake and Alzheimer’s disease. Experimental approaches and therapeutic implications. Interdiscip Top Gerontol 35: 159–175.
43. Knaepen K, Goekint M, Heyman EM, Meeusen R (2010) Neuroplasticity -exercise-induced response of peripheral brain-derived neurotrophic factor: a systematic review of experimental studies in human subjects. Sports Med 40: 765–801.
44. Rossi C, Angelucci A, Costantin L, Braschi C, Mazzantini M, et al. (2006) Brain-derived neurotrophic factor (BDNF) is required for the enhancement of hippocampal neurogenesis following environmental enrichment. Eur J Neurosci 24: 1850–1856.
45. Duan W, Lee J, Guo Z, Mattson MP (2001) Dietary restriction stimulates BDNF production in the brain and thereby protects neurons against excitotoxic injury. J Mol Neurosci 16: 1–12.
46. Kuzumaki N, Ikegami D, Tamura R, Sasaki T, Niikura K, et al. (2010) Hippocampal epigenetic modification at the doublecortin gene is involved in the impairment of neurogenesis with aging. Synapse 64: 611–616.
47. Berchtold NC, Castello N, Cotman CW (2010) Exercise and time-dependent benefits to learning and memory. Neuroscience 167: 588–597.