AMTD
5, 1003–1027, 2012A new algorithm for brown and black carbon identification
F. Esposito et al.
Title Page
Abstract Introduction
Conclusions References
Tables Figures
◭ ◮
◭ ◮
Back Close
Full Screen / Esc
Printer-friendly Version Interactive Discussion
Discussion
P
a
per
|
Dis
cussion
P
a
per
|
Discussion
P
a
per
|
Discussio
n
P
a
per
|
Atmos. Meas. Tech. Discuss., 5, 1003–1027, 2012 www.atmos-meas-tech-discuss.net/5/1003/2012/ doi:10.5194/amtd-5-1003-2012
© Author(s) 2012. CC Attribution 3.0 License.
Atmospheric Measurement Techniques Discussions
This discussion paper is/has been under review for the journal Atmospheric Measurement Techniques (AMT). Please refer to the corresponding final paper in AMT if available.
A new algorithm for brown and black
carbon identification and organic carbon
detection in fine atmospheric aerosols by
a multi-wavelength Aethalometer
F. Esposito1, M. R. Calvello2, E. Gueguen2, and G. Pavese2
1
CNISM – Unit `a di ricerca di Potenza, Universit `a della Basilicata, Viale dell’Ateneo Lucano no. 10, 85100 Potenza, Italy
2
Consiglio Nazionale delle Ricerche-Istituto di Metodologie per l’Analisi Ambientale (CNR-IMAA), C. da S. Loja, 85050 Tito Scalo, Potenza, Italy
Received: 11 January 2012 – Accepted: 20 January 2012 – Published: 1 February 2012 Correspondence to: F. Esposito ([email protected])
AMTD
5, 1003–1027, 2012A new algorithm for brown and black carbon identification
F. Esposito et al.
Title Page
Abstract Introduction
Conclusions References
Tables Figures
◭ ◮
◭ ◮
Back Close
Full Screen / Esc
Printer-friendly Version Interactive Discussion
Discussion
P
a
per
|
Dis
cussion
P
a
per
|
Discussion
P
a
per
|
Discussio
n
P
a
per
|
Abstract
A novel approach for the analysis of aerosol absorption coefficient measurements is presented. A 7-wavelenghts aethalometer has been employed to identify brown car-bon (BrC) and black carcar-bon (BC) and to detect organic carcar-bon (OC) in fine atmospheric aerosols (PM2.5). The Magee Aethalometer estimates the BC content in atmospheric
5
particulate by measuring the light attenuation in the aerosols accumulated on a quartz filter, at the standard wavelengthλ=0.88 µm. The known Magee algorithm is based on the hypothesis of a mass absorption coefficient inversely proportional to the wave-length. The new algorithm has been developed and applied to the whole spectral range; it verifies the spectral absorption behavior and, thus, it distinguishes between
10
black and brown carbon. Moreover, it allows also to correct the absorption estimation at the UV wavelength commonly used to qualitatively detect the presence of mixed hy-drocarbons. The algorithm has been applied to data collected in Agri Valley, located in Southern Italy, where torched crude oil undergoes a pre-treatment process.
The Magee Aethalometer has been set to measure Aerosol absorption coefficients
15
τaer (λ,t) every 5 min. Wavelength dependence ofτaer (λ, t) has been analyzed by a best-fit technique and, excluding UV-wavelengths, both the absorption Angstrom coef-ficientα and the BC (or BrC) concentration have been determined. Finally, daily his-tograms ofα provide information on optical properties of carbonaceous aerosol, while the extrapolation at UV-wavelengths gives information on the presence of semivolatile
20
organic carbon (OC) particles.
1 Introduction
Atmospheric Aerosol containing black carbon component (BC, in the following) can both scatter and absorb incoming solar light, exerting a regional cooling effect at the earth surface and, at the same time, a warming effect on the atmosphere (Ramanathan
25
AMTD
5, 1003–1027, 2012A new algorithm for brown and black carbon identification
F. Esposito et al.
Title Page
Abstract Introduction
Conclusions References
Tables Figures
◭ ◮
◭ ◮
Back Close
Full Screen / Esc
Printer-friendly Version Interactive Discussion
Discussion
P
a
per
|
Dis
cussion
P
a
per
|
Discussion
P
a
per
|
Discussio
n
P
a
per
|
component can be higher than that due to CH4, giving the second most important ef-fect on global warming (Jacobson, 2001, 2006). Shresta et al. (2010) estimate that BC can cause a net positive radiative forcing (surface warming) of 1.2 W m−2(±0.4 W m−2) through three different processes: absorption of direct sunlight (negative forcing); ab-sorption of the solar radiation reflected by the earth and clouds (positive radiative
forc-5
ing); increasing of the absorption of sunlight by deposition on snow and ice (positive radiative forcing).
Moreover, the INDOEX experiment confirmed that aerosol containing BC compo-nents contributes to a reduction of cloudiness (Ackerman et al., 2000).
In the following, the terminology is based on Andreae and Gelencser (2006), who
10
tried to classify the different components present in light-absorbing carbonaceous aerosol. The BC is the component that presents an absorption in visible light including the aerosol fraction that presents a “black appearence”. The term BC is specially used in case of optical based instruments. BC has typically a refractive index of 1.95+0.79i, independent of the wavelength, and a mass absorption efficiency of 7.5±1.2 m2g−1at
15
0.550 µm (Bond and Bergstrom, 2006). Under the hypothesis that the imaginary part of BC refractive index is constant over the UV-visible spectral region, the absorption coefficientτaer (λ,t) was computed by Moosmuller et al. (2009), and it was found in-versely proportional toλ(i.e. α=1). The BC component is principally constituted by almost pure carbon particles, with properties typical of soot coming from combustion,
20
and low traces of other elements, such as oxygen and hydrogen (Andreae and Ge-lencser, 2006). In some cases, combustion processes can produce particulate show-ing an absorption coefficient with a spectral dependence higher than 1, resulting in a colored (brown or yellow) appearance. In analogy with the definition of BC, the colored component of aerosol, called brown carbon (BrC), could be defined starting
25
AMTD
5, 1003–1027, 2012A new algorithm for brown and black carbon identification
F. Esposito et al.
Title Page
Abstract Introduction
Conclusions References
Tables Figures
◭ ◮
◭ ◮
Back Close
Full Screen / Esc
Printer-friendly Version Interactive Discussion
Discussion
P
a
per
|
Dis
cussion
P
a
per
|
Discussion
P
a
per
|
Discussio
n
P
a
per
|
initial phase of combustion or during the pyrolysis of organic matter, for example during biomass burning. Other coloured polymeric products, called Humic-like substances (HULIS), can be produced in presence of sulfuric acids in heterogeneous reactions in-volving compounds like isoprene (Andreae and Gelencser, 2006; Limbeck et al., 2003). Another possible source of BrC is the reaction of organic compounds with sulfuric acid
5
in presence of low humidity (Hegglin et al., 2002).
Finally, carbonaceous particles can be characterised by a strong absorption in the UV, due to the presence of organic compounds (i.e. Polycyclic Aromatic Hydrocarbons, PAH). Volatile organic compounds can be adsorbed by BC or BrC or can undergo a gas-to-particle conversion process, generating in both cases semi-volatile organic
10
carbon (OC) particles (Lonati et al., 2007; Flowers et al., 2010).
Magee Aethalometers are the most diffused instruments used to measure BC con-centrations (Snyder and Schauer, 2007; Raju et al., 2011; Raghavendra Kumar et al., 2011), also in networks such as the UK Black carbon Network (Butterfield et al., 2010). The attenuation of light passing trough a filter loaded by atmospheric aerosol is
15
measured and obtained values are used to estimate black carbon concentration under the hypotheses of a mass absorption cross section inversely proportional to the wave-length (Angstrom absorption coefficientα=1) and a negligible scattering contribution, if compared to the absorption. Usually the BC concentration is estimated from the attenuation at 0.88 µm, considered as a standard wavelength in Aethalometers, while
20
OC is detected by light attenuation at 0.37 µm. Some classes of organic compounds (such as PAH) show a large UV cross section, strongly varying with the compounds, so the attenuation at 0.37 µm cannot give quantitative OC content.
The use of a multi-wavelength instrument allows to develop a best-fit technique for the aerosol absorption coefficients measured over the entire spectral range, excluding
25
AMTD
5, 1003–1027, 2012A new algorithm for brown and black carbon identification
F. Esposito et al.
Title Page
Abstract Introduction
Conclusions References
Tables Figures
◭ ◮
◭ ◮
Back Close
Full Screen / Esc
Printer-friendly Version Interactive Discussion
Discussion
P
a
per
|
Dis
cussion
P
a
per
|
Discussion
P
a
per
|
Discussio
n
P
a
per
|
In cases of strong UV light absorption by OC particles, the corresponding coefficient measured by the Aethalometer is the sum of two contributions: one deriving from the aerosol particle absorption, as described by the Mie theory, the other deriving from the specific spectral behavior of organic compounds present in the atmospheric particles (Kirchstetter and Novakov, 2004). For this reason, UV absorption cannot be used to
5
estimate the exact amount of the organic component of carbonaceous aerosol. It does not allow a quantitative measure of OC content but it can only be used for the detection of the presence of organic compounds in atmospheric aerosols. Following the Magee algorithm (Hansen, 2005) the detection is made by defining an equivalent UVPM (UV-absorbing Particulate Matter), representing the amount of BC that absorbs UV photons
10
with the same efficiency of organic compounds trapped into the atmospheric particu-late. The Magee algorithm uses the difference between BC computed at 0.37 µm and BC computed at the standard wavelength 0.88 µm to detect the presence of organic compounds. This procedure does not work in presence of BrC, because the hypoth-esis that the mass absorption coefficient is inversely proportional to the wavelength is
15
no longer valid.
2 Methods and measurements site
BC is usually measured with an Aethalometer, which measures the attenuation of light passing through a quartz filter on which atmospheric aerosol settles down. In this case, a suitable cyclone for PM2.5 set on the inlet tube forces air flow to cross a tape
20
filter, while the transmission is measured by the attenuation of light coming from led sources. The transmission is measured relative to a clean filter of the same type. The absorption coefficient of the sample is computed using transmission, spot area and volume of sampled air and then converted to BC concentration, under the hypothesis that the mass extinction coefficient is inversely proportional to the wavelength (Hansen,
25
AMTD
5, 1003–1027, 2012A new algorithm for brown and black carbon identification
F. Esposito et al.
Title Page
Abstract Introduction
Conclusions References
Tables Figures
◭ ◮
◭ ◮
Back Close
Full Screen / Esc
Printer-friendly Version Interactive Discussion
Discussion
P
a
per
|
Dis
cussion
P
a
per
|
Discussion
P
a
per
|
Discussio
n
P
a
per
|
Measurements used in the present paper were taken using a Magee AE31 Aethalometer that measures the optical attenuation of light at the following 7 wave-lengths: 0.37, 0.47, 0.52, 0.59, 0.66, 0.88, 0.95 µm, with a typical half-width of 0.02 µm (Hansen, 2005). The instrument is equipped with a detector measuring firstly the in-tensity of the light IR (λ) passing through a reference clean spot on the quartz filter
5
and then the intensityIS (λ) obtained after the accumulation of atmospheric aerosols. A second photodiode takes into account the light intensity fluctuations by a “reference beam” measurement: the same lamp illuminates a clean area of the tape and this response is used to correct the sensing signal.
It is well known that the attenuation measured by the aethalometer can be affected
10
by bias due to the masking effect of aerosol accumulated on the filter (Collaud Coen et al., 2010). The masking effect is higher when the filter gets darker, causing an underestimation of the measured BC concentration (Virkkula, 2007). In order to avoid this problem, the instrument is set in such a way that the particle accumulation area changes every hour. In fact, in the measurement site the filter automatically advances
15
every 8–10 h, when loading threshold is reached, and one hour advancing time has been considered sufficient to reduce the masking effect. The measurements discussed in this work have been collected in Agri Valley located in Southern Italy (40.33◦N, 15.92◦E, 582 m a.s.l.). The area is characterised by the presence of few small towns over both ridges, wide cultivated areas, some oil wells and a plant where fresh crude
20
oil undergoes a pre-treatment process before being piped to the refinery. This causes continuous and controlled smokes emissions. The instrument has been placed about 2 km far from the emission area, on the roof of the Hotel Park Grumentum, at about 12 m a.g.l. and downwind respect to the oil pre-treatment plant. Abbreviations and symbols used in the following are summarized in Table 1, together with measurement
25
AMTD
5, 1003–1027, 2012A new algorithm for brown and black carbon identification
F. Esposito et al.
Title Page
Abstract Introduction
Conclusions References
Tables Figures
◭ ◮
◭ ◮
Back Close
Full Screen / Esc
Printer-friendly Version Interactive Discussion
Discussion
P
a
per
|
Dis
cussion
P
a
per
|
Discussion
P
a
per
|
Discussio
n
P
a
per
|
2.1 Black carbon and brown carbon detection
Starting from measurements of irradiance through the reference filterIR (λ) and through the loaded filterIS (λ), the estimation of aerosol optical attenuation ATN (λ) is computed with the relation (Fialho et al., 2005):
ATN(λ)=−lnIS(λ)
IR(λ)=
Saer(λ)CaerV
A (1)
5
whereSaeris the mass absorption cross section of the aerosol,Caeris the aerosol mass concentration accumulated on the filter spot corresponding to a sampled volumeV,A
is the spot area. The aethalometer takes into account the dark current by measuring attenuation when the light sources are off (Hansen, 2005). Since the aethalometer measures the light intensities as a function of the time, the attenuation at timet after
10
the filter change is estimated as:
ATN(λ, t)=−
Zt
0
lnIS(λ, t)
IR(λ, t)dt=
Zt
0
Saer(λ, t)Caer(t)V(t)
A dt
from which, considering the interval∆t, we have: ATN(λ, t+ ∆t)−ATN(λ, t)
∆t =
Saer(λ, t)hF(t)ihCaer(t)i
A
where the volume sampled has been calculated by the product of the average flow
15
rate < F(t)> and the interval ∆t, while < Caer(t)> is the average concentration of the aerosol accumulated on the filter spot during the interval time ∆t. The spectral absorption coefficientτof the aerosol accumulated on the filter can be calculated as:
τaer(λ, t)= A
hF(t)i
ATN(λ, t+ ∆t)−ATN(λ, t)
∆t =Saer(λ)hCaer(t)i (2)
During the measurements, the mean flow and the interval time were set, respectively,
20
AMTD
5, 1003–1027, 2012A new algorithm for brown and black carbon identification
F. Esposito et al.
Title Page
Abstract Introduction
Conclusions References
Tables Figures
◭ ◮
◭ ◮
Back Close
Full Screen / Esc
Printer-friendly Version Interactive Discussion
Discussion
P
a
per
|
Dis
cussion
P
a
per
|
Discussion
P
a
per
|
Discussio
n
P
a
per
|
absorption coefficientsτaer and BC content, computed according to the Magee algo-rithm, using the following formula for mass absorption cross section of aerosol:
Saer(λ)=K
λ (3)
In this formula, the wavelength λ is measured in µm andK is a calibration constant equal to:
5
K=14.625 µm m2g−1
The Magee algorithm uses thisK value in Eq. (3) to give an estimate of BC concentra-tion< Caer>(Hansen, 2005):
hCaer(t)i=τaer(λ, t) Saer(λ) =
τaer(λ, t)λ K
In order to correctly detect the presence of BC or BrC, a generalized empirical formula
10
is proposed, similar to the Angstrom formula commonly applied for atmospheric aerosol optical depth parameterization (Calvello et al., 2010):
Saer(λ)=KGENλ
λ0
−α
(4)
whereα is treated as an unknown parameter to be determined starting from the ex-perimental data, and KGEN represents the mass absorption coefficient at λ0=1 µm,
15
expressed in m2g−1.
The measured spectral absorbing coefficient can be written as:
τaer(λ)=Saer(λ)hCaeri= KGENhCaeri
λ λ0
−α
=β
λ λ0
−α
(5)
where β is the Angstrom turbidity coefficient. In order to discriminate between BrC and BC, a best-fit procedure is applied to compute the absorption exponentα and the
20
AMTD
5, 1003–1027, 2012A new algorithm for brown and black carbon identification
F. Esposito et al.
Title Page
Abstract Introduction
Conclusions References
Tables Figures
◭ ◮
◭ ◮
Back Close
Full Screen / Esc
Printer-friendly Version Interactive Discussion
Discussion
P
a
per
|
Dis
cussion
P
a
per
|
Discussion
P
a
per
|
Discussio
n
P
a
per
|
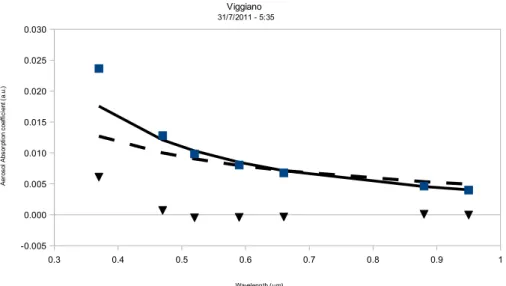
said before, it can be affected by the presence of highly absorbing organic compounds. An example of the procedure application is shown in Fig. 1, where the squares repre-sent the aerosol absorption coefficient measured by our Magee AE-31 as a function of the wavelength. The best fit procedure applied to data in the spectral range 0.44– 0.95 µm, gives an Angstrom exponent value of α=1.56, indicating the presence of
5
BrC. The solid line reported in this figure represents the values computed by the best fit, while triangles are the residuals, that is the difference between measured and com-puted aerosol absorption coefficient. The residuals are practically zero for all wave-lengths, except for the UV-channel, suggesting the presence of organic compounds with high absorbing cross-section in the UV range. The parameterβ, that depends on
10
particles loading and on the imaginary part of refractive index, has been used to give an estimate for BC or BrC content:
hCaeri=
β
KGEN
(6)
under the assumption that the mass absorption coefficient at 1 µm is
KGEN=14.625×10⁻⁶m2g−1 (Hansen, 2005). This value was chosen in order to
15
have the same result in case of validity of Eq. (3).
2.2 UV absorption and organic carbon detection
At wavelengths shorter than about 0.4 µm, some classes of organic substances, such as Polycyclic Aromatic Hydrocarbons (PAH) and some compounds present in wood smoke, begin to show strong UV absorbance (Chen and Bond, 2010). Through the
20
enhanced absorption coefficient at the UV channel the presence of organic com-pounds could be detected. The MAGEE aethalometer manufacturer suggests to con-sider the difference between the BC concentration measured at 0.88 µm and that measured at 0.37 µm as an indicator of the OC presence, using the same value
K=14.625 µm m2g−1at both wavelengths and under the non-verified hypothesis, that
25
AMTD
5, 1003–1027, 2012A new algorithm for brown and black carbon identification
F. Esposito et al.
Title Page
Abstract Introduction
Conclusions References
Tables Figures
◭ ◮
◭ ◮
Back Close
Full Screen / Esc
Printer-friendly Version Interactive Discussion
Discussion
P
a
per
|
Dis
cussion
P
a
per
|
Discussion
P
a
per
|
Discussio
n
P
a
per
|
organic compounds is highly variable (Hansen, 2005), the UV component concentra-tion defined by this procedure cannot be a real physical quantity. Rather, it defines a parameter correlated to the mix of organic compounds measured at this wavelength, usually called equivalent UVPM (UV-absorbing Particulate Matter) and expressed in unity of equivalent BC. In this case the UVPM can only be used to detect the presence
5
of UV-absorbing compounds, disregarding their real concentrations.
If BrC is one of the particulate component, the Magee procedure can give wrong in-formation on OC detection. In fact, if the Angstrom exponent is not equal to 1, it cannot be verified if the difference between the BC computed at 0.37 µm and that computed at 0.88 µm is due to the effect ofα6=1 or to the presence of an increased UV absorption
10
(or to both of them). In order to overcome this problem, the absorption coefficient in the UV-channel, that is a physical quantity, is considered in place of UVPM. In this way, the fit applied to the spectral range 0.44–0.98 µm is used to extrapolate the aerosol contribution to the absorption coefficient at 0.37 µm. Then, the contribution due to the absorption of organic compounds at UV-channel is computed. Similarly, the estimate
15
of the Angstrom exponent, used for the detection of wood fire (Favez et al., 2009) can be affected by an error in case of strong absorption in the UV. This suggests to use the spectral range 0.44–0.98 µm for the fit.
As described in the introduction, total UV absorbing coefficientτUVcan be expressed as the sum of two contributions: the aerosol contribution and the absorption by a mix
20
of polycyclic compounds:
τUV=τ(λ=0.37)=τaer+τOC=Saer(λ)hCaeri+τOC
where τOC is the contribution to the absorption in the UV channel due only to the organic compounds, and can be calculated as:
τOC=τUV−Saer(λ)hCaeri=τUV−β
λ
λ0
−α
(7)
25
AMTD
5, 1003–1027, 2012A new algorithm for brown and black carbon identification
F. Esposito et al.
Title Page
Abstract Introduction
Conclusions References
Tables Figures
◭ ◮
◭ ◮
Back Close
Full Screen / Esc
Printer-friendly Version Interactive Discussion
Discussion
P
a
per
|
Dis
cussion
P
a
per
|
Discussion
P
a
per
|
Discussio
n
P
a
per
|
compounds in the UV channel is highly variable, the UV-specific aerosol absorption can be detected but cannot be used to give quantitative data on organic compounds in aerosol. In any case, τOC estimated with the Eq. (7) is a physical quantity, that is the absorption due to the mix of organic compounds present in the atmosphere and eventually absorbed by aerosol. In order to compare current results with those obtained
5
by applying the Magee procedure, the equivalent UVPM can be computed starting from UV absorption coefficient as:
hUVPMi=τOC(λ) Saer(λ)=
τOC(λ)
KGEN
λ
λ0
α
(8)
Thus, this way to estimate the whole OC takes also into account the proper BrC contri-bution to BC amount, avoiding wrong detection of OC.
10
3 Results
The algorithm described so far has been tested on data obtained close to the Oil Center in Viggiano (Agri Valley), for different operational conditions of the plant, with emitted aerosols showing different optical properties. Measurements have been continuously collected every 5 min and the corresponding Angstrom absorption coefficientsα have
15
been computed and averaged over 1 h.
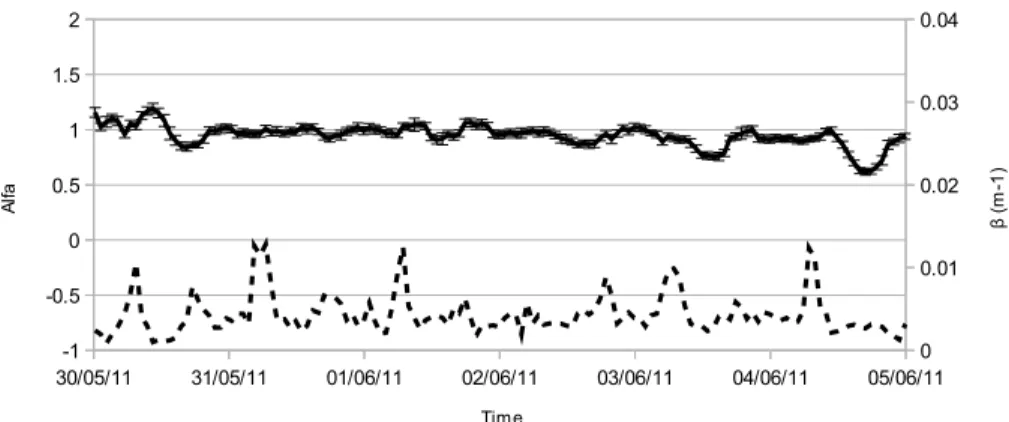
In order to characterize background aerosol, the algorithm was applied to a main-tenance period during which there was no activity at all, between 30 May and 5 June 2011. In Fig. 2 we report the trend of both Angstrom parameters, alfa and beta, depending respectively on aerosol type and loading, as obtained by the
algo-20
AMTD
5, 1003–1027, 2012A new algorithm for brown and black carbon identification
F. Esposito et al.
Title Page
Abstract Introduction
Conclusions References
Tables Figures
◭ ◮
◭ ◮
Back Close
Full Screen / Esc
Printer-friendly Version Interactive Discussion
Discussion
P
a
per
|
Dis
cussion
P
a
per
|
Discussion
P
a
per
|
Discussio
n
P
a
per
|
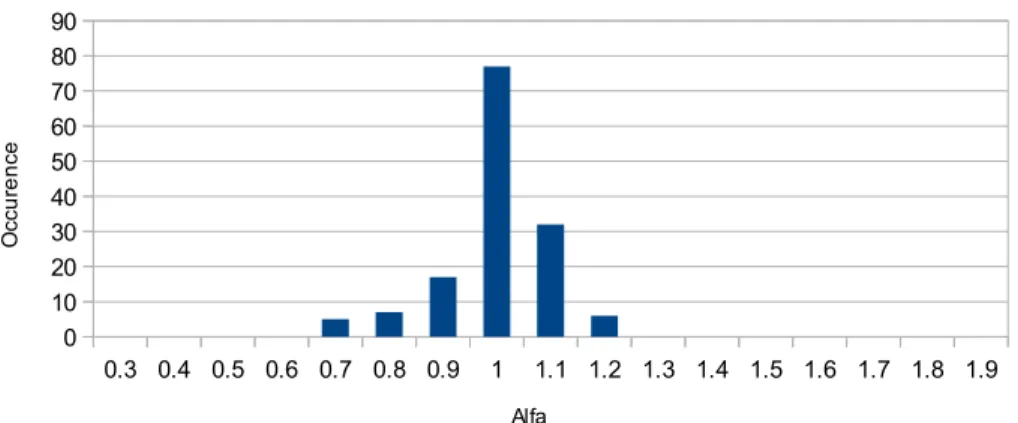
The capacity of our algorithm to identify the aerosol type, even in presence of fluctua-tion of aerosol concentrafluctua-tion is remarkable since this result could not be obtained with a standard analysis of Aethalometer measurement, that gives only the concentration, without information on the aerosol type. In Fig. 3 we report the alfa values histogram for the same period. The histogram is definitely centred around the value α=0.96,
5
with a standard deviationsα=0.11, implying a strong prevalence of BC in atmospheric aerosol. It can be concluded that the algorithm described above can detect correctly the prevalence of black carbon in aerosol background. During the maintenance period there was no detection of OC components, that was zero within experimental error, as expected in case of no activity at the Oil Center. Aerosols detected during the
mainte-10
nance period can be considered as background aerosol.
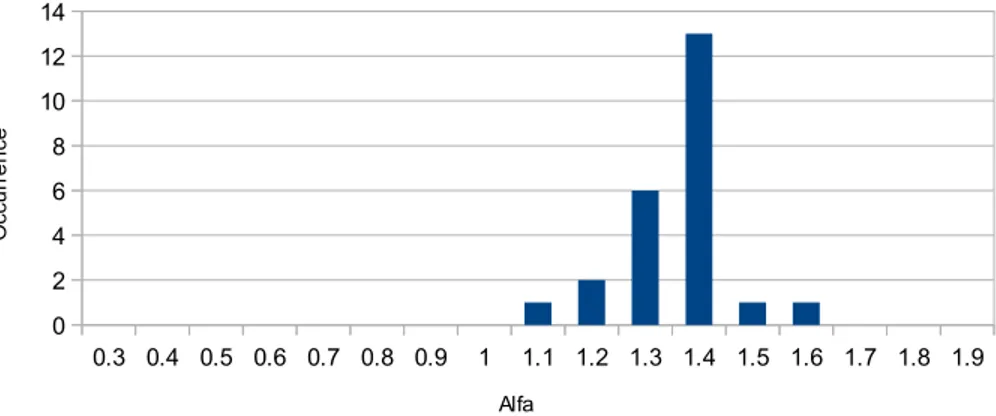
The same algorithm has been tested in days of normal activities at the Oil pre-treatment centre, using the histogram to evaluate the type of atmospheric aerosol. In Fig. 4 the histogram of alfa parameter is reported for 5 February 2011, corresponding to standard conditions activity. In this case the aerosol absorption properties are
dom-15
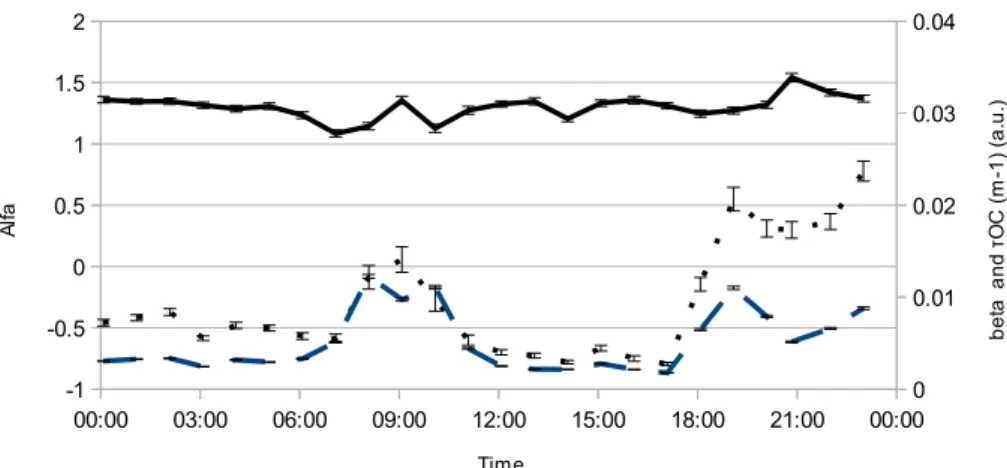
inated by brown carbon, presenting for alfa parameter a mean value and a standard deviation equal toα=1.4 andsα=0.1. For the same day in Fig. 5 the evolution ofαis reported together with aerosol concentration and equivalent UVPM. In this case there is a clear absorption in the UV channel, due to the emissions from the oil pre-treatment centre.
20
The distributions obtained during maintenance and functioning periods of the oil cen-ter demonstrate that the developed algorithm is concretely capable to discriminate be-tween BC and BrC, thus giving information not only on the quantity, but also on the type of atmospheric aerosol. In this case, it is supposed that the differences observed can be related to various chemical processes giving rise to different emissions
compo-25
sitions.
AMTD
5, 1003–1027, 2012A new algorithm for brown and black carbon identification
F. Esposito et al.
Title Page
Abstract Introduction
Conclusions References
Tables Figures
◭ ◮
◭ ◮
Back Close
Full Screen / Esc
Printer-friendly Version Interactive Discussion
Discussion
P
a
per
|
Dis
cussion
P
a
per
|
Discussion
P
a
per
|
Discussio
n
P
a
per
|
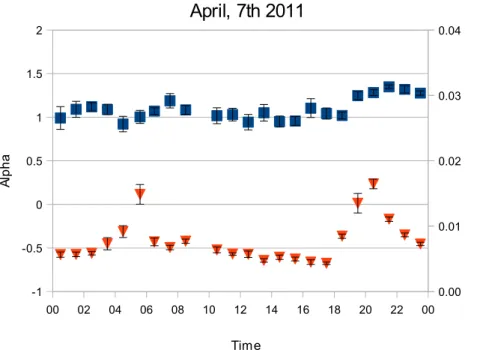
the same time there is an increase of the aerosol content, as suggested byβbehavior. The simultaneity of these changes both starting at 19:30 may probably indicate a tran-sition from a manufacturing process to another, or a switching-on of a working process, thus corresponding to different emissions compositions and loadings.
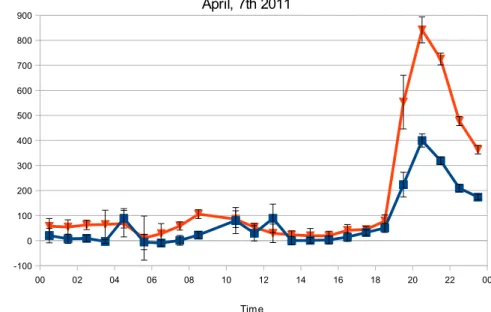
To complete the analysis, Fig. 7 shows the evolution of the<UVPM>residual
UV-5
absorption coefficientτOC, computed according to the Eq. (8). Data are 1 h averaged, as previously done for Angstrom parameters, with error bars corresponding to standard deviations. As in Fig. 6, also in this case a quick variation is found at about 19:30. In fact, before that time, the UV-absorption coefficient values are near zero while they rapidly grow after 19:30 and reach a maximum at 20:00. The time coincidence of UV
10
component increasing and BrC detection is probably due to the production process transition, confirming the hypothesis made in comments on Fig. 6.
Finally, it is useful to compare the values of<UVPM>estimated according to Eq. (8) with those furnished by Magee, reported in the same figure. Considering data before 19:00, in 11 cases out of 17, Magee algorithm detects organic compounds, while the
15
new algorithm provides a zero value within the experimental error. This difference is due to the fact that the Angstrom exponent is not always equal to unity. The equivalent UVPM values differ much more after 19:00, when Angstrom exponent rapidly rises, producing a higher difference in the UV channel.
4 Conclusions
20
A new algorithm, based on a best-fit procedure, for black and brown carbon content estimation and organic component detection has been presented and discussed. It im-proves the algorithm proposed by Magee Aethalometer manufacturer, because gives the possibility to discriminate between BC and BrC and properly detect aerosol prop-erties variations.
25
AMTD
5, 1003–1027, 2012A new algorithm for brown and black carbon identification
F. Esposito et al.
Title Page
Abstract Introduction
Conclusions References
Tables Figures
◭ ◮
◭ ◮
Back Close
Full Screen / Esc
Printer-friendly Version Interactive Discussion
Discussion
P
a
per
|
Dis
cussion
P
a
per
|
Discussion
P
a
per
|
Discussio
n
P
a
per
|
parameters have also been used to estimate the absorption coefficient in the UV chan-nel at 0.37 µm, as an indicator of the presence of organic compounds in atmospheric aerosols. The results show that this absorption coefficient is a better indicator of OC than the UVPM computed by Magee algorithm. In fact, it has been found that Magee algorithm can wrongly detect the equivalent UVPM because it does not discriminate
5
absorption at the UV channel due to BrC and/or OC.
The procedure has been applied to measurements collected during three different days near a crude oil pre-treatment center, showing the capability to detect, in a well defined time period, the contemporary presence of brown carbon and organic com-pounds probably due to the transition from a chemical process to another. Daily
his-10
tograms of the Angstrom exponent data, measured each five minutes, give indications on the prevailing component in carbonaceous particles, while hourly averaged data allow to study daily evolution.
To sum up, the obtained results could be useful to improve the OC estimation and de-tection in monitoring networks as such as the UK Black carbon Network, managed for
15
Department for Environment Food and Rural Affairs (DEFRA) and Devolved Adminis-trations by the National Physical Laboratory (Butterfield, 2010) where two wavelengths (0.37 and 0.88 µm) Magee aethalometers are usually used to monitor both BC and its UV “component” in atmospheric aerosol. The proposed procedure could be easily au-tomated, so it is suggested to modify the instruments by introducing a third wavelength
20
(for example 0.52 µm) that could help in bias reduction. With this configuration, two channels (0.52 and 0.88 µm) could be used to estimate Angstrom parameters for brown or black carbon detection, comparing then the extrapolated absorption coefficient with the third channel in UV (0.37 µm), to reveal the presence of organic compounds. The application of this algorithm could be useful for field studies on processes capable to
25
AMTD
5, 1003–1027, 2012A new algorithm for brown and black carbon identification
F. Esposito et al.
Title Page
Abstract Introduction
Conclusions References
Tables Figures
◭ ◮
◭ ◮
Back Close
Full Screen / Esc
Printer-friendly Version Interactive Discussion
Discussion
P
a
per
|
Dis
cussion
P
a
per
|
Discussion
P
a
per
|
Discussio
n
P
a
per
|
Acknowledgements. The work was partly supported by the project “Sviluppo ed integrazione di tecniche innovative di osservazione della Terra per il monitoraggio di fenomeni di dissesto idrogeologico in un’area test del Bacino della Val d’Agri“ funded by ENI s.p.a. The authors gratefully thank the Hotel Park Grumentum staff for the support given during measurement operations.
5
References
Andreae, M. O. and Gelencs ´er, A.: Black carbon or brown carbon? The nature of light-absorbing carbonaceous aerosols, Atmos. Chem. Phys., 6, 3131–3148, doi:10.5194/acp-6-3131-2006, 2006.
Bond, T. and Bergstrom, R.: Light absorption by carbonaceous particles: an investigative re-10
view, Aerosol Sci. Tech., 40, 27–67, 2006.
Butterfield, D., Beccaceci, S., Sweeney, B., Green, D., Alexander, J., and Grieve, A.: Annual Re-port for the UK Black Carbon Network, available at: http://uk-air.defra.gov.uk/reRe-ports/cat05/ 1009031405 2009 BC Annual Report Final.pdf, 2010.
Calvello, M., Esposito, F., Pavese, G., and Serio, C.: Physical and optical properties of atmo-15
spheric aerosols by in-situ and radiometric measurements, Atmos. Chem. Phys., 10, 2195– 2208, doi:10.5194/acp-10-2195-2010, 2010.
Chen, Y. and Bond, T. C.: Light absorption by organic carbon from wood combustion, Atmos. Chem. Phys., 10, 1773–1787, doi:10.5194/acp-10-1773-2010, 2010.
Collaud Coen, M., Weingartner, E., Apituley, A., Ceburnis, D., Fierz-Schmidhauser, R., Flen-20
tje, H., Henzing, J. S., Jennings, S. G., Moerman, M., Petzold, A., Schmid, O., and Bal-tensperger, U.: Minimizing light absorption measurement artifacts of the Aethalometer: eval-uation of five correction algorithms, Atmos. Meas. Tech., 3, 457–474, doi:10.5194/amt-3-457-2010, 2010.
Favez, O., Cachier, H., Sciare, J., Sarda-Esteve, R., and Martinon, L.: Evidence for a significant 25
contribution of wood burning aerosols to PM2.5 during the winter season in Paris, France, Atmos. Environ., 43, 3640–3644, doi:10.1016/j.atmosenv.2009.04.035, 2009.
Fialho, P., Hansen, A. D. A., and Honrath, R. E.: Absorption coefficients by aerosols in remotre areas: a new approach to decouple dust and black carbon absorption coefficients using seven-wavelengths Aethalometer data, J. Aerosol Sci., 36, 267–282, 2005.
AMTD
5, 1003–1027, 2012A new algorithm for brown and black carbon identification
F. Esposito et al.
Title Page
Abstract Introduction
Conclusions References
Tables Figures
◭ ◮
◭ ◮
Back Close
Full Screen / Esc
Printer-friendly Version Interactive Discussion
Discussion
P
a
per
|
Dis
cussion
P
a
per
|
Discussion
P
a
per
|
Discussio
n
P
a
per
|
Flowers, B. A., Dubey, M. K., Mazzoleni, C., Stone, E. A., Schauer, J. J., Kim, S.-W., and Yoon, S. C.: Optical-chemical-microphysical relationships and closure studies for mixed carbona-ceous aerosols observed at Jeju Island; 3-laser photoacoustic spectrometer, particle sizing, and filter analysis, Atmos. Chem. Phys., 10, 10387–10398, doi:10.5194/acp-10-10387-2010, 2010.
5
Hansen, A. D. A.: The Aethalometer manual, Magee Scientific, available at: http://mageesci. com/support/downloads/Aethalometer book 2005.07.03.pdf, 2005.
Hegglin, M. I., Krieger, U. K., Koop, T., and Peter, T.: Organics-induced fluorescence in Raman studies of sulfuric acid aerosol, Aerosol Sci. Tech., 36, 510–512, 2002.
Herich, H., Hueglin, C., and Buchmann, B.: A 2.5 year’s source apportionment study of black 10
carbon from wood burning and fossil fuel combustion at urban and rural sites in Switzerland, Atmos. Meas. Tech., 4, 1409–1420, doi:10.5194/amt-4-1409-2011, 2011.
Jacobson, M. Z.: Strong radiative heating due to the mixing state of black carbon in atmospheric aerosols, Nature, 409, 695–697, 2001.
Jacobson, M. Z.: Effects of Externally-Through-Internally-Mixed Soot Inclusions within Clouds 15
and Precipitation on Global Climate, J. Phys. Chem. A, 110, 6860–6873, 2006.
Kirchstetter, T. W. and Novakov, T.: Evidence that spectral dependence of light ab-sorption by aerosols is affected by organic carbon, J. Geophys. Res., 109, D21208, doi:10.1029/2004JD004999, 2004.
Limbeck, A., Kulmala, M., and Puxbaum, H.: Secondary organic aerosol formation in the atmo-20
sphere via heterogeneous reaction of gaseous isoprene on acidic particles, Geophys. Res. Lett., 30, doi:10.1029/2003GL017738, 1996, 2003.
Lonati, G., Ozgen, S., and Giugliano, M.: Primary and secondary carbonaceous species in PM2.5samples in Milan (Italy), Atmos. Environ., 41, 4599–4610, 2007.
Moosmuller, H., Chakrabarty, R. K., and Arnott, W. P.: Aerosol light absorption and its mea-25
surement: A review, J. Quant. Spectrosc. Ra., 110, 844–878, 2009.
Raghavendra Kumar, K., Narasimhulu, K., Balakrishnaiah, G., Suresh Kumar Reddy, B., Rama Gopal, K., Reddy, R. R., Satheesh, S. K., Krishna Moorty, K., and Suresh Babu, S.: Charac-terization of aerosol black carbon over a tropical semi-arid region of Anantapur, India, Atmos. Res, 100, 12–27, 2011.
30
AMTD
5, 1003–1027, 2012A new algorithm for brown and black carbon identification
F. Esposito et al.
Title Page
Abstract Introduction
Conclusions References
Tables Figures
◭ ◮
◭ ◮
Back Close
Full Screen / Esc
Printer-friendly Version Interactive Discussion
Discussion
P
a
per
|
Dis
cussion
P
a
per
|
Discussion
P
a
per
|
Discussio
n
P
a
per
|
Ramanathan, V. and Carmichael, G.: Global and regional climate changes due to black carbon, Nat. Geosci., 1, 221–227, doi:10.1038/ngeo156, 2008.
Shrestha, G., Traina, S. J., and Swanston, C. W.: Black Carbon’s Properties and Role in the Environment: A Comprehensive Review, Sustainability, 2, 294–320, 2010.
Snyder, D. C. and Schauer, J. J.: An inter-comparison of two black carbon aerosol instruments 5
in the urban environment, Aerosol Sci. Tech., 41, 463–474, 2007.
Virkkula, A.: A Simple Procedure for Correcting Loading Effects of Aethalometer Data, J. Air Waste Manage., 57, 1214–1222, 2007.
Yang, M., Howell, S. G., Zhuang, J., and Huebert, B. J.: Attribution of aerosol light absorp-tion to black carbon, brown carbon, and dust in China – interpretaabsorp-tions of atmospheric 10
AMTD
5, 1003–1027, 2012A new algorithm for brown and black carbon identification
F. Esposito et al.
Title Page
Abstract Introduction
Conclusions References
Tables Figures
◭ ◮
◭ ◮
Back Close
Full Screen / Esc
Printer-friendly Version Interactive Discussion
Discussion
P
a
per
|
Dis
cussion
P
a
per
|
Discussion
P
a
per
|
Discussio
n
P
a
per
|
Table 1.Symbols and Abbreviations used.
Name Symbol or Units
Abbreviation
Black carbon BC –
brown carbon BrC –
Organic carbon OC –
Aerosol absorption coefficient τaer(λ,t) m−1 Mass absorption cross section Saer m2g−1 Black carbon mass concentration Caer g m−3
Calibration constant (Magee) K µm m2g−1
Mass absorption coefficients KGEN m2g−1
Angstrom absorption coefficient (exponent) α dimensionless Angstrom absorption coefficient (turbidity) β m−1
UV total absorption coefficient τUV m−1 Contribution of OC to UV absorption coefficient τOC m−1
Attenuation at wavelengthλ ATN dimensionless
Spot area A m2
Sampled Volume V m3
AMTD
5, 1003–1027, 2012A new algorithm for brown and black carbon identification
F. Esposito et al.
Title Page
Abstract Introduction
Conclusions References
Tables Figures
◭ ◮
◭ ◮
Back Close
Full Screen / Esc
Printer-friendly Version Interactive Discussion
Discussion
P
a
per
|
Dis
cussion
P
a
per
|
Discussion
P
a
per
|
Discussio
n
P
a
per
|
0.3 0.4 0.5 0.6 0.7 0.8 0.9 1
-0.005 0.000 0.005 0.010 0.015 0.020 0.025 0.030
Viggiano
31/7/2011 - 5:35
Wavelength (μm)
A
e
ro
s
o
l
A
b
s
o
rp
ti
o
n
c
o
e
ff
ic
ie
n
t
(a
.u
.)
AMTD
5, 1003–1027, 2012A new algorithm for brown and black carbon identification
F. Esposito et al.
Title Page
Abstract Introduction
Conclusions References
Tables Figures
◭ ◮
◭ ◮
Back Close
Full Screen / Esc
Printer-friendly Version Interactive Discussion
Discussion
P
a
per
|
Dis
cussion
P
a
per
|
Discussion
P
a
per
|
Discussio
n
P
a
per
|
30/05/11 31/05/11 01/06/11 02/06/11 03/06/11 04/06/11 05/06/11 51
50.5 0 0.5 1 1.5 2
0 0.01 0.02 0.03 0.04 Viggiano
Time
A
lf
a
β
(
m
51
)
AMTD
5, 1003–1027, 2012A new algorithm for brown and black carbon identification
F. Esposito et al.
Title Page
Abstract Introduction
Conclusions References
Tables Figures
◭ ◮
◭ ◮
Back Close
Full Screen / Esc
Printer-friendly Version Interactive Discussion
Discussion
P
a
per
|
Dis
cussion
P
a
per
|
Discussion
P
a
per
|
Discussio
n
P
a
per
|
0.3 0.4 0.5 0.6 0.7 0.8 0.9 1 1.1 1.2 1.3 1.4 1.5 1.6 1.7 1.8 1.9 0
10 20 30 40 50 60 70 80 90
Viggiano
30 May to 4 June
Alfa
O
ccu
re
n
ce
AMTD
5, 1003–1027, 2012A new algorithm for brown and black carbon identification
F. Esposito et al.
Title Page
Abstract Introduction
Conclusions References
Tables Figures
◭ ◮
◭ ◮
Back Close
Full Screen / Esc
Printer-friendly Version Interactive Discussion
Discussion
P
a
per
|
Dis
cussion
P
a
per
|
Discussion
P
a
per
|
Discussio
n
P
a
per
|
0.3 0.4 0.5 0.6 0.7 0.8 0.9 1 1.1 1.2 1.3 1.4 1.5 1.6 1.7 1.8 1.9
0 2 4 6 8 10 12 14
Viggiano
5th february 2011
Alfa
O
ccu
rr
e
n
ce
AMTD
5, 1003–1027, 2012A new algorithm for brown and black carbon identification
F. Esposito et al.
Title Page
Abstract Introduction
Conclusions References
Tables Figures
◭ ◮
◭ ◮
Back Close
Full Screen / Esc
Printer-friendly Version Interactive Discussion
Discussion
P
a
per
|
Dis
cussion
P
a
per
|
Discussion
P
a
per
|
Discussio
n
P
a
per
|
00:00 03:00 06:00 09:00 12:00 15:00 16:00 21:00 00:00
-1 -0.5 0 0.5 1 1.5 2
0 0.01 0.02 0.03 0.04
Viggiano
Time
A
lf
a
b
e
ta
a
n
d
τ
O
C
(
m
-1
)
(a
.u
.)
AMTD
5, 1003–1027, 2012A new algorithm for brown and black carbon identification
F. Esposito et al.
Title Page
Abstract Introduction
Conclusions References
Tables Figures
◭ ◮
◭ ◮
Back Close
Full Screen / Esc
Printer-friendly Version Interactive Discussion
Discussion
P
a
per
|
Dis
cussion
P
a
per
|
Discussion
P
a
per
|
Discussio
n
P
a
per
|
00 02 04 06 08 10 12 14 16 18 20 22 00
-1 -0.5 0 0.5 1 1.5 2
0.00 0.01 0.02 0.03 0.04
April, 7th 2011
Time
A
lp
h
a
B
e
ta
(
m
-1
)
AMTD
5, 1003–1027, 2012A new algorithm for brown and black carbon identification
F. Esposito et al.
Title Page
Abstract Introduction
Conclusions References
Tables Figures
◭ ◮
◭ ◮
Back Close
Full Screen / Esc
Printer-friendly Version Interactive Discussion
Discussion
P
a
per
|
Dis
cussion
P
a
per
|
Discussion
P
a
per
|
Discussio
n
P
a
per
|
00 02 04 06 08 10 12 14 16 18 20 22 00
-100 0 100 200 300 400 500 600 700 800
800 April, 7th 2011
Time
U
V
P
M
(
g
r/
m
3
)
Fig. 7. Comparison between UVPM estimated by standard Magee algorithm (triangles) and