Article
J. Braz. Chem. Soc., Vol. 25, No. 8, 1380-1390, 2014. Printed in Brazil - ©2014 Sociedade Brasileira de Química 0103 - 5053 $6.00+0.00
A
*e-mail: [email protected]
Historical Evolution of Organic Matter Accumulation in a Coastal Bay in the
SW Atlantic, Brazil: Use of Sterols and
n-
Alcohols as Molecular Markers
Eduardo C. Richard,*,a Cláudia Hamacher,a Cássia O. Farias,a Marina P. Dore,a Natália C. M. Ribeiro,a Michelle A. Passos,a Plinio F. Martinho,a José M. Godoyb and
Renato S. Carreirab
aFaculdade de Oceanografia, Universidade do Estado do Rio de Janeiro, Rua São Francisco Xavier, 524, 4º andar, 20550-900 Rio de Janeiro-RJ, Brazil
bDepartamento de Química, Pontifícia Universidade Católica do Rio de Janeiro, Rua Marquês de São Vicente, 225, 7º andar, 22453-900 Rio de Janeiro-RJ, Brazil
Os processos de deposição e preservação de matéria orgânica (OM) em sedimentos da Baía de Ilha Grande, sudoeste Atlântico, foram avaliados através de análise elementar (C e N) e de marcadores moleculares (esteróis e n-alcoois). Foram analisadas amostras de quatro testemunhos datados, representando diferentes níveis e tipos de influência antrópica. A concentração total de esteróis variou de 71 a 9.320 ng g–1, com predomínio de 24-etil-colesta-5,22-dien-3β-ol,
24-etil-colest-5-en-3β-ol e 24-etil-5α-colest-3β-ol. Entre os n-alcoóis, com concentrações totais entre
130 a 15.407 ng g–1, houve predomínio de compostos de cadeia longa (> C
22). A confirmação da
origem terrestre ou marinha dos marcadores moleculares selecionados foi realizada por análise de componentes principais (PCA). A PCA revelou, ainda, tendência e eventos que influenciaram o acúmulo de OM nas últimas décadas, como o aumento na ocupação humana na região e a remoção de uma floresta de manguezal ocorrida entre 1940 e 1960. A ausência ou baixa contaminação fecal foi revelada através do esterol coprostanol e índices associados.
The deposition processes and preservation of organic matter (OM) in the sediments of Ilha Grande Bay, SW Atlantic, were evaluated based on elemental composition (C and N) and molecular markers (sterols and n-alcohols). Samples from four dated sediment cores, representing distinct
levels and type of human influence, were analyzed. The concentration of total sterols ranged from 71 to 9,320 ng g–1, with 24-ethyl-cholesta-5,22-dien-3β-ol, 24-ethyl-cholesta-5-en-3β-ol
and 24-ethyl-5α-cholesta-3β-ol as the most abundant compounds. The n-alcohols, with a total
concentration between 130 and 15,407 ng g–1, were dominated by long-chain compounds (> C 22).
Assignments of the selected markers to terrestrial or marine sources were evaluated using principal component analysis (PCA). The trends and events that influenced the OM accumulation in the last decades were also revealed by the PCA, as the increasing human settlement in the region and the removal of a mangrove forest occurred between 1940 and 1960. The absence or low level of sewage contamination was indicated by the sterol coprostanol and associated indexes.
Keywords: molecular markers, sediment cores, land-use, eutrophication
Introduction
Coastal ecosystems are essential components for understanding the global carbon cycle.1 These regions
have high rates of primary and secondary productions, and the transformations and deposition of organic matter (OM) occurring in these regions are notably more intense than those observed in the continental margin.2 Because
the majority of the global population lives within the coastal zone,3 human perturbation of coastal ecosystems
has being intensified in the recent decades. Eutrophication, increasing hypoxia, land use changes, industrial and domestic wastewaters, fossil fuels and organic and inorganic contaminants, among other biological and physical alterations, are threats to the environmental health of coastal ecosystems throughout the world.4
total pool of OM in coastal sediments.5 The wide range
of OM sources, in addition to ecosystems dynamics and human perturbation, have all posed a challenge to the understanding of OM geochemistry in the coastal oceans.1,6
The distinct reactivities of OM according to its source is another relevant factor in this context, whose effect on the preservation of OM in the sedimentary record has been addressed in detail in the last years.7,8
Molecular markers are organic compounds whose origin and/or chemical transformation may be related to a particular source of OM, both autochthonous and allochthonous.9 Lipids are less abundant in OM than
proteins and carbohydrates, but they are the most common molecular markers in organic geochemistry because of their source-specificity and better resistance to diagenesis than other organic groups.10 Different lipid classes such as
n-alkanes, fatty acids, sterols, n-alcohols and many others,
have been extensively used as molecular markers to assess the inputs of natural and anthropogenic OM to coastal environments.11,12 Sterols are hydrophobic molecules that
has a tendency to associate with solid phases which, in conjunction with n-alcohols, are good tracers of source
changes and OM preservation.5
Sedimentary profiles have the potential to be natural archives of environmental changes under historical and/or geological time frames.13 This is possible in places
where the sedimentary column structure was not destroyed by physical or biological action and post-depositional diagenesis are (or are considered to be) negligible.14 There
is a relative large literature addressing the history of organic contaminants accumulation in Brazilian coastal systems,15,16
whereas similar information for OM characterization is comparatively more restricted.17,18
In the present work, four sediment cores were collected in the Ilha Grande Bay, SW Atlantic, Brazil (Figure 1) to evaluate the historical evolution, deposition and transformation of OM in this environment. Sedimentation
rates, based on 210Pbmeasures, were used to estimate the
age of each sediment layer. Lipid biomarkers (sterols and
n-alcohols) and elemental composition were used to assign
the sources of OM to natural and anthropogenic inputs and to infer post-deposition OM transformation.
Experimental
Study area
Ilha Grande Bay (IGB) is located in the southern portion of Rio de Janeiro state, SE Brazil (22°50’–23°20’ S and 44°00’–44°45’ W). With 650 km² of area and 2,300 km² of a drainage basin, the IGB is unique because of its proximity to Serra do Mar, a long mountain ridge that reaches to over 2,000 m.19 The region has great ecological importance
and is composed of two water bodies separated by a large island (Ilha Grande, IG). Two of the most remarkable characteristics of IGB are its highly angled coastline and the presence of small rivers, which cause a sharp variability in freshwater discharge to the system when there are seasonal variations in rainfall. Several coastal ecosystems can be found in the surrounding areas, such as mangroves, coastal lagoons, tidal flats, sandy beaches, rocky shores, etc.
Three sectors were defined for IGB, namely the West Portion, Central Channel and East Portion.20 In general,
the bathymetry within the East and West portions is very smooth and the depth slowly increases seawards.20 The tidal
wave reaches the IGB simultaneously at the West and East portions and is divided by the IG, which might explain the enhanced contribution of tide-related frequencies to water circulation.21 There is an apparent quasi-steady clockwise
circulation around Ilha Grande,21,22 thus, seawater from
the Atlantic Ocean enters the bay from the west, is mixed inside with lower salinity waters inside the bay and its outflux leaves the eastern portion. There is also evidence for communication with Sepetiba Bay,23 which raises the
possibility of organic matter importation from this adjacent region.
Along with industry, tourism and economic growth, the two cities surrounding IGB, namely Angra dos Reis and Paraty, have experienced dramatic population increases during recent decades.24 This increase is much
higher than the one experienced in Rio de Janeiro state as a whole, and it was over two times higher for Paraty and almost four times higher for Angra dos Reis. The increase is even more impressive over a longer period of time; the population in the two cities has grown from 28,256 inhabitants in 1940 to 207,044 in 2010.25
Notwithstanding the increasing human pressures, the IGB on the whole remains well-preserved.19
Sampling
Four sediment cores were collected from IGB using a 1 m long Kullemberg-type sediment profiler (Husky-Duck, Brazil). Sampling points were chosen according to their different types and levels of anthropogenic impact, as follows: core T is near a large oil terminal; core M is located close to Angra dos Reis city center; core A is located at Abraão, Ilha Grande’s second largest village and main quay; and core C is in a very pristine location with minimal human occupation. The cores were sliced in 2-cm intervals until 20 cm, and from this depth on, 5-cm intervals were used until the end of each core, except for the cores taken for 210Pb measures, which were sliced in 1-cm intervals.
The sediment cores were analyzed for elemental composition, grain size parameters, radionuclides and molecular markers (sterols and n-alcohols). The total organic
carbon (OC) and total nitrogen (TN) were determined using a Carlos Erba 1110 Elemental Analyzer. Acetanilide (C6H5NH(COCH3)) was used to plot the calibration curve, and precision was determined with certified sediment (PACS-2). Grain size, organic matter and CaCO3 content were determined by weight difference after reacting with H2O2 and HCl according to usual methods.26 Sediment
chronology and sedimentation rates were obtained by 210Pb
dating method described by Godoy et al..27 The summarized
procedure starts with the leaching of 3 g aliquots with 40 mL of 0.5 mol L–1 HBr for two hours at 80 °C. The resulting
solution was centrifuged, and the residue was leached with 40 mL of 0.5 mol L–1 HBr and 1.0 g hydroxylamine
hydrochloride for two hours at 80 °C. A lead carrier was added to the solution, and the mixture was transferred to an ion-exchange column containing Dowex 1X8, 50-100 mesh. This procedure was followed by a cleaning step with 0.5 mol L–1 HBr and 1.0 g hydroxylamine hydrochloride and
further elution with 1 mol L–1 HNO
3. Lead was precipitated
as chromate, and the chemical yield was obtained gravimetrically. A two week-period was awaited prior to the concentration of 210Pb, which was determined based on
its daughter decay product (210Bi) by beta counting on a ten
channel, low level proportional counter (Perkin-Elmer Prof Berthold LB-750). The minimum detectable activity for this technique is 3 Bq kg–1 (1 Bq–1 for 1 g sample) for 1000 min
of counting time.
The 210Pb sediment dating method is based on the
measurement of excess or unsupported 210Pb activity, which
is incorporated rapidly into the sediment from atmospheric fallout and water column scavenging. Once incorporated into the sediment, unsupported 210Pb decays with time
according to its known half-life (22.3 years). The logarithm of the 210Pb concentration vs. sediment depth were first
plotted, and excess 210Pb was then calculated by subtracting
the constant 210Pb value observed in the core bottom.
Reagents and chemicals
The standards of of 5α-androstan-3β-ol (98% purity), 5α-cholestane (99% purity), 5β-cholestan-3β-ol (> 98% minimum purity), 5β-cholestan-3α-ol (> 95% minimum purity), cholest-5-en-3β-ol (94% purity), 5α -cholestan-3β-ol (95% purity), 24-ethylcholest-5,22E-dien-3β-ol (95% purity), 24-methylcholest-5-en-3β-ol (ca. 65% purity) and 24-ethylcholest-5-en-3β-ol (98% purity) were purchased at Sigma Aldrich. Hexanes (95% purity) and dichloromethane (99.9% purity) were supplied by M. Chemicals, while methanol (99.96% purity) was purchased at J. Baker. Sodium sulfate anhydride (> 99% purity) and alumina (aluminum oxide activated and neutral, 150 mesh) were purchased at Sigma Aldrich and silica (silica gel 60, 0.063-0.200 mm) was supplied by Merck. N,O-bis(trimethylsilyl) trifluoroacetamide (BSTFA) was purchased at Supelco.
Lipid analysis
Sediments were dried at 60 °C and 10 g subsamples were portioned out. Samples and eleven procedure blanks were spiked with the surrogate standard 5α -androstan-3β-ol. The samples were Soxhlet extracted for 24 h with 200 mL of dichloromethane and later concentrated to 1 mL with a rotary evaporator. Concentrated extracts were taken with hexanes prior to clean-up and fractionated by passing them through a glass chromatography column (with 7 g of deactivated aluminum oxide, 10 g of deactivated silica gel, 2 g of copper and 2 g of sodium sulfate). The sterols and n-alcohol fraction (F3) was isolated by elution with
50 mL of a mixture of dichloromethane-methanol (9:1, v:v), after isolation of aliphatic hydrocarbons (F1; 30 mL of hexanes) and aromatic hydrocarbons (F2, 75 mL of 1:1 mixture of n-hexane-dichloromethane). The F1 and F2 fractions were not considered in the present study. Prior to gas chromatography/mass spectrometry (GC/MS), the F3 extracts were derivatized into their trimethylsilyl (TMS) derivatives with BSTFA using acetonitrile (CH3CN) as a
catalyst. After that, an internal standard (5α-cholestane, 2500 ng) was added. The fractions were analyzed using a gas chromatography-mass spectrometer (GC/MS; Finnigan Focus DSQ GC/MS system), which was operated at full-scan (m/z 50-550), and a VF-5MS column
(n-C18OH, n-C19OH, cholest-5-en-3β-ol, 5β-cholestan-3β-ol, 5α-cholestan-3-one, 5β-cholestan-3-one, 5α -cholestan-3β-ol, 24-methylcholest-5-en-3β-ol, 24-ethylcholest-5,22E-dien-3β-ol and 24-ethylcholest-5-en-3β-ol) and by considering the peak areas of key ions (m/z 129 or 215 for
sterols and m/z 103 for n-alcohols) and response factors
relative to the internal standard (5α-cholestane, m/z 217). Similar response factors for key ions were assumed for structurally related compounds for which standards were not commercially available. GC/MS component identification was based on a full spectrum scan obtained from the available standards or by comparing them with spectra in the literature from other compounds. The limit of detection (LOD), determined for each compound, was the standard deviation of at least seven replicate analysis of a standard solution with a concentration near the estimated LOD, multiplied by 3 and divided by the mean extracted sediment mass.28 The limit of
quantificationt (LOQ) was the lowest point of the calibration curve divided by the mean extracted sediment mass. The LOD and LOQ obtained for this study was, respectively, 3.00 ng g–1 and 10.00 ng g–1.
Samples with recovery out of 50-120% range were disregarded and reextracted. Average recovery of surrogate standard in sediment samples was 84 ± 15%. The recovery of same standard for procedure blanks was 83 ± 14%.
Statistical analysis
Principal component analysis (PCA) was used to identify the dominant factor contributing to the variance in the molecular markers dataset. The following compounds were considered, including the symbols used to represent them in the corresponding PCA figures: the stenols cholest-5-en-3β -ol (27∆5), 24-methylcholest-5-en-3β-ol (28∆5), 5α
-cholestan-3β-ol (27∆0), 24-methylcholest-5,22E-dien-3β-ol (28∆5,22),
24-methylcholest-5,24(28)-dien-3β-ol (28∆5,24(28)),
24-ethylcholest-5-en-3β-ol (29∆5),
24-ethylcholesta-5,22E-dien-3β-ol (29∆5,22) and 4α
,23,24-trimethylcholest-22-en-3β-ol (30∆22), the stanols 5α-cholestan-3β-ol
(27∆0), 24-methyl-5α-cholestan-3β-ol (28∆0),
24-ethyl-5a-cholestan-3β-ol (29∆0) as a single group, phytol and
the n-alcohols (n-C14OH, n-C16OH, n-C18OH, n-C22OH, n-C24OH, n-C26OH, n-C28OH, n-C30OH and n-C32OH). Prior
to PCA analysis, the dry weight concentrations (µg g–1) were
normalized by dividing each observation by the sum of all observation of that variable, followed by subtraction of this calculated values by the mean concentration and division by the standard deviation.29 Varimax rotation was selected
to represent the planar projection of the loadings (variables) and scores (samples) for the two principal components, using the Statistica® v7.0 package.
Results
Sedimentation rates and estimated age
The constant flux sedimentation (CF:CS) model was applied to find the sedimentation rates, and the ages were calculated according to the sediment depth and respective sedimentation rate. Profiles for total and excess of 210Pb
are available as Supplementary Information (Figure S1). Higher rates were found in M (0.55 ± 0.09 cm yr–1); on
the other hand, lower and very similar rates were found for A and T (0.33 ± 0.03 and 0.30 ± 0.04 cm yr–1). The
rate could not be found for core C because of surface layer mixing; nevertheless, because A has similar oceanographic features and is close to C, the sedimentation rate for A was also used on C. Thus, the last layer of core A was approximately 245 years old, core C was 260 years old, core T was 235 years old, and core M was only 109 years old. Difference in age of cores A and C is length related. Since dating methods based on 210Pb model is limited to
150 years,27 the age determination of samples older than
that are not reliable. Nevertheless samples with calculated ages older than 150 years should be considered as natural condition for Ilha Grande Bay.
Bulk parameters
Detailed results for the bulk sediment parameters are presented in Table 1, and the complete dataset are presented as Supplementary Information (Tables S1-S3). OC and TN results were used to separate the four cores into group I (cores A and C) and group II (cores T and M). Group I cores are enriched in C and N when compared to group II cores. As shown in Figure 2, cores A and C have OC concentration usually as high as 28 mg g–1, whereas cores T and M show,
on average, approximately 10 mg g–1 of OC. The same
grouping is observed for fine sediment contents, where again, A and C contribute more fine sediments and cores T and M have fewer of these sediments, although some sharp changes can be observed in the M profile.
(from about 7 mg g–1 to approximately 20 mg g–1). The total
nitrogen levels in all four cores have similar variations to those observed in OC.
Molecular markers
Total sterols (Σ sterols) show concentrations (in ng g-1)
of 1,441 ± 1,858 in core A, 930 ± 354 in core C, 516 ± 652 in core T and 834 ± 726 in core M. The highest Σ sterols (9,320 ng g–1) were found in sample A02-04, and the
lowest value (71 ng g–1)was found in T30-35 (Table 1).
The n-alcohols are much more abundant in core C than in
any other sediment core, with the average total n-alcohols
concentration reaching 4.39 ± 2.82 ng g–1. In core A, the
Σ n-alcohol was 2,615 ± 883, with M and T yielding
lower concentrations (1,135 ± 370 and 968 ± 800 ng g–1,
respectively).
As a general rule, the higher molecular marker concentrations were found in the surface layers and lower concentrations were observed downcore. In fact, sterols were enriched several times in the surface layers, especially at core M, whereas the core C shows little or no enrichment. The n-alcohols, however, do not present an
up-core enrichment pattern, and core C showed an opposite trend, with decreasing n-alcohols concentration towards
recently deposited sediments (Table 1).
Sterols containing 29-carbon atom chains were predominant in almost all samples. 24-ethyl-cholesta-5,22-dien-3β-ol, 24-ethyl-cholest-5-en-3β-ol and 24-ethyl-5α-cholest-3β-ol (29∆5,22, 29∆5 and 29∆0) accounted for at
least 33.5 ± 8.8% on average (at core M) and a maximum of 52.9 ± 11.9% (at core C) of the total sterols. Cholest-5-en-3β-ol, 5α-cholestan-3β-ol and 4α
,23,24-trimethyl-5α-cholest-22-en-3β-ol (27∆5, 27∆0 and 30∆22) were also
relatively abundant in most samples (Figure 3).
The most abundant n-alcohols were the long-chain
compounds (LCOH; > C23) with 22 to 30 carbon atoms (Table 1). The sum of n-C26OH, n-C28OH and n-C30OH
represented approximately 45.0 ± 11.5% of Σn-alcohols in
all the samples; in M30-35, these three alcohols accounted for up to 72% of the total n-alcohols. At T and M, where
lower total concentrations were found, short-chain
n-alcohols (SCOH; < C22) were more important compared
to the long-chain n-alcohols. n-C20OH appears to be the
main contributor to SCOH. Phytol was found in very small concentrations in all four cores, and only 33 out of a total of 84 samples (39%) exhibited quantifiable amounts of this compound. Only the sample A14-16 had concentration higher than 100 ng g–1. Cores A and T had
a modest enrichment trend in n-C20OH towards recently
deposited sediments, although the trend could not be considered linear.
Discussion
Evolution of sediment bulk geochemistry
Concentrations of OC and TN were in the same range of other cores collected from water bodies along the Brazilian Figure 2. Organic carbon concentrations (mg g–1) in the sediments cores:
A: Abraão (black circle); C: Saco do Céu (gray triangle); T: TEBIG (gray diamond) e M: Marina Piratas (open black square).
Figure 3. Four majors sterols in the sediment profiles: (a) Abraão; (b) Saco
coast,16,17,30 although T and M may exhibit lower values.
There was a clear separation between the four cores, A and C had higher OC contents and higher proportions of fine (silt and clay) sediments, whereas T and M were OC and fine sediments depleted. The differences are most likely related to different levels of organic matter input to sediments, grain-size and hydrodynamic patterns, which together control the OM input and preservation in the sedimentary record.8 Fine sediments are usually enriched in
OC; thus, there is a not surprisingly significant correlation between these two variables (r = 0.70, p < 0.05 when all
cores are considered).
The C/N ratios between 5.9 and 15.6 indicate a mixture of allochthonous and autochthonous OM sources. Here again, cores A and C are set apart from cores T and M because the former presented higher C/N values. These data indicated that allochthonous OM seems to have greater importance in the areas represented by cores A and C. At core M, the C/N ratio profile was highly variable, with lower values found at the top of the core. Core T, however, showed no sign of changes in the OM source, and the same statement might be applied to core C. The presence of preserved Atlantic rain forest and mangrove areas, together with local depositional basin morphology, could Table 1. Organic carbon, total nitrogen, C/N ratio, grain size, lipid biomarkers (sterols and n-alcohols) concentrations in Ilha Grande Bay sediment cores
Abraão Saco do Céu TEBIG Marina Piratas
–
x σ Min Max –x σ Min Max –x σ Min Max –x σ Min Max OC / (mg g–1) 23.7 2.7 16.6 29.3 27.3 2.2 2.2 3.3 9.7 2.6 6.3 16.2 11.0 6.0 5.5 29.5
TN / (mg g–1) 2.7 0.3 2.0 3.4 2.8 0.3 22.3 30.4 1.5 0.4 0.9 2.3 1.3 0.7 0.6 3.0
C/N 10.1 0.6 8.8 11.6 11.6 0.6 10.6 13.1 7.5 0.6 6.1 8.5 10.0 3.2 5.9 15.6
% Fine sediment 87.3 13.4 40.2 96.2 91.1 4.1 83.6 96.5 60.4 11.0 39.8 77.0 48.6 26.4 13.3 91.2
Sterols / (ng g–1)
27∆5 323 882 41 4,158 87 64 40 351 72 97 ND 456 102 66 31 318
27∆0β 20 12 ND 44 12 7 8 37 10 14 ND 67 28 21 ND 87
28∆5,22 72 146 ND 684 11 33 ND 153 16 43 ND 195 27 33 ND 123
28∆5,24(28) 28 71 ND 333 19 7 ND 28 11 9 ND 29 5 8 ND 37
28∆5 80 148 ND 714 36 13 18 75 27 33 ND 155 27 38 ND 130
29∆5,22 92 83 25 389 172 232 29 772 53 80 10 356 63 59 ND 232
29∆5 254 192 84 941 190 69 77 419 98 139 ND 597 119 140 < LOQ 529
27∆0 91 61 30 294 54 23 31 135 51 63 ND 290 100 63 20 286
28∆0 61 42 22 192 41 13 26 76 29 22 ND 95 51 50 ND 184
29∆0 168 71 87 357 141 35 89 221 76 72 ND 319 126 105 23 370
30∆22 156 80 71 437 125 50 54 277 47 36 15 156 92 71 ND 234
Total 1,441 1,858 575 9,320 930 354 448 1,730 516 652 71 3,024 834 726 148 2,800
n-Alcohols / (ng g–1)
C14OH 38 29 < LOQ 114 51 32 13 169 49 31 < LOQ 102 33 19 ND 73
C16OH 55 72 < LOQ 274 99 174 < LOQ 789 47 57 < LOQ 179 48 56 < LOQ 194 C18OH 40 54 < LOQ 210 74 114 < LOQ 508 38 42 < LOQ 115 13 18 < LOQ 70
Phytol 26 22 ND 64 6 13 ND 52 5 9 ND 43 28 28 ND 125
C20OH 127 66 < LOQ 312 116 39 < LOQ 197 120 73 < LOQ 283 68 39 ND 140
C22OH 160 59 42 264 167 34 119 235 78 34 ND 176 67 34 ND 145
C24OH 214 84 15 397 320 115 110 574 90 27 11 137 63 28 31 137
C26OH 335 116 55 543 547 233 138 933 143 55 20 316 97 53 20 214
C28OH 466 187 168 870 954 605 119 3,014 144 54 < LOQ 275 141 167 24 782
C30OH 492 238 172 984 1,257 1,147 87 5,996 157 63 10 272 188 398 10 1,802 C32OH 381 248 104 1,040 888 614 45 2,938 133 60 10 246 76 110 < LOQ 510 Total 2,615 883 964 4,485 4,930 2,819 1,702 15,407 1,135 370 130 1,649 968 800 160 3,798
explain the higher contribution of land plant-derived OM for cores A and mostly C. Falling leaves and twigs are likely an important source of allochthonous OM; nevertheless, soil organic matter (SOM) is probably the main source of allochthonous material. Unlike leaves and twigs, SOM has lower C/N ratios.31 The elevated precipitation combined
with dense forest cover is capable of supporting sediments with soil-derived OM throughout the year.
For samples deposited during the 1960s, it is possible to observe an abrupt alteration in sediment input, with increasing proportions of fine sediments. Since that time, Angra dos Reis has faced a demographic boom related to economic growth. Areas that are now occupied with urban facilities were mangroves or other coastal environments in prior years.24 The Σn-alcohols in core M presents an
isolated peak just a few years prior to the increase in fine sediments and a few years after that, the C/N ratio dropped from 12 to approximately 6. Thus, it is possible that the deforestation of mangroves is registered through the episodic increase in Σn-alcohols [mostly long-chain
alcohols (LCOH)], and fine sediments that were retained in mangrove systems were slowly released and reached areas that were inaccessible before. The reduction in mangrove-derived OM is suggested by the diminution of the C/N ratio that approaches phytoplankton-derived OM.32
Organic matter sources and degradation process
The sterol distribution in the sediment from the four analyzed cores was very similar, with higher concentrations of 29∆5 and 27∆5 compared to the other sterols. These two
sterols are commonly considered markers of planktonically-derived OM,5,10 and are therefore the input of autochthonous
OM into the studied sediments. However, the dominance of LCOH is an indication of a relevant terrestrial OM addition because these compounds are mainly produced by higher land plants.33,34
Stigmasterol (29∆5,22) is known as a land plant-derived
sterol,35 although its specificity is sporadically questioned.36
Diatoms and phytoflagellates37 are also important sources
for this sterol. Over the last two to three decades, the major sterol concentrations in T and M grew several times, from approximately 50 ng g–1 up to 500 ng g–1 (Figure 3),
and because no pattern was observed in the 5α(H)stanol/
∆5stenol ratio variation, we believe that this increase in
concentration is caused by increasing OM input rather than degradation processes since OC concentrations also increased.38 Enhanced OM delivery to sediments might be
caused by eutrophication related to population growth and an inadequate sewage treatment system.
Although planktonic community assessment is limited for IGB, the dominance of diatoms over other microphytoplanktonic classes has been documented.39 In
addition, dinoflagellates are also quantitatively important and sometimes dominate the microphytoplanktonic community.40 Such scenario has been observed in Angra
dos Reis since the 1970s. Two diatoms commonly found in great abundance, namely Pseudo-nitzschia seriata and Cylindrotheca closterium, are 27∆5 producers and might be
important sources of this sterol.41 Another important diatom
called Skeletonema costatum produces large amounts of
28∆5,24(28), which are found only in minor amounts in IGB
cores. Nevertheless, nanoplanktonic phytoflagellates are considered to be the most abundant phytoplanktonic group in the IGB,40 and despite its small cell size,42 the group is
likely to be a very important source of OM in sediments. Two sterols, 29∆5 and 29∆5,22, are between the major sterols of a
few phytoflagellates classes,43 such as Chlorophyceae and
mostly Chrysophyceae species. Therefore green algae classes
contribution cannot be neglected because they are sources of C29 sterols, which were abundant in sediment samples.44
The very low concentration of most SCOH is consistent with the labile characteristics of these planktonic markers.8
We believe that the planktonic contribution for n-alcohols
is lessened by the efficient degradation occurring within the water column. The oxic conditions found all around the IGB,19 favor the aerobic degradation process.
As mentioned earlier, soil organic matter leaching is most likely to be the main source of allochthonous OM in sediments. Thus, refractory terrestrial OM, which is composed primarily of Atlantic forest plant litter, reaches the IGB and resists degradation processes. On the other hand, autochthonous material seems to be affected by these degradation processes. The relative abundance of individual LCOH gives insights about the sources of the allochthonous OM to the studied area. It is noteworthy that in cores A and especially ate core C, the n-C30OH is
the major long-chain n-alcohol (Figure 4). This profile is
associated with the presence of C3 land plants,33 which is
consistent with the location of these cores, i.e., in a region
surrounded by mangrove and Atlantic forest, with minimal human interference (in the case of core C).
The evidence provided by lipid biomarkers on the sources of OM is apparently conflicting, as discussed before. Therefore, to appraise the OM portion in the studied sediments, a principal component analysis (PCA) was performed to gain some insight into this subject.
Principal component analysis (PCA)
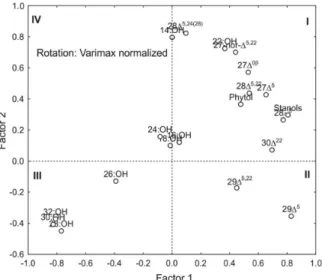
The PCA analysis resulted in two factors, which explain a total of 57.2% of the molecular markers data variance (Figure 5). Most sterols presented a positive correlation with factor 1 (44.2% of the total variance), with the highest loadings observed for 30∆22, 28∆5, stanols (27∆0, 28∆0
and 29∆0) and 29∆5. On the other hand, negative loadings
on factor 1 were observed for the LCOH, especially the
n-C28OH, n-C30OH and n-C32OH. Based on that, factor 1
was able to separate the inputs from terrestrial OM (with negative loadings) with the planktonic OM (with positive loadings). factor 2 (12.4% to total data variance) give additional resolution to separate sterols associated with ambiguous sources (i.e., 29∆5 and 29∆5,22) from sterols
from known planktonic sources.43
The results of the loadings (Figure 5) suggested four quadrants with respect to OM sources: quadrant I has a strong signal of planktonic-OM; quadrant III is dominated by allochthonous OM; quadrant II is a mixture between autochthonous and allochthonous OM; quadrant IV is non-specific.
The plot of the scores (i.e., samples) from the PCA analysis allowed the assignment of the main sources of
OM to each studied core (Figure 6). Samples from core A were distributed roughly between quadrants II and III, although a few samples were found in quadrants I and IV. As a general trend, samples from the base of core A, the oldest ones, were distributed in quadrant III whereas the recently deposited samples from this core were found in quadrant II (Figure 6). This trend suggested a change from a predominance of allochthonous sources in the past to a mixture of sources in the present in the core A. The shift of samples from one quadrant to another matches the 1960s, a time of important population growth all around the IGB.24
Even though that information about land-use in Ilha Grande is lacking, it is probable that these changes were caused by a reduction of land plant OM input caused by deforestation and an increasing planktonic-OM contribution promoted by continuous nutrient enrichment.45
Most samples from core C were placed at quadrant III, suggesting a predominance of allochthonous sources to the bulk of sedimentary OM over the entire period represented by this core (over 200 years). On the other hand, as few samples from core C are found in quadrant II, with maximum loadings in factor 1 observed for the surface samples of this core (Figure 6). This might suggest an increased contribution of planktonic inputs of OM in recent times, but may also be derived from a contribution of 29∆5,22 and 29∆5 from terrestrial sources only at the
location of core C.35
Core T samples, which present low concentrations of most molecular markers, had a negative correlation with factor 1 for almost all samples collected prior to the 1930s, and after that, the positive correlation with factor 1 increases, with more recent layers located in quadrant II. Because there were low concentrations of most compounds (sterols and n-alcohols) in almost all samples at core T, it
was concluded that the PCA must be evaluated with caution. Because core M sample distribution was mostly based on quadrants I and II, this core is considered to be strongly dominated by autochthonous OM. Despite that designation, samples from 1940 to 1960 are scattered throughout quadrants III and IV, and within this period, Angra dos Reis faced several dramatic changes in land use such as the removal of mangrove forests.24 In the areas around M, the
mangrove destruction could have released a large amount of soil and land plant-OM, which would have affected the molecular marker fingerprint of sediments deposited at that time.
Sewage contamination
Coprostanol (27∆0β) is a marker for domestic waste-derived organic matter.12 It is an sterol produced in the
Figure 6. Projections (Varimax rotated) of the scores obtained in PCA analysis. All the samples in the cores A, C, T and M are represented respectively by open circles, black squares, gray diamond and black triangles. Samples of each core were numbered starting at 01 following the order of core depth from top to base layers, where lower numbers represent younger samples and higher represent older ones.
Table 2. Coprostanol concentrations in coastal areas from different Brazilian regions
Location Sedimentary layer / cm Deposition environment Concentration range / (µg g–1) Reference
Ilha Grande bay-RJ 0-90 Estuarine-coastal < 0.01-0.09 Present study
Sepetiba bay-RJ 0-2 Estuarine 0.01-0.42 47
Guanabara bay-RJ 0-3 Estuarine 0.34-40.00 18
Ubatuba bay-SP 0-3 Coastal 0.01-0.27 48
Cubatão area-SP 0-3 Mangrove 4.21-8.32 49
Santos bay-SP Surperficial Coastal < 0.01-8.51 50
Paranaguá bay-PR 0-2 Estuarine < 0.10-2.22 51
Esp.Santo bay-ES 0-50 Coastal < 0.01-2.72 52
Recife-PE 0-3 Fluvial-estuarine 0.52-7.31 53
Mundaú Manguaba-PB 0-47 Lagoonal-estuarine 0.15-5.65 54
digestive tracts of humans and higher vertebrates by the degradation of cholesterol.46 The concentration of
coprostanol in IGB sediments is much lower than the concentration reported in previous studies of coastal environments along the Brazilian coast (Table 2). These include areas ranging from low (e.g., Ubatuba-SP and Paranaguá-PR bays) to extremely high (e.g., Guanabara and Espírito Santo bays) levels of sewage contamination.
Conclusions
The four sediment cores could be clearly differentiated into two groups, one with high organic carbon content, high proportions of fine sediments and higher concentrations of molecular markers, whereas the other group is poor in organic carbon, fine sediments and molecular markers. Forest litter is thought to be the major source of organic matter to sediments though planktonic contribution cannot be neglected.
The study has revealed important changes in organic matter delivery and preservation at sedimentary record during the last century. Eutrophication and deforestation evidences were found at cores analyzed demonstrating the relevance of analyzing sediment cores.
Despite the population growth experienced in the last century, fecal contamination is still a minor issue for IGB sediment pollution; nevertheless, all efforts should be made to avoid an increase in pollution levels.
Brazilian coastline occupation has experienced major growth over the last decades. Therefore, studies aiming the comprehension of its fingerprints at sedimentary record are of great value for further application elsewhere along Brazilian coast.
Supplementary Information
Supplementary information is available free of charge at http://jbcs.sbq.org.br as PDF file.
Acknowledgments
We thank FAPERJ for financial support for the project. ECR was a MSc student granted by a scholarship from CNPq. The authors also thank the comments provided by three reviewers. RSC is a research fellow of CNPq (proc. No. 303399/2010-4).
References
1. Bauer, J. E.; Cai, W.-J.; Raymond, P. A.; Bianchi, T. S.; Hopkinson, C. S.; Regnier, P. A. G.; Nature2013, 504, 61. 2. Ver, L. M. B.; Mackenzie, F. T.; Lerman, A.; Chem. Geol.1999,
159, 283; Gattuso, J.-P.; Frankignoulle, M.; Wollast, R.; Annu.
Rev. Ecol. Syst.1998, 29, 405.
3. Vitousek, P.; Mooney, H.; Lubchenco, J.; Melillo, J.; Science
1997, 277, 494.
4. Ruddiman, W. F.; Annu. Rev. Earth Planet. Sci.2013, 41, 45; Canuel, E. A.; Cammer, S. S.; McIntosh, H. A.; Pondell, C. R.; Annu. Rev. Earth Planet. Sci.2012, 40, 685.
5. Bianchi, T. S.; Canuel, E. A.; Chemical Biomarkers in Aquatic
Ecosystems, Princeton University Press: Princeton, 2011. 6. Bianchi, T. S.; Canuel, E. A.; Org. Geochem.2001, 32, 451. 7. Zonneveld, K. A. F.; Versteegh, G. J. M.; Kasten, S.; Eglinton,
T. I.; Emeis, K.-C.; Huguet, C.; Koch, B. P.; de Lange, G. J.; de Leeuw, J. W.; Middelburg, J. J.; Mollenhauer, G.; Prahl, F. G.; Rethemeyer, J.; Wakeham, S. G.; Biogeosciences2010, 7, 483. 8. Wakeham, S. G.; Canuel, E. A. In Handbook of Environmental
Chemistry, Volume 2: Reactions and Processes 2 (N); Volkman, J. K., eds.; Springer: Berlin, 2006. pp 295-321.
9. Eglinton, G.; Murphy, M. T. J.; Organic Geochemistry - Methods and Results, Springer-Verlag: Berlin, 1969.
10. Volkman, J. K. In Handbook of Environmental Chemistry, Volume 2: Reactions and Processes 2 (N); Volkman, J. K., eds.; Springer: Berlin, 2006. pp 27-70.
11. Saliot, A.; Laureillard, J.; Scribe, P.; Sicre, M. A.; Mar. Chem.
1991, 36, 233.
12. Eganhouse, R. P.; Molecular Markers in Environmental Geochemistry, American Chemical Society: Washington, 1997. 13. Bigus, P.; Tobiszewski, M.; Namieśnik, J.; Mar. Pollut. Bull.
2014, 78, 26.
14. Heim, S.; Schwarzbauer, J.; Environ. Chem. Lett.2013, 11, 255; Eisenreich, S. J.; Capel, P. D.; Robbins, J. A.; Bourbonniere, R.; Environ. Sci. Technol.1989, 23, 1116.
15. Combi, T.; Taniguchi, S.; Ferreira, P. A. D.; Mansur, A. V.; Figueira, R. C. L.; Mahiques, M. M.; Montone, R. C.; Martins, C. C.; Arch. Environ. Contam. Toxicol.2013, 64, 573; Wagener, A.; Hamacher, C.; Farias, C.; Godoy, J. M.; Scofield, A.; Mar. Chem.2010, 121, 67; Pietzsch, R.; Patchineelam, S. R.; Torres, J. P. M.; Mar. Chem.2010, 118, 56.
16. Martins, C. C.; Bícego, M. C.; Mahiques, M. M.; Figueira, R. C. L.; Tessler, M. G.; Montone, R. C.; Environ. Pollut.2010, 158, 3355.
17. Carreira, R. S.; Araújo, M. P.; Costa, T. L. F.; Spörl, G.; Knoppers, B. A.; Mar. Chem.2011, 127, 1; Carreira, R. S.; Wagener, A. L. R.; Fileman, T.; Readman, J.; Macko, S. A.; Veiga, A.; Mar. Chem.2002, 79, 207.
18. Carreira, R. S.; Wagener, A. L. R.; Readman, J. W.; Estuar. Coast. Shelf Sci.2004, 60, 587.
19. Creed, J. C.; Oliveira, A. E. S.; Pires, D. O.; Figueiredo, M. A. O.; Ferreira, C. E. L.; Ventura, C. R. R.; Brasil, A. C. S.; Young, P. S.; Absalão, R. S.; Paiva, P. C.; Castro, C. B.; Serejo, C. S. In Biodiversidade Marinha da Baía da Ilha Grande; Creed, J. C.; Pires, D. O.; Figueiredo, M. A. O., eds.; MMA/ SBF: Brasília, 2007, vol. 1.
20. Belo, W. C.; Dias, G. T. M.; Dias, M. S.; Rev. Bras. Geofís.
2002, 20, 5.
21. Signorini, S. R.; Braz. J. Oceanog.1980, 29, 41. 22. Ikeda, Y.; Stevenson, M.; Braz. J. Oceanog.1980, 29, 89. 23. Miranda, L. B.; Ikeda, Y.; Castro-Filho, B. M.; Pereira-Filho, N.;
Braz. J. Oceanog. 1977, 26, 249.
25. http://cidades.ibge.gov.br/painel/painel.php, accessed in June 2012.
26. Loring, D. H.; Rantala, R. T. T.; Earth-Sci. Rev.1992, 32, 285. 27. Godoy, J. M.; Moreira, I.; Wanderley, C.; Simões-Filho, F. F.;
Mozeto, A. A.; Radiat. Prot. Dosim. 1998, 75, 111.
28. EPA. Appendix B. Risk Burn Guidance for Hazardous Waste Combustion Facilities. EPA 530-R-01-001, Environmental Protection Agency: Washington, 2001.
29. Wagener, A. L. R.; Meniconi, M. F. G.; Hamacher, C.; Farias, C. O.; da Silva, G. C.; Gabardo, I. T.; Scofield, A. L.; Mar. Pollut. Bull.2012, 64, 284.
30. Santos, E. S.; Carreira, R. S.; Knoppers, B. A.; Braz. J. Oceanog.
2008, 56, 97; Mater, L.; Alexandre, M. R.; Hansel, F. A.; Madureira, L. A. S.; J. Braz. Chem. Soc.2004, 15, 725. 31. Beligotti, F. M.; Carreira, R. S.; Soares, M. L. G.; Geochim.
Bras.2007, 21, 71; Meyers, P. A.; Org. Geochem.1997, 27, 213.
32. Meyers, P. A.; Chem. Geol.1994, 114, 289.
33. Vogts, A.; Moossen, H.; Rommerskirchen, F.; Rullkötter, J.; Org. Geochem.2009, 40, 1037.
34. Treignier, C.; Derenne, S.; Saliot, A.; Org. Geochem.2006, 37, 1170.
35. Volkman, J. K.; Org. Geochem.1986, 09, 83.
36. Volkman, J. K.; Revill, A. T.; Bonham, P. I.; Clementson, L. A.; Org. Geochem.2007, 38, 1039.
37. Burns, K. A.; Volkman, J. K.; Cavanagh, J.-A.; Brinkman, D.; Mar. Chem.2003, 80, 103.
38. Wakeham, S. G.; Nature1989, 342, 787.
39. MRS, 2007. Estudo de Impacto Ambiental da Unidade 3 da Central Nuclear Almirante Álvaro Alberto, Eletronuclear, Rio de Janeiro, Instituto Brasileiro de Meio Ambiente e Recursos Naturais Renováveis, Brasília. 2007.
40. UERJ; UFF; UFRJ, 1991. Estudos dos efeitos da retenção de Hidrocarbonetos em ambientes costeiros na Baía da Ilha
Grande, Rio de Janeiro; Figueiredo, L. H. M., Relatório Final. 1991, UERJ: Rio de Janeiro p. 229.
41. Rampen, S. W.; Abbas, B. A.; Schouten, S.; Damste, J. S. S.; Limnol. Oceanogr.2010, 55, 91.
42. Throndsen, J. In Identifying Marine Phytoplankton; Tomas, C. R., eds.; Academic Press: San Diego, 1997. pp. 591-729. 43. Volkman, J. K.; Barret, S. M.; Blackburn, S. I.; Mansour, M. P.;
Sikes, E. L.; Gelin, F.; Org. Geochem.1998, 29, 1163. 44. Kodner, R. M.; Pearson, A.; Summons, R. E.; Knoll, A. H.;
Geobiology2008, 6, 411.
45. Zimmerman, A. R.; Canuel, E. A.; Mar. Chem.2000, 69, 117. 46. McCalley, D. V.; Cooke, M.; Nickless, G.; Water Res.1981, 15,
1019.
47. Carreira, R. S.; Ribeiro, P. V.; Silva, C. E. M.; Farias, C. O.; Quim. Nova2009, 32, 1805.
48. Muniz, P.; Pires-Vanin, A. M. S.; Martins, C. C.; Montone, R. C.; Bicego, M. C.; Mar. Pollut. Bull.2006, 52, 1098. 49. Campos, V.; Fracácio, R.; Fraceto, L.; Rosa, A.; Aquat.
Geochem.2012, 18, 433.
50. Martins, C. C.; Gomes, F. B. A.; Ferreira, J. A.; Montone, R. C.; Quim. Nova2008, 31, 1008.
51. Martins, C. C.; Braun, J. A. F.; Seyffert, B. H.; Machado, E. C.; Fillmann, G.; Mar. Pollut. Bull.2010, 60, 2137.
52. Grilo, C. F.; Neto, R. R.; Vicente, M. A.; de Castro, E. V. R.; Figueira, R. C. L.; Carreira, R. S.; Appl. Geochem.2013, 38, 82.
53. Fernandes, M. B.; Sicre, M.-A.; Cardoso, J. N.; Macedo, S. J.; Sci. Total Environ.1999, 231, 1.
54. Araujo, M. P.; Costa, T. L. F.; Carreira, R. S.; Quim. Nova2011, 34, 64.
Submitted on: November 22, 2013