www.atmos-chem-phys.net/10/51/2010/
© Author(s) 2010. This work is distributed under the Creative Commons Attribution 3.0 License.
Chemistry
and Physics
Comparison of in situ and columnar aerosol spectral measurements
during TexAQS-GoMACCS 2006: testing parameterizations for
estimating aerosol fine mode properties
D. B. Atkinson1, P. Massoli2,3,*, N. T. O’Neill4, P. K. Quinn5, S. D. Brooks6, and B. Lefer7 1Chemistry Department, Portland State University, Portland, OR, 97207-0751, USA
2University of Colorado, Cooperative Institute for Research in Environmental Sciences, Boulder, CO, 80309, USA 3NOAA Earth System Research Laboratory, Chemical Science Division, Boulder, CO, 80305, USA
4CARTEL, D´epartement de g´eomatique applique´e, Universit´e de Sherbrooke, Sherbrooke, Quebec, J1K 2R1, Canada 5NOAA Pacific Marine Environment Laboratory, 7600 Sand Point Way NE, Seattle, WA, 98115, USA
6Department of Atmospheric Sciences, Texas A & M University, College Station, TX, 77843, USA 7Earth and Atmospheric Sciences Department, University of Houston, Houston, TX, 77204-5007, USA *now at: Aerodyne Research, Inc. Billerica, MA, 01821, USA
Received: 9 July 2009 – Published in Atmos. Chem. Phys. Discuss.: 20 August 2009 Revised: 29 November 2009 – Accepted: 9 December 2009 – Published: 6 January 2010
Abstract.During the 2006 Texas Air Quality Study and Gulf of Mexico Atmospheric Composition and Climate Study (TexAQS-GoMACCS 2006), the optical, chemical and mi-crophysical properties of atmospheric aerosols were mea-sured on multiple mobile platforms and at ground based sta-tions. In situ measurements of the aerosol light extinction co-efficient (σep) were performed by two multi-wavelength cav-ity ring-down (CRD) instruments, one located on board the NOAA R/VRonald H. Brown(RHB) and the other located at the University of Houston, Moody Tower (UHMT). An AERONET sunphotometer was also located at the UHMT to measure the columnar aerosol optical depth (AOD). Theσep
data were used to extract the extinction ˚Angstr¨om exponent ( ˚aep), a measure of the wavelength dependence ofσep. There was general agreement between the ˚aep(and to a lesser de-greeσep) measurements by the two spatially separated CRD instruments during multi-day periods, suggesting a regional scale consistency of the sampled aerosols. Two spectral mod-els are applied to theσep and AOD data to extract the fine mode fraction of extinction (η) and the fine mode effective radius (Reff,f). These two parameters are robust measures of the fine mode contribution to total extinction and the fine mode size distribution, respectively. The results of the analy-sis are compared toReff,fvalues extracted using AERONET V2 retrievals and calculated from in situ particle size
mea-Correspondence to:D. B. Atkinson (atkinsond@pdx.edu)
surements on the RHB and at UHMT. During a time period when fine mode aerosols dominated the extinction over a large area extending from Houston/Galveston Bay and out into the Gulf of Mexico, the various methods for obtaining
Reff,fagree qualitatively (showing the same temporal trend) and quantitatively (pooled standard deviation = 28 nm). 1 Introduction
Cavity ring-down (CRD) spectroscopy (Moosmuller et al., 2005; Strawa et al., 2006; Atkinson, 2003; Baynard et al., 2007) offers robust and precise measurements of the in situ
σep coefficient. The wavelength dependence ofσep can be expressed by the ˚Angstr¨om exponent ˚aepwhich can then be used to infer information about particle size. Values of ˚aep
less than one are more likely to be produced by a predomi-nance of coarse mode particles, while values greater than one are more reflective of a predominantly fine mode contribution to aerosol extinction. The ˚aAOD, obtained from AERONET sunphotometers, has a similar definition and properties to the in situ ˚aepbut is averaged along the vertical path. Recently, satellite retrieval algorithms have been developed to quantify the contribution of the fine mode fraction to the column AOD (Anderson et al., 2005). Such information is critical for mod-els to calculate the climate forcing by anthropogenic aerosols (Chin et al., 2004; Kleidman et al., 2005; Bates et al., 2006; Yu et al., 2006). However, due to the generally high uncer-tainties of satellite retrievals, those methods are less effec-tive unless supported by in situ measurements. Several types of new low-cost portable instruments have been developed that measure extinction or AOD at multiple wavelengths for radiative effects measurements. These new measurements could be subjected to the data analyses used here and used to provide information about fine mode physical and opti-cal properties on a wider spatial sopti-cale than can currently be provided by costlier and more complicated particle sizing in-struments.
This work examines the extent to which the spectral in-formation from both in situ and remote instruments can be used to provide information about the fine aerosol mode in the vertical column. We process theσepdata collected by a three-wavelength cavity ring-down instrument (hereafter the NOAA CRD) using two spectral methods that were devel-oped for the analysis of AOD data to quantify the relative contribution of the fine aerosol mode to the total σep, re-ferred to as the fine mode fraction of extinction (η). These methods also extract the fine mode effective radiusReff,f, a
single-parameter characterization of the size distribution for the fine particles. The general definition ofReffis given by Hansen and Travis (1974);
Reff= R∞
0 rπ r2
dN dlnrdlnr
R∞ 0 π r2
dN dlnrdlnr
(1)
whereris the particle radius anddN/dlnris the particle size distribution function. Application of Eq. (1) assumes that the fine mode sub-distribution can either be isolated using the spectral information or that one physically divides the radius regime into two segments, for example using a size selective inlet (we investigate both cases in this paper). It has been suggested that variations inReff,fare indicative of oxidative aging or cloud processing of anthropogenic aerosols (usually fine mode particles) in the vertical column (Anderson et al., 2005).
Our methods are applied to optical data collected dur-ing the 2006 Texas Air Quality Study and Gulf of Mex-ico Atmospheric Composition and Climate Study (TexAQS-GoMACCS 2006), during which the NOAA CRD was de-ployed on board the NOAA R/VRonald H. Brown(RHB). A second CRD aerosol extinction instrument was operated by a group from Portland State University (hereafter PSU CRD) atop the Moody Tower builing on the University of Houston campus (UHMT). An AERONET sunphotometer was also located at the UHMT to measure the columnar aerosol opti-cal depth (AOD). TheReff,fvalues obtained from the spectral analyses of the CRD data are compared to those derived from sun/sky inversions using the AERONET V2 approach, and to those obtained from mobility size distribution instruments whose data were processed according to Eq. (1). Section 2 provides a detailed description of the experimental data and spectral models used in this study. In Sect. 3, comparisons of the extinction coefficient and ˚aepmeasurements from the two CRD instruments are used to investigate the spatial coher-ence of the aerosol airmass over the Houston/Galveston Bay area. The comparison ofReff,ffrom the various methods is presented for a time period when long-range transported fine mode aerosols dominated the aerosol loading over a large area extending from Houston out in the Gulf of Mexico, and column AOD values measured on board the RHB were high (Massoli et al., 2009). We show that the various methods for obtainingReff,fagree quantitatively, with a pooled stan-dard deviation of 28 nm. Comparison of the ˚aepandηvalues derived from the CRD instruments is also shown for a time period when coarse aerosols originating from a long range transport of Sarahan dust were present over East Texas.
This work demonstrates that multiple different methods for obtaining Reff,f show some skill in predicting aerosol physical properties. This implies that ground-based in situ optical measurements may represent a good first approxima-tion of the columnar properties of atmospheric aerosols for validating and constraining satellite retrievals when vertical distribution measurements are not available.
2 Experimental and theoretical methods
route to the Northeast, 20 km from the Houston ship chan-nel (HSC) to the East/North-East, and 4.5 km from the urban core to the Northwest. Instruments were located inside tem-perature controlled (24±2◦C) trailers, and each instrument had its own sample inlet mounted 5 m above the roof top (∼70 m above sea level) to minimize any ground or build-ing interference. Wind speed and direction were measured by various instruments on the building and on the ground. The PSU CRD sampled aerosols through a cyclone impactor (URG Inc., 2000-30EN), and 8 m of copper tubing was used to transport the sample from the inlet to the CRD instrument. The cyclone has a nominal cut-point of 2.5 µm aerodynamic diameter at a flow rate of 10 liters per minute (lpm); however the aerosols were drawn into the PSU CRD at 5 lpm, giving a higher cut-point of 4 µm, according to the URG product lit-erature. The PSU CRD measuredσepat 532 and 1064 nm, with a maximum time resolution of 0.25 Hz, and a 95% con-fidence level detection limit of 4 Mm−1 based on previous laboratory data (Radney et al., 2008). Theσep results pre-sented here are averaged to at least 30 min, resulting in a de-tection limit of less than 1 Mm−1(Wright et al., 2009).
A Sequential Mobility Particle Sizer (SMPS) (GRIMM Technologies Inc.) was operated at the UHMT site through-out the project. The SMPS consists of a Differential Mo-bility Analyzer (Model DMA-L) and an Ultrafine Particle Counter (Model 5.403). The SMPS scanned the aerosol par-ticle size distribution from 11.1 nm to 521 nm in 38 size bins approximately every 7 min for the majority of the study pe-riod. The size distribution data did not include corrections for variations in shape or density. In addition, a laser-based Aerosol Spectrometer (GRIMM Model 1.108 PAS) recorded a coarse mode particle distribution (15 size bins from 0.3 µm to∼22 µm) every 60 s. A thorough investigation of this in-strument’s inlet transmission as a function of particle size allowed for the correction of the raw data for particle losses, which were≤10% for sizes up to 4 µm.
An AERONET CIMEL sun/sky radiometer was also lo-cated at the UHMT site and was continuously operated dur-ing the study period. Level 2.0 AERONET data (cloud screened and quality assured) are used in the analysis pre-sented here. In addition to multi-wavelength AOD and pair-wise ˚aAOD values, the AERONET V2 data products also include estimates of the particle size distribution and refractive index (Dubovik et al., 2002). This size distri-bution information is obtained through an inversion algo-rithm that operates on the full sky scan data (almucan-tars) combined with near-simultaneously acquired AOD data (Dubovik and King, 2000). The inversion fits the an-gular and spectrally resolved sky radiance and AOD data to radiative transfer computations derived for a variable (binned) size distribution and variable (pan-radius) refrac-tive index (Dubovik and King, 2000). Non-spherical par-ticle effects are accounted for by introducing a variable fraction of fixed-geometry spheroids (Dubovik et al., 2006; Sinyuk et al., 2007), (see http://aeronet.gsfc.nasa.gov/new/
web/Documents/Inversion/products/V2.pdf). Data products of this method also include the Reff of the fine and coarse modes andηfor the AOD.
Aerosols on the RHB were sampled through an inlet (mast) located 18 m above sea level and forward of the ship’s stack. The mast was automatically rotated into the relative wind to maintain nominally isokinetic flow and minimize the loss of super-micrometer particles. Air entered the inlet through a 5 cm diameter hole, passed through a 7◦ expan-sion cone, and then into the 20 cm inner diameter sampling mast. The flow through the mast was 1 m3min−1. The trans-mission efficiency of the inlet for particles with aerodynamic diameters less than 6.5 µm (the largest size tested) is greater than 95% (Bates et al., 2002). The bottom 1.5 m of the mast was heated to establish a stable reference RH for the sam-ple air of 60 (±5)%. On average, the aerosol was heated 2.5◦C above ambient temperature. Stainless steel tubes ex-tending into the heated portion of the mast were connected with conductive silicone tubing to downstream instrumenta-tion for aerosol optical property measurements and particle sizing. The NOAA CRD sampled at a rate of 30 lpm off the mast and the light extinction coefficient σepwas measured at 355, 532, and 1064 nm in six independent cavities. The NOAA CRD (Massoli et al., 2009) measured theσep coef-ficient for both the sub 1 and sub 10 µm sizes (aerodynamic diameter at 60% RH at mast outlet) and at different RH con-ditions (at 25%, 60% and 85% RH for the 532 nm, and at 25% and 85% for the 355 and 1064 nm). The relative uncer-tainty forσepat any wavelength at 25% RH is approximately 1% for data averaged to 1 min, whereas theσepcoefficients measured at 85% RH are characterized by higher relative un-certainty of about 5%. The ˚aep values calculated from the 532 and 1064 nmσepcoefficients are characterized by an ab-solute uncertainty of 0.015 if estimated from the 25% RHσep
coefficients, and 0.07 when obtained for 85% RH conditions (Massoli et al., 2009).
On the RHB, size distributions from 20 to 200 nm and 200 to 800 nm in geometric diameter were measured with two parallel differential mobility particle sizers DMPS, Uni-versity of Vienna (Winklmayr et al., 1991) with short and medium length columns for Aitken and accumulation modes, respectively, coupled to condensation particle counters (CPC model 3760A, TSI, Inc., St. Paul, MN). Size distributions from 0.9 to 10 µm in aerodynamic diameter were measured with an aerodynamic particle sizer (APS model 3321, TSI). APS size distributions were converted from aerodynamic to geometric diameters using densities based on the measured chemical composition. More details regarding RHB sizing instruments and data can be found in (Bates et al., 2008; Quinn et al., 2008).
discussed in this paper obtain the size information: the in situ instruments base such distinction on the aerodynamic parti-cle diameter, usually determined through impaction (Berner et al., 1979). In these cases, the fine mode fraction corre-sponds to a sub 1 µm fraction resulting from an 50% aerody-namic cut-off diameter within the impactor of 1 µm (Doherty et al., 2005; Yu et al., 2006) whereas all of the spectral meth-ods base such distinction on the different optical behavior of small and large particles.
2.2 Data analysis and spectral methods
The ˚aep(λ1,λ2) can be calculated usingσepvalues at two dif-ferent wavelengths (λ1andλ2) according to the logarithmic treatment of the assumed power-law expression ( ˚Angstr¨om, 1929)
˚
aep(λ1,λ2)= −ln(σep,λ1/σep,λ2)/ln(λ1/λ2). (2) The PSU CRD σep coefficients measured at 532 and 1064 nm were used to obtain an estimate of ˚aep for the UHMT site (hereafter ˚aep,UHMT). Similarly, three differ-ent ˚aep values can be obtained pair-wise from the NOAA CRD wavelengths 355, 532 nm, 355, 1064 nm, and 532, 1064 nm (hereafter ˚aep,RHB). Direct comparison between the ˚
aep,UHMTand ˚aep,RHB (532, 1064 nm) for specific time peri-ods during TexAQS-GoMACCS is presented in Sect. 3.
Next we describe the spectral methods applied to the NOAA CRD and AERONET data to extract the fine mode fraction of extinction η and the fine mode effective ra-diusReff,f: the Spectral Deconvolution Algorithm with Fine Mode Curvature (SDA/FMC) and the Graphical Spectral Method (GSM). The PSU CRD data were not processed in this way because application of the spectral methods requires data at 3 or more wavelengths.
The SDA/FMC approach (O’Neill et al., 2003; O’Neill et al., 2005) uses the AOD directly measured by the sunpho-tometer to extract η and the Van de Hulst phase shift pa-rameterρeff,f(if a particle refractive index is assumed then
ρeff,fcan be converted to an estimate ofReff,f, cf. Eq. (8) be-low). This spectral model takes advantage of the higher data density of the direct solar attenuation AOD measurements compared to the full sky scans used by AERONET to extract size distributions, especially with a new high frequency in-strument mode which permits the acquisition of AOD data at 3 min intervals.
The SDA/FMC procedure starts with a second order fit of ln(σep) vs. ln(λ)
ln(σep(λ))=a0+a1ln(λ)+a2ln(λ)2. (3) The three fitting coefficients a0, a1 anda2 can be used to calculate theλ=1 µm extinction coefficient (σep=a0) as well as the extinction ˚Angstr¨om exponentαepat any selected wavelength, and its wavelength dependence, the “spectral curvature”α′ep
αep(λ)= −dln(σep)/dln(λ)= −a1−2a2ln(λ) (4)
αep′ =dαep(λ)/dln(λ)= −d2ln(σep)/dln(λ)2= −2a2. (5) Note that although we will refer to both ˚aandαas ˚Angstr¨om exponents, they are subtly different in definition and usage:
˚
a is an average value for a wavelength range with a pro-scribed lack of spectral curvature, whereas αis specific to one wavelength (in the sense of a pure derivative); its for-mulation accounts for higher order spectral curvature, and exploits it to extract further information about the fine and coarse modes. The spectral curvature α′ep value of a fine-mode dominated distribution increases as Reff,f increases from 10 nm to 500 nm, and then decreases for fine-mode par-ticles with radius>500 nm (O’Neill et al., 2005; Schuster et al., 2006). For coarse-mode dominated aerosols α′ep is
≤0, an inequality that also applies to very small, absorbing, fine-mode particles (O’Neill et al., 2005). Theαepandα′ep calculated from both the NOAA CRDσep and the UHMT AERONET sunphotometer AOD data are used to extractη
and the fine mode ˚Angstr¨om parameters at a reference wave-length ofλ=500 nm. This information is then used in the FMC procedure to extract the fine modeρeff,f. The FMC in-version is based on the observation that the value ofρeff,fis a function of the fine mode ˚Angstr¨om exponentαep,fand its spectral derivativeα′ep,f
ρeff,f=0.31593+1.25050ψ+0.52859ψ2 (6) whereψ is in radians (Eq. (5) in O’Neill et al. (2005) was incorrectly written and has since been slightly modified to correct for higher-order-polynomial artifacts at the extremes of the ψ range (O’Neill et al., 2008)). From O’Neill et al. (2005) we have:
tanψ=α
′ f−0.2
αf−0.5
. (7)
The parametersαfandα′
f(outputs of the coarse/fine mode separation in the SDA procedure) are typically characterized by relatively large errors which propagate into the calcula-tion ofρeff,f. We have found that these errors are difficult to quantify empirically. They are a significant fraction of the amplitude ofρeff,fbut tend to decrease asη→1. Once the
ρeff,fhas been estimated, theReff,fcan be calculated accord-ing to
Fig. 1.RHB ship track in(a)the Gulf of Mexico and(b)Galveston bay, during the period 2 August–11 September 2006. The UHMT site is in downtown Houston, about 5 miles east of the Houston Ship Channel (HSC).
the RHB showed that the ambient RH was between 80 and 85% during most of the study period.
The GSM approach (Gobbi et al., 2007) uses a graphi-cal parameterization of the AERONET products to obtain
Reff,f. The method relies on AOD data from three CIMEL data channels only (unlike the SDA, which uses as many wavelengths as are available) and the data is first screened to remove values below AOD = 0.1. The discrete difference of specified pair-wise ˚aAODvalues computed from AERONET sunphotometer data is used to obtainδa˚AOD
δa˚AOD=a˚AOD(440,675)−a˚AOD(675,875) (9) which is also referred to as “spectral curvature”. Due to a different choice of definitions, the analogous parameter in the SDA/FMC approach (α’ep) has the opposite sign, so in the GSM method more negativeδa˚values will be associated with largerReff,f. values. The derivedδa˚AOD data are then plotted vs. the ˚aAODdata on a non-rectilinear grid that was constructed by modeling an extensive set of conditions (see Fig. 1 in Gobbi et al., 2007). Gobbi et al. (2007) demon-strate that the impact of using different atmospherically rel-evant refractive indices (i.e., different particle compositions) on the retrieval is small. O’Neill (2009) has argued that the Gobbi approach is essentially equivalent to the SDA/FMC since both rely on fundamental spectral curvature mecha-nisms to extract an analogous set of fine-mode parameters.
The GSM model was also applied to the NOAA CRD data by constructing the parameters ˚aep(355,1064) andδa˚ep=a˚ep (355,532) – ˚aep(532,1064) from the four channels (25% and 85% RH, sub 1 and sub 10 µm). Only the 25% RH sub 1 µm data yielded reasonable results and are presented below. As for the SDA/FMC method, we obtain twoReff,fvalues from the GSM approach, one using the AERONET data (hereafter
AERONET GSM) and one from the NOAA CRD data (here-after CRD GSM).
2.3 Meteorological conditions during the case study period
The prevailing meteorological conditions characterizing the Houston/Galveston bay area were represented by Southerly winds (ESE to WSW) until 30 August 2006, followed by Northerly flow (N to NNE) until 6 September 2006, and winds between N-NE and ESE to WSW until mid Septem-ber. Detailed information about these meteorological pat-terns and the properties of the corresponding air masses are reported in Wright et al. (2009) for the UHMT site and in Bates et al. (2008) and Massoli et al. (2009) for the RHB. Figure 1 illustrates the overall RHB track in the area during the field study (panel 1a), with an enlarged view of the ship tracks in Houston/Galveston Bay and the Houston ship chan-nel (pachan-nel 1b).
s
! " #$% & ' ' m ' ' m ' ' m ' ' m
()&& *+ ()&& *+ ()&& *+ ()&& *+
' '
'
+'
,'
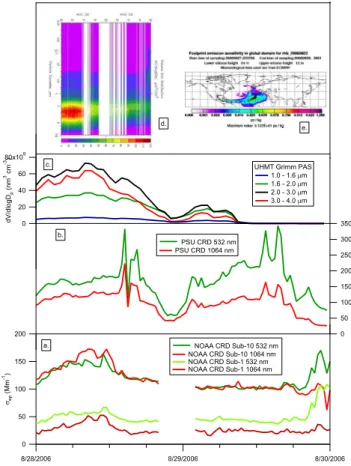
Fig. 2. Time series for the period 28 August–30 August 2006 of: panel(a)NOAA CRD sub 1 and sub 10 µm, 85% RH, 532 and 1064 nmσep; panel(b)PSU CRD 532 and 1064 nmσep; panel(c) 1 to 4 µm, size bins of the PAS at the UHMT site; panel(d)volume concentration size distribution from the DMPS/APS on the RHB; and(e)FLEXPART trajectory analysis showing transport patterns from the Saharan region to the Gulf of Mexico on 27 August.
masses. In particular, the Community Multiscale Air Qual-ity (CMAQ) model, initiated with the National Center for Environmental Prediction (NCEP) weather forecast and the National Emission Inventory (NEI ’99) predicts large scale homogeneity in the aerosol for several extended periods in early September, including the period taken into account here (Byun and Lee, personal communication, 2009).
3 Results and discussion
3.1 Data overview and investigation of spatial homogeneity
Figures 2 and 3 give an overview of the data that were used in the analyses conducted here. Figure 2 refers to the pe-riod 28 August (00:00 UTC)–30 August (00:00 UTC) 2006, during the second major Saharan dust event observed over the Houston/Gulf of Mexico region. (All times referred to in the text and figures of this paper are UTC.) We show
s
Fig. 3. Time series for the period 2–9 September 2006 of: panel (a)NOAA CRD 532 and 1064 nm sub 1 micron 85% RHσepand PSU CRD 532 and 1064 nmσep; and(b)volume concentration size distribution from the DMPS/APS on the RHB.
the 30 min average time series of 532 and 1064 nm NOAA CRDσepcoefficients for the sub 1 and sub 10 µm aerosols at 85% RH (panel a); 532 and 1064 nm PSU CRDσepdata for sub 4 µm aerosols at the nominal 50% RH (panel b); the coarse (>1 µm) aerosol size distributions as measured by the GRIMM PAS at the UHMT site (panel c); the full volume size distribution from the DMPS/APS on the RHB (panel d); and the FLEXPART footprint emission sensitivity (panel e). After 27 August (18:00 UTC) a significant relative enhance-ment in the 1064 nm sub-10 µmσepcoefficient was observed by the NOAA CRD, suggesting a substantial increase in the coarse aerosol load. During the same time, the PSU CRD recorded higherσeplevels at both 532 and 1064 nm, although in this case theσep,1064< σep,532, perhaps due to the different size cuts of the CRD instruments (10 µm for the NOAA CRD and 4 µm for the PSU CRD). The mobility size distribution data from both the UHMT and RHB showed that the>1 µm volume concentration peaked on 28 August with a maximum at approximately 3 µm, consistent with the presence of coarse dust particles in the area.
åep
åep
åep
!"#
!$% m & '
!$% m & '
% "()"$"* % !+!#)
Fig. 4. Top: extinction ˚Angstr¨om exponents ˚aepobtained accord-ing to Eq. (2) usaccord-ing the 532 and 1064 nmσepcoefficients from the PSU CRD (black trace) and from the NOAA CRD at 85% RH for both sub 1 µm (red trace) and sub 10 µm (blue trace), for the two periods discussed in the text. Bottom: scatter plot of the PSU CRD ˚
aep,UHMTvs. the NOAA CRD ˚aep,RHBfor period 1 and 2.
the NOAA CRD sub 1 µm 85% RH channel and the PSU CRD. Overall highσeplevels were observed, with the 532 nm
σep>100 Mm−1 and the 1064 nm σep coefficients around 50 Mm−1. The volume size distributions collected on board the RHB (top panel) show that the particles were mostly in the accumulation mode, peaking between 300 and 400 nm particle mobility diameter. Organic matter and sulfate were present in equal amounts for the latter half of the period, while during 2–5 September sulfate aerosols were the domi-nant type and a regional haze event occurred in the Gulf re-gion (Massoli et al., 2009). The quantitative agreement be-tween theσepcoefficients measured by the NOAA and PSU CRD instruments, with both large and small scale structures captured by the two CRDs, is noteworthy given that the phys-ical distance between the two platforms reached 50 miles at times during this period. This confirms that the air masses probed at the two platforms (RHB and UHMT) were similar on a regional scale, as predicted by the NCEP/CMAQ models (Byun and Lee, personal communication, 2009).
Figure 4 shows the ˚aep,UHMTand ˚aep,RHBcalculated from the PSU and the 85% RH sub 1 and sub 10 µm NOAA CRD σep data for 28–30 August (period 1, coarse mode dominated) and 2–9 September (period 2, fine mode domi-nated). The indicated areas during period 2 represent times when the data are known to be affected by local pollution plume sources sampled by RHB in the Galveston area. The ˚
aep,RHBand ˚aep,UHMT values show overall good agreement, both qualitatively and quantitatively. A scatter plot of the
a
a
m !" m !" m !" m !"
Fig. 5. The extinction ˚Angstr¨om exponent αep (top panel), and spectral curvatureαep′ (bottom panel) for the sub 1 and sub 10 µm NOAA CRDσep coefficients at 25% and 85% RH, extracted at 500 nm via the AERONET SDA/FMC routine.
PSU CRD vs. the NOAA CRD data (sub 1 µm in period 1 and sub 10 µm in period 2) is shown in the lower panel of Fig. 4. The linear regression of the ˚aep,UHMTvs. the ˚aep,RHB data leads to a overall slope of 0.96, with anR2value of 0.75. Again, this implies that there was large scale aerosol airmass consistency during this part of the study.
3.2 Angstr¨om exponent and spectral curvature analysis˚ of the NOAA CRD data
Figure 5 shows theαep(top panel) atλ=500 nm andα′ ep (bot-tom panel) extracted from the NOAA CRD data with the SDA/FMC procedure as described in Sect. 2.2. Theαepand
αep′ are presented for all the NOAA CRD data, i.e., sub 1 and sub 10 µm, and 25% and 85% RH, for both periods 1 and 2.
Some interesting features emerge from the analysis. For period 1 (coarse mode dominated), the average value ofαep for the sub 1 µm data is 1.5, whereas theαep value for sub 10 µm is around 0.8. No significant difference is observed betweenαep extracted at different RH; theαepreported for the <1 µm sizes at 25% RH is approximately the same as that for the sub 1 µm data at 85% RH. The minimal difference betweenαepvalues obtained at 25% and 85% RH during the dust event indicates minimal water uptake even by the sub 1 µm aerosols, as the aerosol sample was dominated by min-eral dust in both size ranges. The analysis of impactor data collected on the RHB between 28 and 30 August shows that sub 1 µm dust contributed up to 50% of the<1 µm aerosol mass (the rest being non sea-salt sulfate), whereas it was more than 80% of the total sub 10 µm aerosol mass.
!
h
!"# m !"# m s
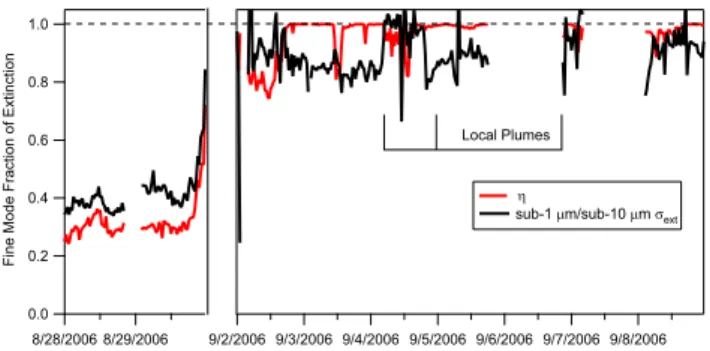
Fig. 6.Fine mode fraction of extinctionηat 500 nm calculated from the NOAA CRD 85% RHσep coefficients using the SDA/FMC method (red trace) and the ratio of the sub 1 µm to the sub 10 µm 85% RH 532 nmσepdata (black trace).
a first approximation:αep∼1.2 for 85% RH data (both sub 1 and sub 10 µm) andαep∼2.0 for 25% RH data (again both sub 1 and sub 10 µm). These results indicate the dominance of sub 1 µm aerosols during period 2, with larger sizes (cor-responding to the lowerαepvalues at 85% RH) mainly due to particle hygroscopic growth (Massoli et al., 2009).
The curvature data αep′ (bottom panel of Fig. 5) reflect the trends discussed above forαep. During the coarse-mode dominated period, near-zeroα′epis observed for the sub 1 µm data (25% and 85% RH), and negative values are obtained for sub 10 µm data (25% and 85% RH). For the fine-mode dominated Period 2, positiveαep′ values of∼1.8 and 2.5 (av-erage values) are obtained for the 85% RH data (sub 1 and sub 10 µm) and for the 25% RH data (sub 1 and sub 10 µm) respectively.
3.3 Fine mode fraction (η) andReff,fretrievals and
com-parisons
Here we describe the results of the spectral analysis con-ducted on the NOAA CRD data to obtain the fine modeηand
Reff,fparameters. As stated earlier, for these analyses we use the sub 10 µm 85% RH CRD data because it is closest to the ambient RH values. To further facilitate comparison between the AERONET and CRD retrievals, all of the parameters are reported at 500 nm. Figure 6 shows the fine mode fraction
ηextracted from the NOAA CRD data using the SDA/FMC procedure (red trace) for the two time periods shown earlier. In addition the ratio of the NOAA CRD 85% RH sub 1 µm to the sub 10 µmσepcoefficients (hereafter “SMF”, or “sub-micron fraction”) is shown in Fig. 6 (black trace). The SDA retrieval of the fine mode contribution to the total extinction gives general agreement with the SMF (η∼0.95 and SMF
∼0.9) during period 2 and similar agreement (η∼0.3 and SMF∼0.4) during the coarse mode event. In general one would expectηto be slightly less than SMF due to the man-ner in which these parameters are calculated (cf., Kleidman et al., 2005 for example). Small spectral artifacts in the ex-tinction data can lead to significant errors inηbecause there
! " ! ! #$
$ $ #$
Fig. 7.Comparison of 24-hour averageReff,fvalues obtained from the NOAA CRDσepdata and from the AERONET sunphotometer using the spectral methods (SSRI is the full sun-sky radiance inver-sion used by AERONET V2, and the GSM and SDA/FMC methods are extensively discussed in the text), and theReff,fvalues estimated from the size distribution instruments (Grimm SMPS and PMEL DMPS).
are only three wavelengths used to determine the curvature (unlike the AERONET data which is overdetermined). In the case of the data shown in Fig. 6 during period 2, there are times whereηis unity and SMF does not attain this value. Because the DMPS/APS data in Fig. 3 confirms the domi-nance of fine mode particles during these periods, we sug-gest that this diescrepancy could be an artifact of the CRD’s impactor-based separation that makes it difficult for SMF to assume unity or near-unity values.
In general, estimates ofReff,f(ρeff,f) become less accurate asηdecreases. Because we want to minimize the influence of retrieval results other than those related to the variation of
Reff,f, we will only use the fine mode dominated period to extract theReff,fparameter from the CRD data below. Fig-ure 7 depicts values of the fine mode effective mean radius
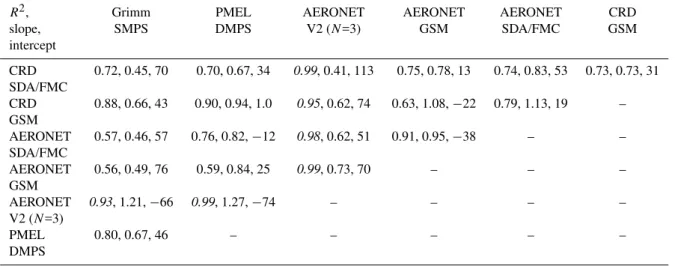
Table 1.The correlation coefficient (R2)and the slope and intercept of the various measures ofReff,ffrom an orthogonal distance regression (ODR) between the pairs (row vs. column). For an ODR, the slope of the reversed regression is necessarily the inverse (hence only half of the matrix is given). Note that there are only three AERONET points for these comparisons, so the (italicized) correlation coefficients are artificially close to one. The intercept has units of nm.
R2, Grimm PMEL AERONET AERONET AERONET CRD
slope, SMPS DMPS V2 (N=3) GSM SDA/FMC GSM
intercept
CRD 0.72, 0.45, 70 0.70, 0.67, 34 0.99, 0.41, 113 0.75, 0.78, 13 0.74, 0.83, 53 0.73, 0.73, 31 SDA/FMC
CRD 0.88, 0.66, 43 0.90, 0.94, 1.0 0.95, 0.62, 74 0.63, 1.08,−22 0.79, 1.13, 19 – GSM
AERONET 0.57, 0.46, 57 0.76, 0.82,−12 0.98, 0.62, 51 0.91, 0.95,−38 – – SDA/FMC
AERONET 0.56, 0.49, 76 0.59, 0.84, 25 0.99, 0.73, 70 – – –
GSM
AERONET 0.93, 1.21,−66 0.99, 1.27,−74 – – – –
V2 (N=3)
PMEL 0.80, 0.67, 46 – – – – –
DMPS
the in situ size distribution measurements at the UHMT site (hereafter Grimm SMPS) and on the RHB (hereafter PMEL DMPS). The sub-1 µm particle size distribution data were av-eraged to 24-h periods and the data were summed bin-wise for (dN xπ rbin3 ) and (dN xπ rbin2 ) and then ratioed to produce the Grimm SMPS and PMEL DMPSReff,festimates.
The Reff,f estimates obtained from the various methods span a range of approximately 100 nm, centered near 200 nm, with a pooled standard deviation of 28 nm (taking each day as a set). All of the in situ methods captured the rapid in-crease inReff,fduring the first days of September 2006 and then the stable higher radius during the middle of the period. The agreement between the in situ size distribution derived
Reff,fvalues GRIMM SMPS and PMEL DMPS is better dur-ing 2–5 September, when the size distributions peaked at a small radius. This provides additional evidence that a synop-tic scale airmass was being observed at both platforms. The low bias of the Grimm SMPS measurements may be from an intentional choice to limit the size range to a particle diame-ter of 521 nm because of concern that the few larger size bins may have been contaminated by small particle count data. As the particle mean radius may have approached 250 nm dur-ing the latter part of this period, this choice almost certainly excluded some particle sizes that were relevant to the evalua-tion ofReff,f. TheReff,fvalues from the sunphotometer based size distribution produced by AERONET seem to also agree rather well with GRIMM SMPS and PMEL DMPS values, suggesting a certain level of homogeneity in the size distri-bution throughout the column or dominance of the surface extinction. Unfortunately the AERONET full sky scan data was missing after 3 September because of cloud contamina-tion, limiting these comparisons.
The agreement between the Reff,f values obtained from AERONET AOD and NOAA CRDσepdata via the spectral methods is also compelling; however, the SDA/FMC-based
Reff,f values are systematically higher than the GSM-based ones. In order to provide more quantitative comparisons we performed pair-wise orthogonal distance regressions (an un-biased regression that allows for errors in both datasets be-ing compared, as implemented in the IgorPro software usbe-ing the /ODR switch with the CurveFit command) between the
4 Conclusions
The purpose of this study was to assess the possibility of us-ing multi-wavelength in situ aerosolσepmeasurements to tract information pertaining to the fine mode fraction of ex-tinctionηand the fine mode effective radiusReff,fin a fash-ion similar to that used with columnar AOD measurements (such as those from the AERONET sunphotometers or satel-lite borne sensors). This information is potentially useful for partitioning the contributions of anthropogenic (mostly present in the fine mode) and natural (larger coarse mode contribution) aerosols to the measuredσepcoefficients.
There was agreement between the fine mode fraction and
Reff,fresults obtained from the different methods. The agree-ment of the SDA-derivedηwith the SMF (Fig. 6) suggests that the method is robust, especially since it was run for a sub optimal number of wavelengths (three is the mini-mum usable). This is useful for helping to validate the SDA AERONET product and also suggests that the wavelength dependence of extinction from the CRD can provide a rea-sonable estimate for the partitioning between the fine and coarse modes.
TheReff,f retrieval from the wavelength dependent opti-cal measurements also appears to be promising. While the GSM method is simple and provides qualitative information, it is difficult to apply in a quantitative way mainly because graphically interpreting a large amount of time-resolved data to obtain values forηandReff,fis impractical. The produc-tion ofηandρeff,f by the SDA/FMC algorithm is efficient and is probably a more reasonable approach since it prop-erly leaves theReff,fand refractive index information inter-twined. Although there currently are no universally accepted measurements of particle refractive index applied to ambient aerosols in field studies, there are a number of potentially useful surrogates, including using literature recommended values as used here, or the refractive index product from the AERONET V2. The ability to extractReff,fwould signifi-cantly expand the utility of the in situ CRD instrument’s op-tical measurements ofσepat multiple wavelengths, which are currently being deployed on land, ship, and aircraft, but typ-ically only during field-intensive periods. A new generation of low-cost, portable instruments that measureσepwith accu-racy and precision similar to state of the art methods such as CRD are being developed and deployed (cf., Massoli et al., Aerosol light extinction measurements by Cavity Attenuated Phase Shift Spectroscopy (CAPS): laboratory validation and field deployment of a compact aerosol extinction monitor, submitted, AST) to achieve a wider coverage of aerosol opti-cal property measurements. If similar data analyses could be performed on a wider spatial scale, they could provide useful information about fine mode physical and optical properties for use in radiative forcing calculations and indirect effect estimates that are currently needed for global climate change models.
Acknowledgements. The TRAMP participants, DBA, SDB, and BL would like to express their gratitude to the Houston Advanced Research Center (HARC) for supporting and funding Project H78 and the Texas Commission on Environmental Quality (TCEQ) for supporting and funding this research under grant 582-5-64594. DBA acknowledges support from the Atmospheric Composition and Climate program at the National Atmospheric and Oceanic Administration through award number NA05OAR4310108. The authors also thank the officers and crew of the NOAA RV Ronald H. Brown, the NOAA Climate and Global Change Program, the NOAA Office of Oceanic and Atmospheric Research, the NOAA Health of the Atmosphere Program, and the Texas Air Quality Study.
Edited by: M. Petters
References
IPCC, 2007: Climate Change 2007: The Physical Science Basis. Contribution of Working Group I to the Fourth Assessment Re-port of the Intergovernmental Panel on Climate Change Cam-bridge, UK and New York, NY, USA.
Anderson, T. L., Charlson, R. J., Bellouin, N., Boucher, O., Chin, M., Christopher, S. A., Haywood, J., Kaufman, Y. J., Kinne, S., Ogren, J. A., Remer, L. A., Takemura, T., Tanre, D., Torres, O., Trepte, C. R., Wielicki, B. A., Winker, D. M., and Yu, H. B.: An “A-Train” strategy for quantifying direct climate forcing by anthropogenic aerosols, B. Am. Meteorol. Soc., 86, 1795–1810, 2005.
Andreae, M. O., Rosenfeld, D., Artaxo, P., Costa, A. A., Frank, G. P., Longo, K. M., and Silva-Dias, M. A. F.: Smoking rain clouds over the Amazon, Science, 303, 1337–1342, 2004.
˚
Angstr¨om, A.: On the atmospheric transmission of sun radiation and on dust in the air, Geografika Ann., 11, 156–166, 1929. Atkinson, D. B.: Solving chemical problems of environmental
im-portance using cavity ring-down spectroscopy, The Analyst, 128, 117–125, 2003.
Bates, T. S., Coffman, D. J., Covert, D. S., and Quinn, P. K.: Re-gional marine boundary layer aerosol size distributions in the In-dian, Atlantic, and Pacific Oceans: A comparison of INDOEX measurements with ACE-1, ACE-2, and Aerosols99, J. Geophys. Res.-Atmos., 107, 8026, doi:10.1029/2001JD001174, 2002. Bates, T. S., Anderson, T. L., Baynard, T., Bond, T., Boucher, O.,
Carmichael, G., Clarke, A., Erlick, C., Guo, H., Horowitz, L., Howell, S., Kulkarni, S., Maring, H., McComiskey, A., Mid-dlebrook, A., Noone, K., O’Dowd, C. D., Ogren, J., Penner, J., Quinn, P. K., Ravishankara, A. R., Savoie, D. L., Schwartz, S. E., Shinozuka, Y., Tang, Y., Weber, R. J., and Wu, Y.: Aerosol direct radiative effects over the northwest Atlantic, northwest Pacific, and North Indian Oceans: estimates based on in-situ chemical and optical measurements and chemical transport modeling, At-mos. Chem. Phys., 6, 1657–1732, 2006,
http://www.atmos-chem-phys.net/6/1657/2006/.
Berner, A., Lurzer, C., Pohl, F., Preining, O., and Wagner, P.: Size Distribution of the Urban Aerosol in Vienna, Sci. Total Environ., 13, 245–261, 1979.
Chin, M., Chu, A., Levy, R., Remer, L., Kaufman, Y., Holben, B., Eck, T., Ginoux, P., and Gao, Q. X.: Aerosol distribu-tion in the Northern Hemisphere during ACE-Asia: Results from global model, satellite observations, and Sun photome-ter measurements, J. Geophys. Res.-Atmos., 109(15), D23S90, doi:10.1029/2004jd004829, 2004.
Doherty, S. J., Quinn, P. K., Jefferson, A., Carrico, C. M., Ander-son, T. L., and Hegg, D.: A comparison and summary of aerosol optical properties as observed in situ from aircraft, ship, and land during ACE-Asia, J. Geophys. Res.-Atmos., 110, D04201, doi:10.1029/2004jd004964, 2005.
Dubovik, O. and King, M. D.: A flexible inversion algorithm for retrieval of aerosol optical properties from Sun and sky radiance measurements, J. Geophys. Res., 105, 20673–20696, 2000. Dubovik, O., Holben, B. N., Lapyonok, T., Sinyuk, A.,
Mishchenko, M. I., Yang, P., and Slutsker, I.: Non-spherical aerosol retrieval method employing light scattering by spheroids, Geophys. Res. Lett., 29(4), 1415 doi:10.1029/2001gl014506, 2002.
Dubovik, O., Sinyuk, A., Lapyonok, T., Holben, B. N., Mishchenko, M., Yang, P., Eck, T. F., Volten, H., Munoz, O., Veihelmann, B., van der Zande, W. J., Leon, J. F., Sorokin, M., and Slutsker, I.: Application of spheroid mod-els to account for aerosol particle nonsphericity in remote sens-ing of desert dust, J. Geophys. Res.-Atmos., 111(34), D11208, doi:10.1029/2005jd006619, 2006.
Gobbi, G. P., Kaufman, Y. J., Koren, I., and Eck, T. F.: Classification of aerosol properties derived from AERONET direct sun data, Atmos. Chem. Phys., 7, 453–458, 2007,
http://www.atmos-chem-phys.net/7/453/2007/.
Hansen, J. E. and Travis, L. D.: Light Scattering in Planetary At-mospheres, Space Sci. Rev., 16, 527–610, 1974.
Holben, B. N., Eck, T. F., Slutsker, I., Tanr´e, D., Buis, J. P., Set-zer, A., Vermote, E., Reagan, J. A., Kaufman, Y. J., Nakajima, T., Lavenu, F., Jankowiak, I., and Smirnov, A.: AERONET – A federated instrument network and data archive for aerosol char-acterization, Rem. Sens. Env., 66, 1–16, 1998.
Kleidman, R. G., O’Neill, N. T., Remer, L. A., Kaufman, Y. J., Eck, T. F., Tanre, D., Dubovik, O., and Holben, B. N.: Comparison of moderate resolution Imaging spectroradiometer (MODIS) and aerosol robotic network (AERONET) remote-sensing retrievals of aerosol fine mode fraction over ocean, J. Geophys. Res.-Atmos., 110(6), D22205, doi:10.1029/2005jd005760, 2005. Lefer, B. and Rappengl¨uck, B.: Overview of TRAMP Texas II
Study, Atmos. Environ., in preparation, 2010.
Lohmann, U. and Feichter, J.: Global indirect aerosol effects: a review, Atmos. Chem. Phys., 5, 715–737, 2005,
http://www.atmos-chem-phys.net/5/715/2005/.
Massoli, P., Bates, T. S., Quinn, P. K., Lack, D. A., Baynard, T., Lerner, B. M., Tucker, S. C., Brioude, J., Stohl, A., and Williams, E. J.: Aerosol optical and hygroscopic properties dur-ing TexAQS-GoMACCS 2006 and their impact on aerosol direct radiative forcing, J. Geophys. Res.-Atmos., 114(17), D00F07, doi:10.1029/2008jd011604, 2009.
Moosmuller, H., Varma, R., and Arnott, W. P.: Cavity ring-down and cavity-enhanced detection techniques for the mea-surement of aerosol extinction, Aerosol Sci. Tech., 39, 30–39, doi:10.1080/027868290903880, 2005.
O’Neill, N. T., Eck, T. F., Smirnov, A., Holben, B. N., and Thulasiraman, S.: Spectral discrimination of coarse and fine mode optical depth, J. Geophys Res.-Atmos., 108(15), 4559, doi:10.1029/2002jd002975, 2003.
O’Neill, N. T., Thulasiraman, S., Eck, T. F., and Reid, J. S.: Ro-bust optical features of fine mode size distributions: Application to the Quebec smoke event of 2002, J. Geophys Res.-Atmos., 110(21), D11207, doi:10.1029/2004jd005157, 2005.
O’Neill, N. T., Thulasiraman, S., Eck, T. F., and Reid, J. S.: Correc-tion to “Robust optical features of fine mode size distribuCorrec-tions: Application to the Qu´ebec smoke event of 2002”, J. Geophys. Res., 113, D24203, doi:10.1029/2008JD011334, 2008.
O’Neill, N. T.: Comment on “Classification of aerosol properties derived from AERONET direct sun data” edited by: Gobbi, G. P., et al. (2007), Atmos. Chem. Phys. Discuss., 9, 175–182, 2009, http://www.atmos-chem-phys-discuss.net/9/175/2009/.
Radney, J. G., Bazargan, M. H., Wright, M. E., and Atkin-son, D. B.: Laboratory Validation of Aerosol Extinction Co-efficient Measurements by a Field-Deployable Pulsed Cavity Ring-Down Transmissometer, Aerosol Sci. Technol., 43, 71–80, doi:10.1080/02786820802482536, 2009.
Schuster, G. L., Dubovik, O., and Holben, B. N.: Angstrom ex-ponent and bimodal aerosol size distributions, J. Geophys Res.-Atmos., 111(14), D07207, doi:10.1029/2005jd006328, 2006. Sinyuk, A., Dubovik, O., Holben, B., Eck, T. F., Breon, F.
M., Martonchik, J., Kahn, R., Diner, D. J., Vermote, E. F., Roger, J. C., Lapyonok, T., and Slutsker, I.: Simultaneous re-trieval of aerosol and surface properties from a combination of AERONET and satellite data, Remote Sens. Environ., 107, 90– 108, doi:10.1016/j.rse.2006.07.022, 2007.
Strawa, A. W., Elleman, R., Hallar, A. G., Covert, D., Ricci, K., Provencal, R., Owano, T. W., Jonsson, H. H., Schmid, B., Luu, A. P., Bokarius, K., and Andrews, E.: Comparison of in situ aerosol extinction and scattering coefficient measurements made during the Aerosol Intensive Operating Period, J. Geophys Res.-Atmos., 111(17), D05S03, doi:10.1029/2005jd006056, 2006. Winklmayr, W., Reischl, G. P., Lindner, A. O., and Berner, A.:
A New Electromobility Spectrometer for the Measurement of Aerosol Size Distributions in the Size Range from 1 to 1000 Nm, J. Aerosol Sci., 22, 289–296, 1991.