www.clim-past.net/7/1261/2011/ doi:10.5194/cp-7-1261-2011
© Author(s) 2011. CC Attribution 3.0 License.
of the Past
Hydrological variability in the Northern Levant: a 250 ka
multi-proxy record from the Yammo ˆuneh (Lebanon) sedimentary
sequence
F. Gasse1,**, L. Vidal1, A.-L. Develle1,*, and E. Van Campo2,3
1CEREGE, UMR6635, Marseille Universit´e-CNRS-IRD-Coll`ege de France, BP 80, 13545 Aix-en-Provence cedex 04, France 2Universit´e de Toulouse, UPS, INPT, Ecolab, 29 rue Jeanne Marvig, 31055 Toulouse, France
3CNRS, Ecolab (Laboratoire d’´ecologie fonctionnelle), 31055 Toulouse, France
*now at: Laboratoire Chrono-Environnement, UMR6249, Universit´e de Franche-Comt´e, 16 Route de Gray, 25030, Besanc¸on cedex, France
**Invited contribution by F. Gasse, recipient of the EGU Hans Oeschger Medal 2010 Received: 13 April 2011 – Published in Clim. Past Discuss.: 10 May 2011
Revised: 13 September 2011 – Accepted: 5 October 2011 – Published: 24 November 2011
Abstract. The Levant is a key region in terms of both
long-term hydroclimate dynamics and human cultural evolu-tion. Our understanding of the regional response to glacial-interglacial boundary conditions is limited by uncertainties in proxy-data interpretation and the lack of long-term records from different geographical settings.
The present paper provides a 250 ka paleoenvironmen-tal reconstruction based on a multi-proxy approach from northern Levant, derived from a 36 m lacustrine-palustrine sequence cored in the small intra-mountainous karstic Yammoˆuneh basin from northern Lebanon. We combined time series of sediment properties, paleovegetation, and car-bonate oxygen isotopes (δc), to yield a comprehensive view of paleohydrologic-paleoclimatic fluctuations in the basin over the two last glacial-interglacial cycles. Integration of all available proxies shows that Interglacial maxima (early-mid MIS 7, MIS 5.5 and early MIS 1) experienced relatively high effective moisture, evidenced by the dominance of forested landscapes (although with different forest types) associated with authigenic carbonate sedimentation in a productive wa-terbody. Synchronous and steepδc increases can be recon-ciled with enhanced mean annual moisture when changes in seasonality are taken into account. During Glacials periods (MIS 2 and MIS 6), open vegetation tends to replace the forests, favouring local erosion and detrital sedimentation.
Correspondence to:F. Gasse ([email protected])
However, all proxy data reveal an overall wetting during MIS 6, while a drying trend took place during MIS4-2, leading to extremely harsh LGM conditions possibly linked to water storage as ice in the surrounding highlands. Over the past 250 ka, the Yammoˆuneh record shows an overall decrease in local effective water, coincident with a weakening of sea-sonal insolation contrasts linked to the decreasing amplitude of the eccentricity cycle.
The Yammoˆuneh record is roughly consistent with long-term climatic fluctuations in the northeastern Mediterranean region (except during MIS 6). It suggests that the role of sea-sonality on effective moisture, already highlighted for MIS 1, also explains older interglacial climate. The Yammoˆuneh record shares some features with speleothem isotope records of western Israel, while the Dead Sea basin generally evolved in opposite directions. Changes in atmospheric circula-tion, regional topographic patterns and site-specific hydro-logical factors are invoked as potential causes of spatial heterogeneities.
1 Introduction
The Levant (Fig. 1), which stretches along the East Mediter-ranean seashore from Southeast Turkey to northern Egypt and Arabia, straddles the boundary between a typical temperate-warm Mediterranean domain and the subtropical desertic belt. Moisture primarily comes from the eastern Mediterranean Sea (EMS). Rainfall decreases sharply from north to south with latitude and more sharply from west to east due to the orographic effect of mountain ranges running parallel to the coastline. Just eastward, a chain of deep de-pressions, including the Dead Sea basin, forms a narrow cor-ridor. Altitudes range from more than 3000 m a.s.l. (above sea level) in Lebanon to 425 m b.s.l. (below sea level) along the Dead Sea shore. This complex physiogeographic pat-tern results in a large diversity of terrestrial environmental conditions which vary dramatically over short distances with latitude, altitude and continentality.
Numerous terrestrial and marine archives have revealed huge Late Quaternary climatic-hydrological fluctuations in the EMS domain. The northeastern Mediterranean region ex-perienced wet-warm interglacials with intense rainfall from the North Atlantic and cold-dry glacial environments when ice sheets over northern Europe reached their maximal ex-tension (e.g., Tzedakis, 2007), as showed, for example, by pollen-inferred reconstructions of climatic parameters (e.g., Guiot et al., 1999). Monsoonal rainfall penetrated the subtropical desertic belt during boreal summer insola-tion maximums (peak of Interglacials periods) while glacial stages were hyperarid, as revealed by speleothem, lake and groundwater archives (e.g., Gasse, 2000; Hoelzmann et al., 2004; Fleitmann and Matter, 2009).
Between these two domains, changes in water availabil-ity in the Levant, which might have influenced the mi-gration of early modern humans out of Africa and the Pleistocene-Holocene cultural dynamics of Eurasia (Bar-Yosef, 1998; Vaks et al., 2007; Shea, 2008; Carto et al., 2009; Frumkin et al., 2011), have been the focus of out-standing climatic-hydrological studies (see the reviews of Robinson et al., 2006; Enzel et al., 2008; Waldmann et al., 2010; Frumkin et al., 2011, and references therein). The best records come from U/Th-dated stable isotope profiles of Israeli speleothems and reconstructed lake-level fluctua-tions in the Dead-Sea basin (DSB). Long terrestrial pollen records are scarce and poorly dated (e.g., Bottema and Van Zeist, 1981; Weinstein-Evron, 1983; Weinstein-Evron et al., 2001; Meadows, 2005). In southern Levant, sporadic events of speleothems and travertine growth indicate episodes of en-hanced effective precipitation in phase with periods of inten-sified monsoon (Waldmann et al., 2010; Vaks et al., 2010). Just northward, the DSB experienced generally high lake water levels indicating locally high effective moisture dur-ing glacial periods and dry conditions durdur-ing Interglacials at-tributed to changes in rainfall amount by Enzel et al. (2008). Conversely, speleothemsδ18O profiles from western Israel
SYRIA TURKEY
EGYPT
JORDAN ODP 967
MD84-632
MD9509
Arava V.
Ghab basin
Dead Sea L. Tiberias
Yammoûneh
ISRAEL LEBANON
Jordan V.
Nile R.
Sinai Negev CYPRUS
1
3 2
SAUDI ARABIA
4
32°N 36°N
34°N
28°N 30°N d
36°E
32°E 34°E 38°E
MD9501
MD84-648
MD84-637
MEDITERRANEAN SEA
RED SEA
5 6
8
11 109
MD84-642
Hula basin
7
Fig. 1.The Levant in the eastern Mediterranean region. Location of the Yammoˆuneh basin and of sites cited in the text. For terrestrial records, 1: Jeita Cave; 2: Aammish marsh; 3: Peqi’in Cave; 4: Soreq Cave; 5: Lake Ohrid; 6: Tenaghi Philippon; 7: Lake G¨olhisar; 8: Lake Konya; 9: Lake Urmia; 10: Lake Zeribar; 11: Lake Mirabad.
1014 1015 1016 1017 1018 1019 1020 1021 1022
1002 1004 1006 1008 1010 1012 1014 1016 1018 1020
0.5 1 1.5 2 2.5 3 3.5 4 4.5 5
0.5 1.5 2.5 3.5 4.5 5.5 6.5
Sea Level Pressure (mb) Surface Precipitation Rate (mm/day)
January to February
June to
August
SH
AH
AH
CL
RST
PT
C
a
b
d
c
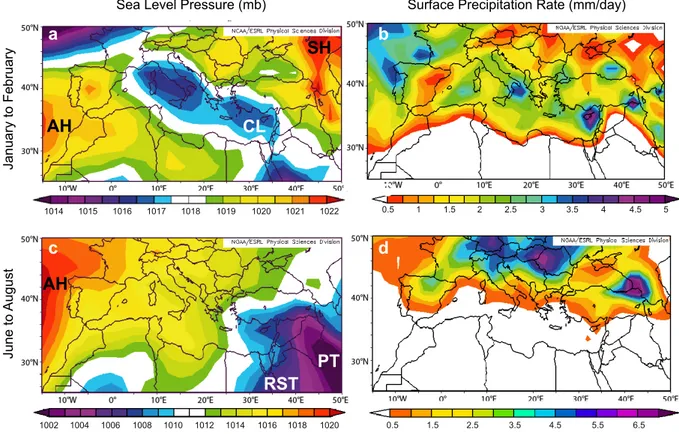
Fig. 2. Sea level pressure and surface precipitation rate in the Mediterranean region in winter – January–February:(a),(b)– and summer – June–August: (c), (d)– averaged from 1968 to 1996. Source: NCEP/NCAR Reanalysis. NCAA/ESLP Physical Sciences Division (http://www.cdc.noaa.gov/Composites/Day/). AH: Azores High; SH: Siberian High; CL: Cyprus Low; RST: Red Sea Trough; PT: Persian Trough.
Develle et al., 2010, 2011). Attention is paid here to new data: pollen-inferred paleovegetation and biogenic carbonate
δ18O data of the whole sequence. Our main aim is to yield a comprehensive view of the long-term environmental fluc-tuations in the Yammoˆuneh basin over the two last glacial-interglacial cycles by integrating the different proxies. Our record is then replaced in its regional context. The paper is underlaid by the following questions:
1. What are the relationships between individual proxies? 2. What are the main environmental characteristics of the
Yammoˆuneh basin during full glacial and interglacial peaks?
3. How does this record from northern Lebanon compare with other long-term records from central and southern Levant and from northeastern Mediterranean?
2 Modern setting
2.1 Main physiogeographic and climate features of the
Levant region
The steep topography of the Levant is related to the active Levant Fault System (Le Pichon and Gaulier, 1988) that runs from the NW tip of the Red Sea to SE Turkey through the Ar-ava Valley, the Dead Sea-Jordan Valley-Lake Tiberias-Hula basins to the Ghab basin in Syria (Fig. 1). East of narrow coastal plains, the SSW-NNE mountain ranges culminate at 3083 m a.s.l. in Mount Lebanon at only 20–25 km from the sea shore, while the Dead Sea basin represents the lowest spot of the Earth. Orography and distance from the seashore strongly modulate the local rainfall patterns.
distance teleconnections, e.g., the North Atlantic Oscillation (NAO) (Ziv et al., 2006, 2010; Dayan et al., 2008; Raible et al., 2010). Cyclones, either generated in the Mediterranean basin or penetrating from the North Atlantic, are steered by the mid-latitude westerlies and tend to propagate eastward along the northern coast of the Mediterranean until reach-ing the Levant region. When propagatreach-ing over the relatively warm seawater, air masses become saturated by moisture. In the EMS, polar intrusions create a deep upper-level trough accompanied by low-level cyclogenesis. The strength and position of cyclones formed or reactivated in the EMS (the Cyprus Lows, Fig. 2a) largely control the winter rainfall temporal and spatial variability in the Levant (Enzel et al., 2003; Ziv et al., 2006). In summer (Fig. 2c and d), when the Siberian anticyclone is attenuated and the Azores anticyclone and the mid-latitude westerly belt are shifted northward, the Levantine region is warm and dry. The summer low-pressure systems developed southward and eastward (the Red Sea Trough and the Persian Trough) are generally hot and dry (Kahana et al., 2002).
Several mechanisms indirectly link the Levant to subtrop-ical and tropsubtrop-ical climates. Very dry summer conditions over the eastern Mediterranean region and northeastern Sahara are partly due to the subsidence of easterly airflows linked to the Indian monsoon activity (Rodwell and Hopkins, 1996; Ziv et al., 2004). Most of the occasional rainfall events occurring in the Negev desert during spring and autumn are in conjunc-tion with an active Red Sea Trough (Kahana et al., 2002). Heavy dust storms of North African origin are frequent from December to April. Saharan dust influx to the region has often been attributed to the thermal lows of the Sharav cy-clones formed over Libya and Egypt (Alpert and Ziv, 1989) and the Red Sea Trough, but the cold Cyprus Lows also play a major role in attracting Saharan dust plumes (Dayan et al., 2008). The Nile River discharge, which depends on tropical rainfall in East Africa, affects the EMS hydrothermal dynam-ics (Rossignol-Strick and Paterne, 1999) and, thus, sea-land interactions.
2.2 The Yammo ˆuneh basin in Lebanon
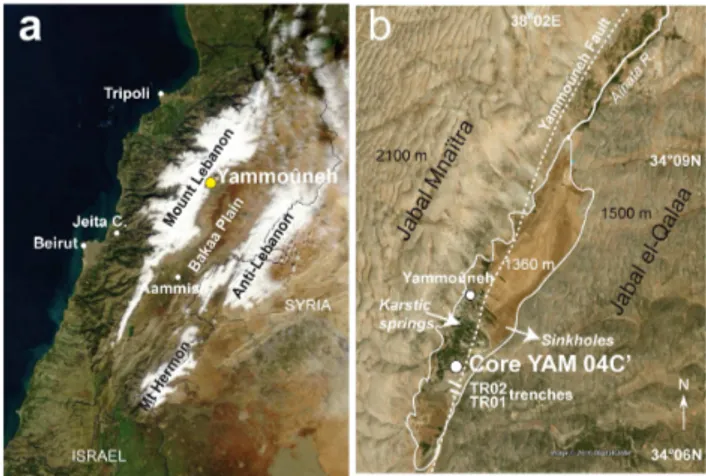
The Yammoˆuneh basin (34.06◦N–34.09◦N, 36.0◦E– 36.03◦E, 1360 m a.s.l.), 6 km long, 2 km wide, lies at approximately 37 km from the seashore on the eastern flank of Mount Lebanon (Fig. 3). It was occupied in its southern part by a seasonal lake from at least Roman times to the 1930s when it was drained for irrigation of the Bakka plain. It is today entirely cultivated. No paleo-shoreline was observed, suggesting that the paleolake never reached high levels during a period long enough to leave geomorphic evidence. The basin is a SSW-NNE depression of tectonic origin along the Yammoˆuneh Fault, a segment of the Levant Fault System. It was downfaulted through thick sub-tabular sequence of intensively karstified Cenomanian dolomitic limestones (Dubertret, 1975; Hakim, 1985). The strike-slip
Fig. 3. The Yammoˆuneh basin in Lebanon. (a)Satellite view of Lebanon in winter (January 2003), main morphological structures. (b)The Yammoˆuneh basin with location of the sedimentary pro-files. Dashed line: surface trace of the Yammoˆuneh Fault. Arrows schematize the groundwater circulation, from the Mna¨ıtra Plateau which provides the main water inflow to the basin via karstic springs emerging along the western edge of the basin, and infiltration along the eastern edge.
Yammoˆuneh Fault is active (slip rate: 3.8–6.4 mm yr−1), but vertical movements likely remained negligible during the Late Quaternary (Da¨eron et al., 2004, 2007; A. R. Elias, personal communication, 2009). The Yammoˆuneh basin is limited by the high Mna¨ıtra plateau (2100 m a.s.l.) that abruptly rises westward, and by the gently sloping hills (Jabal el-Qalaa, 1500 m a.s.l.) which separates the basin and the large Bakka plain syncline to the East.
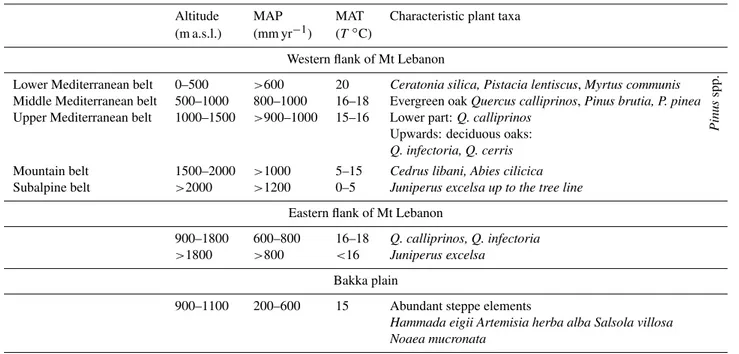
Table 1. Distribution of the modern vegetation belts in the Yammoˆuneh area as a function of location, altitude, mean annual precipitation (MAP) and mean annual temperature (MAT). After Abi-Saleh and Safi (1988).
Altitude MAP MAT Characteristic plant taxa
(m a.s.l.) (mm yr−1) (T◦C)
Western flank of Mt Lebanon
Lower Mediterranean belt 0–500 >600 20 Ceratonia silica, Pistacia lentiscus,Myrtus communis
Pinus
spp.
Middle Mediterranean belt 500–1000 800–1000 16–18 Evergreen oakQuercus calliprinos,Pinus brutia, P. pinea
Upper Mediterranean belt 1000–1500 >900–1000 15–16 Lower part:Q. calliprinos
Upwards: deciduous oaks:
Q. infectoria, Q. cerris
Mountain belt 1500–2000 >1000 5–15 Cedrus libani, Abies cilicica
Subalpine belt >2000 >1200 0–5 Juniperus excelsa up to the tree line
Eastern flank of Mt Lebanon
900–1800 600–800 16–18 Q. calliprinos, Q. infectoria
>1800 >800 <16 Juniperus excelsa
Bakka plain
900–1100 200–600 15 Abundant steppe elements
Hammada eigii Artemisia herba alba Salsola villosa Noaea mucronata
and sub-desertic conditions, the eastern slopes receive less rainfall than corresponding altitudes in west Lebanon. Only Mediterranean oaks, and junipers at high elevation, are present. The much drier Bakka plain is open to influx of steppe elements from the adjacent Irano-Turanian territory. Human impact has considerably deteriorated and modified the natural ecosystems since millenia.
Hydrologically, the Yammoˆuneh basin primarily depends on precipitation over the western highlands. Direct precip-itation on the paleolake surface (<1.2×10⁶m3yr−1) and on the small surface watershed (∼105 km2; Develle et al., 2011) is negligible compared to the important water inflow brought by permanent karstic springs (35–70×106m3yr−1; Besanc¸on, 1968; Hakim, 1985). Beneath the Mna¨ıtra plateau, subterranean karstic networks collect snowmelt wa-ter feeding a dozen springs along the weswa-tern edge of the basin. The cool karstic spring water exhibits an isotopic com-position (mean: δ18O =∼ −8.9 ‰, δD =∼ −50.8 ‰) very close to that of winter rainfall (∼90 % of MAP) in the wa-tershed (Develle et al., 2010), without significant impact of evaporation or sublimation before infiltration (Aouad et al., 2004). Studies of nearby karstic aquifer systems show that groundwater residence time is negligible on the geo-logical time-scale (from 1 season to 2–3 years; Aouad et al., 2005; El Hakim, 2005). In the basin floor, sinuous channels drain spring and runoff water from the west into karstic sinkholes along the eastern border. The karstified, intensively fissured and faulted substrate, is highly perme-able. Hence, the basin is hydrologically open with rapid
throughflow. Water residence time and relative evaporation losses may have, however, increased when a permanent lake occupied the basin.
3 Stratigraphy, chronology and sedimentary processes
Descriptions of stratigraphical units, analytical methods ap-plied for chronology and sedimentology, and discussions on result interpretations are detailed in Develle (2010) and Dev-elle et al. (2010, 2011). Main results are summarized below.
3.1 Stratigraphy
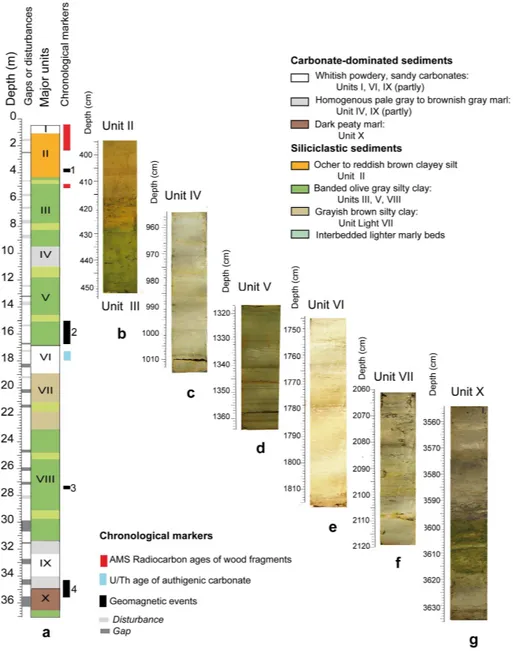
The upper 36 m of the sediment core (YAM-04C’, 73 m) col-lected in 2004 from the central part of the Yammoˆuneh pa-leolake (Fig. 3) has revealed a sub-continuous accumulation of lacustrine-palustrine sediments. A very simplified strati-graphic log and pictures of some core sections illustrate the variety of lithofacies (Fig. 4). As the uppermost Unit I is truncated in the core, some data were derived from nearby trenches (TR01, TR02, Fig. 3) which contain the whole Holocene period.
The profile shows two main types of sediments, although transitions between stratigraphic units are often gradual:
Fig. 4.Stratigraphy and lithofacies of the upper 36 m of core Yam 04 C’.(a)Simplified stratigraphic log. Position of gaps in core recovery and of sediment disturbances on the left; position of chronological markers on the right.(b)to(g)Pictures of some core sections illustrating the facies diversity.(b)Transition from reddish, oxidized silt of Unit II to olive gray silty clay of Unit III.(c)Pale greenish marl.(d)Typical banded greenish marl.(e)Typical interglacial calcitic powdery deposits.(f)Brownish, coarsely banded silty clay.(g)Peaty marl of Unit X.
charophytes, fish otoliths ...), or of light gray to light brown marl (Unit IV and part of Unit IX; Fig. 4c). 2. Thick accumulations of intensively coloured silty clay.
This siliciclastic material is almost devoid of shells (be-sides ostracods). The ocher to reddish brown Unit II (Fig. 4b) shows numerous strongly oxidized, indurated layers and beds of coarse limestone gravels and con-cretions. Units III, V, VII and VIII consist of plastic olive gray (Fig. 4d) or grayish brown silty clay (Fig. 4f) often organised in bands 2–20 cm thick. Several lay-ers, 3–8 cm thick, suggest paleosoils; a few centimetric
intervals are laminated; lighter marly intervals are in-terbedded in these units.
The lowest carbonate-rich Unit X (Fig. 4g) differs from oth-ers by its very dark brownish to black colour and its peaty feature, rich in aquatic plant fragments, beds of fish otoliths and well-preserved mollusc shells. Below 3650 cm, it over-lays greenish cover-lays resembling Units III or VIII.
All encountered remains of aquatic organisms are typical of fresh, shallow or even ephemeral waterbodies.
Table 2. Performed analyses on the upper 36 m of core YAM04-C’. Variables included in the PCAPManalysis (Fig. 8) are numbered in column 2.
Observations and Variables Variable Nb of
Analyses included analysed
in PCA samples
Main lithofacies types 1 Whitish powdery, sandy carbonate 1 continous
Pale gray to pale brown marl 2 continous
Yellowish brown to reddish brown silt 3 continous
Olive gray silty clay 4 continous
Brownish gray silty clay 5 continous
Dark brown, peaty or paleosoil-like levels 6 continous Sediment composition 2 XRD mineralgy (% weight dry sediment) Calcite (+ Aragonite: 0–3 %) 160
3 Quartz 160
4 K-Feldspaths + Plagioclases 160
5 Dolomite 160
6 Clay minerals 160 Same
samples
7 TOM (% weight dry sediment) 160
8 Total magnetic susceptibility (10−5SI) 2417
9 XRF Element relative content Ca 2109
10 Si 2109
11 Al 2109
12 Fe 2109
13 Ti 2109
14 K 2109
Pollen analysis 15 Steppic-desertic landscape Artemisia + Chenopodiacea + Cichoroideae 225 16 Middle Mediterranean zone Pinus + evergreen Quercus 225 17 Upper Mediterranean zone Deciduous Quercus 225
18 Montane belt Cedrus + Abies 225
19 Subalpine zone Juniperus 225
20 Aquatic + Hydrophilous (% total pollen) Myrioplyllus, Potamogeton, Typha, 225 Cyperaceae, Ranunculus
Carbonate oxygen isotope 21 δcderived from ostracodδ18O values 190
Microscopic observations Smear slides 250
Scanning electron microscope 52 Same
Grain size analysis 52 samples
3.2 Chronological framework
The age model of core YAM-04C’ was based on the com-bination of radiometric dating and magnetic chronostratigra-phy. The position of dated levels along the profile is showed in Fig. 4a.
The top of the sequence was 14C-dated by Accelerator Mass Spectrometry (AMS) on partly carbonized wood frag-ments (11 levels from 0–21 ka; 0–250 cm). A 14C age at 535 cm (47±4 ka) should be regarded with caution as it reaches the limit of the14C method applicability. The14C ages were calibrated using IntCal 09 (Reimer et al., 2009). One level of almost pure authigenic calcite has provided a reliable U/Th age of 124±17 ka at 1770 cm. Four ge-omagnetic events (1 to 4; Fig. 4a) were identified, based on changes in inclination and relative paleointensity of the Earth magnetic field. The very well identified Event 2 (1590– 1660 cm) is the Blake event (∼114–120 ka). Events 1 and 3 likely represent the Laschamp (41±2 ka, 340–370 cm, peak-ing at 361 cm) and the Iceland Basin event (∼190–194 ka;
2735 cm), respectively. Event 4 (3420–3490 cm) coincides either with the Pringle Falls event (∼211 ka) or the Ma-maku event (230±12 ka). An approximate age of 230 (+12/−20) ka was assigned at 3460 cm.
0
500
1000
1500
2000
2500
3000
3500
4000
50 100
XRF Ca (cps) relative content
105
Ti
Mn Al K Si Fe
103 104
XRF detrital elements (cps) relative content
0 200 300 Magnetic susc.
0 4 8 12 TOM % wt.
Carbonate % wt x105 4
0 2 6
0 50 100
XRD mineralogy (%)
Calcite + Aragonite Dolomite Quartz
K-Feldspath + Plagio Clay minerals.
0
S
tr
a
tig
raphical
Units D
epth (cm)
I
II
III
IV
V
VI
VII
VIII
IX
X
XI
KLF (10-5 SI)
Estimated age
Dated levels MIS
113 121 41±2
47±4
124±17
192±2
230 (+12/-20)
73 60
88
170 150
220 MIS 1
MIS 5
MIS 6
MIS 7
MIS 8? ?
? ?
MIS 4 - 3 - 2
? 19.4±0.4
8
105
Fig. 5. Sedimentological data. Main proxies versus depth along the stratigraphical profile, after Develle et al. (2011). On the right, chronological information: position and measured ages of the chronological markers, estimated ages of major sedimentation changes (in italic, interpolated ages), and hypothesized relationships with Marine oxygen Isotope Stages (MISs; Martinson et al., 1987). Horizontal dashed lines: major (red) and second order (grey) sedimentation changes.
3.3 Sedimentary processes
Major sedimentary results are illustrated in Fig. 5.
Sedimentation has been primarily controlled by: (i) in situ lacustrine carbonate production, (ii) erosion of the surface watershed, and (iii) eolian inputs.
The whitish Units I, VI and IX coincide with interglacial periods (MIS 7, MIS 5.5, MIS 1). They consist mainly of cal-cite precipitated into the waterbody (authigenic rhomboedric crystals and biogenic fragments). Lacustrine calcite pro-duction was enhanced by high temperature and evaporation, strong biological activity in the lake, and high Ca2+ inputs suggesting heavy karstic spring discharge and active circula-tion in the Mna¨ıtra karstic system. Low magnetic suscepti-bility values and relatively low contents of Fe, Ti and K and Total Organic Matter (TOM) were attributed to reduced local erosion and dilution of detrital particles by authigenic car-bonates. The quasi-absence of runoff-derived material and high carbonate content may suggest very low rainfall. How-ever, the synchrony of carbonate peaks with the abundance of lacustrine organisms and with the development of arboreal vegetation (see Sect. 4.1) reducing erosion processes rather
reflects high water availability in both the karstic recharge zone and the paleolake surroundings.
0
500
1500
2000
2500
3000
3500
4000 1000 I
II
III
IV
V
VI
VII
VIII
IX
X
Stratigraphic Units Depth (cm) Aquatic Subaquatic
0
0 20 40 60
0 20 40 60 20 40
0 20 40 60 80
% of Total pollen sum % of Terrestrial pollen sum
0 0 20 40 60
Deciduous Quercus
Evergreen Quercus
Pinus Juniperus
Artemisia Chenopodiaceae
Cichorioideae
113 121 41±2
47±4
124±17
192±2
230 (+12/-20)
73 60
88
170 150
220 MIS 1
MIS 5
MIS 6
MIS 7
MIS 8? ?
? ?
MIS 4 - 3 - 2
Estimated ages Dated core levelsMIS
?
19.4±0.4 8
105
0 20 40 60
Cedrus +
Abies Total Tree pollen
AP %
0 20 40 60 80 100
-2 -1 0 +1 +2
ACPB-Axis 1 scores
Fig. 6. Palynological data. Relative frequencies of selected pollen taxa versus depth along the stratigraphical profile, total tree pollen percentages (AP %) and ACPB-Axis 1 scores showing the alternance of forested and steppic landscapes. Chronological information as for
Fig. 5. Horizontal dashed lines: major (red) and second order (grey) vegetation changes.
Marls (Unit IV and IX) and pale marly layers interbedded in silty clay are intermediate between these two typical sed-iment types. The peaty marl of Unit X, rich in TOM and biogenic rests, indicates the occurrence of a productive lake at the core site.
4 New data from the Yammo ˆuneh sequence
4.1 The pollen record
Most of the Yammoˆuneh sequence contains pollen grains, al-though its top (<8.3 ka) is sterile possibly due to oxidation after the lake drainage. Vegetation patterns inferred from the pollen record were based on 225 samples prepared for pollen analysis using standard palynological procedures. An aver-age of 465 pollen grains was counted in each sample. A total of 69 pollen taxa were identified, using reference collections and Reille’s (1992) pollen atlas.
Pollen results are given as a percentage diagram of se-lected taxa (Fig. 6). Aquatic (Myriophyllum mainly) and marsh (Cyperaceae dominant) plant pollen, indicative of per-manent lacustrine conditions or swamps around the core site, respectively, are expressed in percents of the total pollen sum. Both reach their highest percentages in the lower half of the core and then tend to disappear, suggesting drier local conditions above 1800 cm.
The total percentage of tree pollen (AP %) provides a broad view of the alternance between forested and steppic landscapes, mainly reflecting changes from moist to drier conditions although very cold climate might have limited the tree growth. The few available regional modern pollen spectra prevent any application of a pollen-based transfer function to quantify changes in rainfall amount or in tem-perature. Terrestrial pollen data were converted into Plant Functional Types (PFTs) and a pollen-derived biomization of the PFTs was elaborated using the appropriate meth-ods for Mediterranean regions (Tarasov et al., 1998). Five pollen-derived biomes (PdBs; scores not shown) were in-ferred from the Yammoˆuneh dataset: (1) cool conifer for-est; (2) temperate deciduous forfor-est; (3) warm mixed forfor-est; (4) xerophytic woods/shrubs; (5) steppe. Hot and cool steppe biomes were not separated, because of the low representa-tion of discriminating pollen taxa in the spectra. When affin-ity score differences between biomes are low, the use of the highest-scoring PdB alone may obscure significant vegeta-tion changes. Therefore, a down-core ordinavegeta-tion of samples taking into account major changes in all the PdB-scores was obtained by a principal component analysis (PCAB). The general pattern of the PCAB scores is not affected when excluding Asteraceae subfam. Cichorioideae from the ba-sic sum. PCAB-Axis 1 (77.98 % of total inertia) is posi-tively loaded by all forested biomes (PdBs 1 to 4; pollen taxa groups 1 to 4), and negatively by steppe (PdB-5, pollen taxa group 5). Intervals of highest PCAB-Axis 1 correspond to periods of best development of arboreal vegetation, whereas its lowest values indicate the dominance of open vegetation types. PCAB-Axis 1 closely resembles the AP % curve, but highlights the development of tree elements below 1800 cm. Below 3670 cm (>240 ka?), the dominance of steppe (PdB 5) punctuated by stands of pines may represent the MIS 8–MIS 7 transition. The interval 3670–3320 cm (∼240– 220 ka?, early-mid MIS 7) has the highest PCAB-Axis 1. PdB-1 dominated over the basin slopes, as showed by the highestJuniperusfrequencies associated withCedrus. High-est aquatic pollen frequencies indicate permanent lacustrine conditions, allowing the development of riparian deciduous oak groves (deciduousQuercus). This indicates high Precipi-tation (P) and low Evaporation (E) favoured by cool temper-atures. From 3320 to 2970 cm (late MIS 7?) the increase in temperate Mediterranean trees and steppic taxa, responsible for intermediate PCAB-Axis 1 values, reflects lower effective moisture partly explained by higher temperature as suggested by the falling representation ofJuniperus.
The interval 2970–1870 cm, assigned to MIS 6 (although its base is∼10 ka too old in our age model), is first char-acterised by a strong dominance of steppe (PdB 5), and the almost disappearance of aquatic and palustral pollen. This suggests very dry conditions, although the opening of the landscape may partly result from the lowering of the upper tree line under glacial cooling. Above 2550 cm (180 ka?), a step-wise increase in PCAB-Axis 1 depicts a progressive
development of arboreal vegetation. High affinities to the PdB-1 loaded byJuniperus,CedrusandAbiespoint to cool and wet conditions, as confirmed by small peaks of aquatic pollen.
MIS 5.5 (∼1850–1680 cm; ∼130–120 ka) begins with a warming-induced abrupt fall of Juniperus and rise of bothQuercus types. Then, temperate Quercus are rapidly replaced by a typical Mediterranean vegetation. PCAB-Axis 1 become very high whenPinusand evergreenQuercus reached their maximum percentages, and aquatic/palustral plant pollen disappeared. This vegetation does not lend sup-port to aridity in the Yammoˆuneh basin, but for high sea-sonal contrasts. The largest population of evergreen Quer-cus suggests very dry summers, which increase the com-petitive advantage of Mediterranean sclerophyllous trees (Di Castri, 1981). After this last interglacial optimum, between 1680 and 960 cm, a sharp increase in steppic elements is in-terrupted by two positive shifts in temperate/Mediterranean tree pollen frequencies, concomitant with small peaks of palustral plant pollen. These shifts, registered at 1520– 1480 cm (∼105 ka) and 1015–960 cm (∼80–73 ka), are as-signed to MIS 5.3 and MIS 5.1, respectively.
From 960 to 220 cm (∼73–16 ka; MIS 4-3-2), the steppe development clearly depicts an overall drying trend from the beginning of MIS 4. This trend is interrupted by short, hu-mid episodes revealed by positive shifts of PCAB-Axis 1 at 820–750 cm and 500–410 cm (∼65–60 and 45–40 ka, respec-tively, in our time scale). The lowest PCAB-Axis 1 values of the whole record are reached at 240–220 cm (∼21–16 ka). This demonstrates that temperature and/or moisture condi-tions in the Yammouneh basin, together with very low CO2 atmospheric concentration, were not compatible with the de-velopment of an arboreal vegetation at the end of the LGM.
The last forested stage is recorded by a sharp increase of deciduousQuercus (PdB2) starting at 170 cm (13 ka), and culminated from 11 to 9 ka. It indicates the re-establishment of warmer/wetter conditions during the early Holocene.
Major points arising from the pollen study are the following:
– Arboreal vegetation dominates during interglacial op-timums (early-mid MIS 7, MIS 5.5 and early MIS 1), reflecting relatively high effective moisture. Vegetation dynamics suggest very wet and cool conditions during MIS 7, strong thermal and hydrological seasonal con-trasts during MIS 5.5, and wet temperate conditions dur-ing the early Holocene.
– The driest intervals appear at the end of the LGM and during early MIS 6.
including aquatic pollen, suggests a progressive decline in effective moisture as a result of the combined effect of temperature, precipitation andpCO2fluctuations in the Yammoˆuneh basin.
4.2 The carbonate oxygen isotope record
The oxygen isotope composition of continental carbonates reflects complex interactions between several climatic vari-ables and site-specific factors. In addition, in the case of biogenic carbonates, species-dependent factors (the so-called “vital effect” and auto-ecology) should be considered. We refer to Develle et al. (2010) and reference therein for ana-lytical procedures, theoretical backgrounds and for the inter-pretation of the past 21 ka isotope record. Authigenic car-bonate δ18O values (δc) are primarily controlled by water temperature and isotopic composition of the ambient water, here lake water (δL). TheδLvalues are governed by the iso-topic composition of the water inflow (δin) and of other terms of the lake water balance (inflow−[Evaporation + outflow]). The termδin depends on the precipitationδ18O values (δP) and the P-E balance in the lake catchment. The δP val-ues are in turn controlled by the isotopic composition of the moisture source, here the EMS surface water (δsw), storm-track trajectories and the negative/positive relationships with local rainfall amount/ground-temperature. In central Lev-ant, Frumkin et al. (1999), Bar-Matthews et al. (2003) and Kolodny et al. (2005) have showed that long-termδ18O fluc-tuations in inland carbonates are primarily driven by the glacial/interglacial variations in the isotopic composition of the EMS surface water. The rainfall amount probably rep-resents the second order factor (Frumkin et al., 2011). Bar-Matthews et al. (2003) and Bar-Bar-Matthews and Ayalon (2004) took the temperature and rainfall amount into account to in-terpret low interglacial speleothemδ18O values.
The carbonate δ18O record from Yammoˆuneh was ob-tained from ostracod valves present and well preserved in most samples. Analyses were performed on the 4 most abundant taxa (Ilyocypris inermis, I. gibba, Candona ne-glectain Unit I only, and Fabaeformiscandona balatonica only present below 1800 cm; none of them occurs in suffi-cient number in all samples for analyses). Interspecificδ18O differences were determined, all values were normalized to the most widespread taxon (I. inermis) and corrected for the vital effect (∼2.4 ‰) estimated for this species (Develle et al., 2010). This correction provides values coeval with that of authigenic calcite (δc) which would have precipitated at equilibrium in the same ambient water. Along the entire profile, δc values fluctuate by 5.1 ‰, between −12.6 and
−7.5 ‰ (Fig. 7a). The profile is characterised byδcvalues generally lower before MIS 5.5, a reverseδc trend between the penultimate and the last glacial periods, and very sharp
δcrises during interglacial peaks.
For the past∼21 ka (Develle et al., 2010),δLwas first esti-mated by correctingδcfor lake water temperature (assuming
that the water temperature of the shallow Yammoˆuneh wa-terbody was in equilibrium with air/ground temperature), us-ing the few available data on regional paleotemperatures. Second, isotopic composition of the moisture source (δsw) was derived from planktonic foraminifera (G. ruber)δ18O records (δforam) in a Levantine core (MD84-632, Fig. 1; Es-salami et al., 2007), corrected for surface water temperature using alkenone-based SST (SSTalk) records from the same core. Thirdly, the difference118O =δL−δswwas calculated in order to discuss the impact of the “source effect” on the Yammoˆuneh isotopic signal, adopting an approach close to that of Almogi-Labin et al. (2009). Develle et al. (2010) con-cluded that both the “source effect”, amplified by increase in-land rainfall during the early Holocene, and the large glacial-interglacial temperature changes have been important drivers on δ18O fluctuations. Changes in storm-track trajectories may have also contributed to the signal.
The same approach is attempted here to interpret ma-jor glacial/interglacialδc changes over the past 250 ka, but should be regarded with great caution because of large un-certainties on the timing and marine data (Fig. 7b–d) used to reconstructδswandδL.
4.2.1 Temperature effects
Age (ka) 0 20 40 60 80 100 120 140 160 180 200 220 240 260
-12 -8 -4 0 4
d c δsw -2 0 2 4 (‰ SMOW) EMS Levantine Basin
-2 0 2 8 12 16 20 24
SSTAlk.
∆T Soreq Cave (°C) (°C)
4
δforam (‰ PDB)
-8 -10 -12 -14
-8 -10 -12
(‰ SMOW) (‰ PDB) δL Modern δP Glacial δP (‰ SMOW) ∆18O
δsw
- δ
P δsw -δP Glacial Modern Yammoûneh δc 0 20 40 60 80 100 120 140 160 180 200 220 240 260
Age (ka)
e b
-15 -13 -11 -9 (Y
ammo
ûneh
age model)
-12 -8 -10
0 500 1000 1500 2000 2500 3000 3500 4000
Core Depth (cm)
Stratigraphical Units
I II III IV V VI VII VIII IX X XI Trench
Yammoûneh Tentative reconstruction of δL and ∆18O at Yammoûneh
(% PDB) δc ? ? ? ? a f MD40-71 ODP 967 Soreq MD9501 ODP 967 ODP 967) MD9501 ODP 967
Fig. 7.Carbonate oxygen isotope record. Tentative reconstruction ofδLand1δ18O =δsw−δLusing EMS marine data.(a)The Yammoˆuneh
δcprofile versus depth (values above 0 cm of core depth come from trench TR02 which includes the entire Holocene period). (b)SSTalk
records from cores M40-71 and ODP 967 (Emeis et al., 2003), and inland temperature inferred from Soreq Cave speleothems (McGarry et al., 2004).(c)δ18O records of planktonic foraminifera (δforam) from cores MD9501 (Almogi-Labin et al., 2009) and ODP 967 (Kroon et al.,
1998: black; Emeis et al., 2003: orange). (d)Isotopic composition of sea surface water (δsw) in the Levantine basin calculated from SSTs
in core MD40-71 andδforamfrom cores MD9501 (0–86 ka) and ODP 967 (78–250 ka, combined Kroon et al., 1998 and Emeis et al., 2003,
data).(e)The Yammoˆunehδcprofile and reconstructedδLversus time (according to our age model). The blueδLcurve is based on inferred
1Tsealevelon the modern mean annual temperature difference between sea level and Yammoˆuneh, the green one accounts for an additional
altitudinal cooling during glacial periods. Vertical dashed lines: modern and inferred glacialδPvalues. (f)Calculated1δ18O. Colours as
for(e). Dashed and full blue curves are based onδswderived from cores ODP 967 and MD9501, respectively. Vertical dashed lines:δsw−δP
values inferred for modern and glacial times. See text for explanation.
precipitation was likely niveous (more depleted than liquid rainfall, Rozanski, 2005),δPmay have decreased even more. In order to inferδsw, we used the high resolution time se-ries ofδforam from core MD-9501 (86 ka; Almogi-Labin et al., 2009) and the poorly-resolved record of ODP 967 from Kroon et al. (1998) complemented by detailed measurements around sapropel events (Emeis et al., 2003) (Figs. 1 and 7c). Although not recorded in SPECMAP (Imbrie et al., 1984),
δforam fluctuations between∼170 and∼150 ka of the same amplitude as in ODP 967 were observed in cores MD84-648 and -637 (Fig. 1) closer to the Nile delta (Ducassou et al., 2007). By combining the1Tsealeveland theδforamvalues, we applied the same paleotemperature equation as forδLto ob-tain an approximate record ofδswfor the northern Levantine basin (Fig. 7d).
4.2.2 Source effect
The “source effect” was extracted by calculating
0
500
1000
1500
2000
2500
3000
3500 3500
Depth
PC1 scores
PC2 scores
-4 -2 0 2 4
-4 0
4 -8
a
PCAMP
b
-0.5 -0.4 -0.3 -0.2 -0.1 0 0.1 0.2 0.3 0.4 0.5
-0.4 -0.3 -0.2 -0.1 0 0.1 0.2 0.3 0.4 Juniperus
Aquatic + palustralCedrus + Abies
Pinus
Everg. Quercus
Ca
δ18O
Calcite + Arag.
TOM
Clay min.
Dolomite
Sediment color
Magnetic Susc. Fe AlK
Si ,Ti Quartz
Feldpaths
Steppe F2
F1
Dec. Quercus
(49.1% of total variance)
(14.2% of total variance)
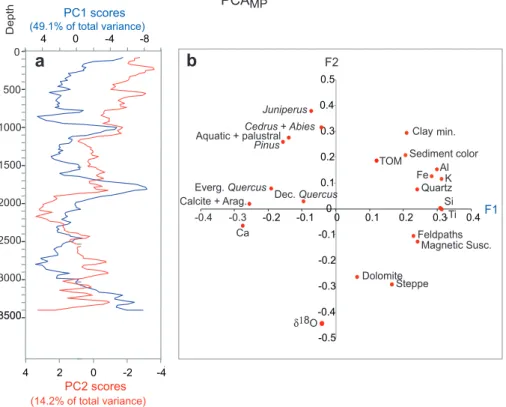
Fig. 8.Principal Component Analysis performed on 22 environmental variables (Tabl 2) in 166 core levels from core YAM04 C’ (ACPMP).
(a)Scores of the 2 first components (PC1 and PC2) versus depth.(b)Projection of environmental variables in the factorial plan F1–F2.
changes in rainfall seasonality might have affectedδP and, thus,δL and1δ18O. At Yammoˆuneh, modern winter 18 O-precipitation values are lower than spring and autumn values by∼2.5 ‰ (Develle et al., 2010). The transition to higher
δL and higher 1δ18O values could reflect a longer rainy season, increasing the relative contribution of spring and fall precipitation on the mean annualδP values. Third, changes in air mass trajectories might have modifiedδP. Presently, at the rainfall event scale, the less18O-depleted rains close to Beirut (δP:−2 to−4 ‰) are associated with air masses from the North (Aouad et al., 2004, 2005). Felis et al. (2004) have suggested increased advection over the near East of cold continental air from the North linked to a high NAO index in winter during MIS 5.5. Enhanced northerly winds might have increasedδP. However, based on modern data, Vaks et al. (2010) suggested that a negative NAO index is linked to lower winter temperatures in Israel and leads to increased winter precipitation (and, thus, reduced winterδP).
During Glacials,1δ18O was generally low, although sharp positive peaks around∼170 ka (in phase with aδLincrease),
∼145 ka and during short MIS 4–3 intervals may reflect short wet pulses. Lowδc,δL andδP values (Fig. 7e) suggest the dominance of18O-depleted winter rains, low water and at-mosphere temperatures and low evaporation rates. Freezing over most of the year have likely inhibited evaporative18O concentration. Changes in storm tracking may have con-tributed to the isotopic signal. Today, the most18O-depleted
rains reaching Lebanon (δP: −6 to−11 ‰) come directly from the west and have a long path over the sea (Aouad et al., 2004, 2005). Major storm-tracks funneled along the south-ern EMS coast due to ice extent in northsouth-ern high latitudes, as proposed by Enzel et al. (2008), may have enhanced theδP and1δ18O decreases.
4.2.3 To sum-up
Our approach suggests that the isotope balance of the Yammoˆuneh hydrosystem was initially controlled by the “source effect” (δsw), but this effect was deeply mod-ulated and modified by other factors associated with glacial/interglacial atmospheric patterns and the site-specific water balance. These factors include annual and seasonal changes in temperature and related evaporation rate, rainfall amount and rainfall isotopic composition.
5 The multi-proxy Yammo ˆuneh record
5.1 Relationships between individual proxies
Table 3.Significant simple linear correlation coefficients (p <0.001) between environmental variables from Yammoˆuneh.
Ca Calcite Quartz Kaolinite K-Fedspaths Magnetic TOM Al Si K Ti Fe Deciduous
(rel. (+ aragonite) + smectite + Plagio. Susceptinility (rel. (rel. (rel. (rel. (rel. Quercus
cont) + chlorite cont) cont) cont) cont) cont) (%)
Calcite (+ aragonite) (%) 0.791
Quartz (%) −0.756 −0.970
Kaolinite + smectite + chlorite (%) −0.620 −0.674 0.509
K-Fedspaths + Plagio. (%) −0.551 −0.807 0.570 0.460
Magnetic Susceptibility (SI) −0.607 −0.640 0.663 0.678
TOM (% wt) −0.484 −0.411 0.330 0.625 0.526
Al (rel. cont) −0.760 −0.728 0.687 0.641 0.602 0.624 0.411
Si (rel. cont) −0.754 −0.794 0.787 0.520 0.545 0.661 0.456 0.426
K (rel. cont) −0.806 −0.784 0.744 0.640 0.602 0.624 0.592 0.976 0.961
Ti (rel. cont) −0.836 −0.812 0.882 0.509 0.587 0.657 0.584 0.927 0.955 0.943
Fe (rel. cont) −0.786 −0.732 0.689 0.866 0.528 0.697 0.628 0.868 0.794 0.851 0.828
Juniperus(%)
Abies + Cedrus(%)
DeciduousQuercus(%) 0.361 0.361 −0.338 −0.342 −0.406 −0.407 −0.392 −0.316
Everg.Quercus+Pinus(%) 0.335 0.428 −0.496 −0.410
Steppic (%) −0.495 −0.572 0.616 −0.708 0.648 0.387 0.553 0.470 0.578 0.408 −0.674
Aquatic + subaquatic (%)
δ18O carbonate (PDB ‰)
AP % 0.51 −0.49
Environmental variables were initially reconstructed with different depth resolution and along different core length. Thus, data were re-sampled with a common depth-scale (20 cm) between 64 and 3364 cm. This procedure shortens the high resolution and the longest records, but the resulting matrix, based on 166 core levels, is well-suited for numerical analyses. Environmental variables were translated into stan-dard deviation units (s.d.u.). Significant simple linear corre-lation coefficients between individual variables are plotted in Table 3. Data integration was performed using the Analy-series 2.0 software (Paillard et al., 1996).
We first performed a PCA on the multiproxy matrix (ACPMP) of 22 variables listed in Table 2. Scores of two first principal components PC1 and PC2 (63.3 % of total var-iane) and the projection of the variables in factorial plans 1– 2 are plotted in Fig. 8a and b. PC1 scores confirm the 2 poles (end-members) of sediment fraction, carbonate (Ca, calcite + aragonite) v. all other sediment components (detri-tal), already highlighted by Develle et al. (2011). Note that carbonate-dominated units are mainly composed of authi-genic calcite. Axis 1 shows close linkages between carbonate and arboreal vegetation lying on the negative side, Mediter-ranean evergreenQuercushaving the strongest contribution among tree taxa. The positive loading of steppe and silici-clastic (and dolomite) components shows that high contri-bution of eolian and local detrital influxes to sedimentation prevailed during periods of open vegetation. PC2 differenti-ates the lower (>1870 cm) and upper halves of the sequence. This asymmetry is largely due to the strong positive load-ing on Axis 2 of pollen from cool conifer forests (Juniperus, Cedrus, Abies) and aquatic-palustral plants which are poorly represented above 1870 cm. Theδc values steer Axis 2 on the negative side. The positive correlation between TOM and detrital elements and the distance between aquatic-palustral plant pollen and TOM in factorial plans 1–2 suggests that,
in most samples, TOM is derived from the catchment soil erosion rather than from organic production in the local wa-terbody. The low contribution ofδcand tree pollen from cool wet forests,Pinusand deciduousQuercusto Axis 1 suggest thatδc fluctuations and these tree types are partly indepen-dent of the sediment components.
We then computed a PCASed based on all sedimentologi-cal proxies. Figure 9a shows PCASed-Axis 1 (67.8 % of to-tal variance) and resampled PCAB-Axis 1 based on pollen-derived biomes (see Sect. 4.1). Aquatic/palustral assemblage andδ18O are excluded from this comparison. Visual obser-vation reveals a close link between the highest PCAB-Axis 1 and the lowest PCASed-Axis 1 values, except between∼500 and ∼200 cm when detrital carbonates became abundant. Drastic decreases in PCAB-Axis 1 may be partly explained by the lowering of the upper tree line during the coldest pe-riods, but lithofacies above 500 cm indicate that these shifts primarily reflect a local drying. A cross-correlation between the PCAB-Axis 1 and PCASed-Axis 1 scores (Fig. 9b) con-firms the negative correlation between the two depth/time-series by a narrow peak centred on depth-lag 0 (−48.6 ‰), reflecting the co-evolution of both signals during the whole sequence.
Relationships between isotope (δc) and vegetation dynam-ics (Fig. 9c and d) are more complex. PCAB-Axis 1 and
δc run roughly parallel during the coloured detrital-rich in-tervals. Overall decrease/increase inδcwhen PCAB-Axis 1
increased/decreased can be classically interpreted as reflect-ing wettreflect-ing/dryreflect-ing trends, respectively (e.g., in the intervals
-2 -1.5 -1 -0.5 0 0.5 1 1.5 2 -8 -6 -4 -2 0 2 4 6 0
500
1000
1500
2000
2500
3000
3500 3500
PCAB -Axis1
78.9% of total variance
-2 -1 0 1 2
-2 -1.5 -1 -0.5 0 0.5 1 1.5 2
-8 -6 -4 -2 0 2 4 6
-3 -2 -1 0 1 2
PCASed -Axis1 67.8% of total variance
PCASed -Axis1 67.8% of total variance
PCAB -Axis1
78.9% of total variance
Calcite
Arboreal
Steppic Steppic Arboreal
-1000 -500 0 500 1000
Depth
Calcite Siliciclastic
Carbonate oxygen isotope
δc (s.d.u.)
Carbonate oxygen isotope
δc (s.d.u.) High E, high δp Low E, low δp
High E, high δp Low E, low δp
a e
d c
b f
Siliciclastic
-0.6
-0.4
-0.2
0.0
0.2
0.4
-1000 -500 0 1000
Lag (cm)
PCAB -Axis1 versus δc PCASed -Axis1 versus δc
500
-1000 -500 0 1000
500
Lag0: -0.48.3 Lag-80: -0.44.4
PCAB -Axis1 versus PCASed -Axis1
Lag (cm) Lag (cm)
Fig. 9. Relationships between pollen, sediment properties and isotope data. (a)PCAB-Axis 1 and PCASed-Axis 1 scores versus depth.
(b)Cross correlation between these two depth series.(c)Carbonate oxygen isotope,δc(in standard deviation units, s.d.u.) and PCAB-Axis 1
versus depth.(d)Cross correlation between these two depth series.(e)PCASed-Axis 1 andδc(in standard deviation units, s.d.u.).(f)Cross
correlation between these two depth series.
lakes. They have been attributed either to a disequilib-rium between climate and vegetation (e.g., at Lake Golhisar, Turkey, Fig. 1; Eastwood et al., 2007), or changes in precip-itation seasonality (at Lakes Zeribar and Mirabad, NW Iran, Fig. 1; Stevens et al., 2001, 2006). As discussed above from both pollen and isotope data, we favour the hypothe-sis of seasonal increased hydrological and thermal contrasts with wet cool winters, possibly a longer rainy season, and very dry warm summers generating strong evaporative ef-fects in both the drainage area and the waterbody. Due to reversed relationships between these two proxy depth-series through time, the cross-correlation for the whole record does not show narrow peak, but an overall correlation (maximum negative correlation:−44.4, with a small depth lag of 80 cm). Links between PCASed-Axis 1 andδc also vary with depth (Fig. 9e and f). These two series are clearly in antiphase dur-ing carbonate-rich intervals, but intervendur-ing periods do not show clear patterns.
5.2 Major environmental changes through time
The major environmental changes observed at Yammoˆuneh, as constrained by all analysed indicators (Figs. 5–7), are now discussed versus time (Fig. 10a–g), according to our age model. Figure 10 also displays (with independent time scales) orbital forcing expressed by eccentricity and sum-mer/winter insolation at 34◦N (Fig. 10h; Berger, 1978) and MISs reflecting global ice volume (Fig. 10i; Martinson et al., 1987).
Modern
δsw
-δP
Modern
δP
(‰ PDB)
δc
Sediment properties Paleovegetation Oxygen isotopes
0 20 40 60 80
Tree pollen ratio
-7 -9 -11 -13 -5
10
Mag. Suscep. (s.d.u.)
0 -5 -10
5
Solar radiation 34°N(W/m2)
0 5 10
a b c d e f g h i
0 2 4 Cool wet/ temperate + Med.
0 20 40 60 80%
?
?
? ? ? ?
MIS
7.5 7.1
7.3 6.1
6.6 6.3 5.1
5.5 5.3 1
2
3
4
8 Age
(ka)
0 0.025 0.05
Eccentricity 200 240 280 400
Summer
Winter
440 480
Aquatic + Palustral
40
80 60
100
120
140
160 0
20
180
200
220
240
260
%
Yammoûneh
-16 -14 -10 -8
Ca relative content (s.d.u.)
Tree pollen total (AP%)
(‰ SMOW)
∆δ18O
0
20
40
60
80
100
120
140
160
180
200
220
240
260
Age (ka)
-12
Fig. 10. Major proxies from Yammoˆuneh versus time according to our age model, and external paleoclimate data (on independent time scale). (a)Ca relative content. (b) Magnetic susceptibility. For clarity, these two proxies are plotted as the first component factor of a Singular Spectrum Analysis (performed using the Paillard et al., 1996, software) and representing 84 and 92.3 % of the total variance, respectively (s.d.u.: standard deviation units).(c)Aquatic + palustral plant pollen (percentage of total pollen grains).(d)Ratio of the pollen percentages (percentage of terrestrial pollen) of cool conifer forests/temperate to Mediterranean forests. (e)Total tree pollen percentages. (f)δc. (g)1δ18O (as in Fig. 7f).(h)Orbital eccentricity and summer/winter insolation at 34◦N (Berger, 1978);(i)MISs (Martinson et al.,
1987). Questions marks between(g)and(h)suggest links between major environmental changes at Yammoˆuneh and global climate changes.
situ carbonate production implies a substantial rise of the lo-cal shallow water table. High1δ18O values around 3250 cm (220 ka?) suggest heavy rainfall. Periods with highδcvalues may result from the18O enrichment of inflowing water due to a relatively long water residence time in the permanent wa-terbody, and/or high summer evaporation rate. We interpret this period as reflecting the highest P-E balance of the whole record. Above 3300 cm, a negative shift of aquatic-palustral plant pollen, and the opening of the vegetal cover inducing enhanced erosion and detrital input, record a slight decrease in effective moisture which remained, however, high enough to allow mountain and mixed temperate forest elements to grow. This generally wet interval apparently coincides with period of maximum insolation seasonal contrasts. Its termi-nation is not clearly identified in our record.
The period assigned to MIS 6 (∼190–130 ka) is repre-sented from ∼2950 to 1850 cm by silty clays interrupted by a marly layer around 2450 cm (∼170 ka?) and progres-sively enriched in carbonate above 2150 cm (∼150 ka?). At the base, eolian material prevailed in detrital sediment when the landscape was predominantly steppic. After ∼180 ka, cool conifer and/or temperate deciduous forests developed, aquatic vegetation reappeared, and δc shifted to reach the
lowest values of the profile toward the end of this interval. This suggests an overall increase in local efficient moisture, although1δ18O decreased possibly due to low temperature (and, thus, lowδP). This general trend is punctuated by two events. At∼2450 cm (∼170 ka?), a narrow peak of carbon-ate, an increase in marsh plant pollen, and a juniper decline in favour of deciduous oaks suggest a rise of the water ta-ble and a moderate warming. This event also shows sharpδc and1δ18O positive shifts, which may reflect an interval of amplified seasonal thermal and hydrological contrasts possi-bly coincident with high solar radiation seasonality. Above 2150 cm (∼150 ka?), junipers became dominant again under the cold conditions of late MIS 6. Even if mean annual pre-cipitation was low, the local available moisture was sufficient to sustain arboreal vegetation, wetlands around the core site and depletedδc values when low glacial temperature mini-mized evaporation and evapotranspiration.
establishment of a typical Mediterranean climate. Aquatic and hydrophilous plant pollen disappeared and a dramatic increase inδcvalues occurred, which, at a first glance, could evoke a drying. Such an interpretation disagrees with very high tree pollen percentages and a synchronous large and positive shift of1δ18O. We interpret this period as reflect-ing strong orbital-induced seasonal hydrological and ther-mal contrasts, with cool, strongly rainy winters and possibly a longer rainy season, but very warm, dry summers induc-ing relatively low mean annual effective moisture inhibitinduc-ing the growth of mountain and temperate trees. MIS 5.5 coin-cides with a major change in Yammoˆuneh environments: af-ter 130 ka, the cool-wet conditions of MIS 7 and late MIS 6 never appeared again.
From∼120 to∼80–75 ka, finely banded olive gray silty clay prevailed. Grain-size and colour gradients in each band evoke episodic runoff events followed by quiet decantation periods. The detrital accumulation is interrupted by an in-terval enriched in carbonate around 1500 cm (∼105 ka) and passes progressively to a light gray marl above 1200 cm (∼85 ka). Open vegetation tends to replace forested land-scapes, but this trend is not linear. Peaks of mixed arboreal pollen coincide with carbonate-enriched phases, and reflect wetter conditions than during intervening steppe intervals. These peaks are synchronous with sharpδcenrichments and
1δ18O increases. The last one resembles MIS 5.5 in its min-eral composition and isotope pattern. These two peaks are attributed to MIS 5.3 and MIS 5.1, respectively, although the later is slightly too young in our time scale.
During the last glacial period, MIS 4, 3 and early MIS 2 (∼970–225 cm,∼75–16 ka), olive gray clay first dominates and the maximum contribution of eolian dust to sedimen-tation appears around 900 cm (∼70–65 ka). At ∼425 cm (∼40 ka?), the greenish clay passes abruptly to strongly ox-idized ocher, reddish clayey silt which contains limestone gravels and carbonate concretions suggesting frequent des-iccations at the core site. An increase in carbonate content, mainly detrital, is attributed to physical erosion of the water-shed limestones in an environment almost devoid of vegeta-tion. Pollen data clearly show a shift toward steppic-desertic environments consistent with theδcincrease, interrupted by two moderate humid pulses (around 730 and 500 cm; ∼60 and 45 ka?). The local water availability reached the mini-mum of the whole record between∼21 to 16 ka (LGM and Termination 1; MIS 2). Karstic groundwater circulation was considerably reduced. This does not necessarily mean ex-tremely low regional precipitation, but may reflect water stor-age in Mt Lebanon glaciers and permafrost in the Mna¨ıtra plateau when temperature was at least 10◦C lower than to-day. Indeed, permanent glaciers, evidenced by moraines above 2000 m a.s.l. on the western flank of Mt Lebanon, oc-curred during the LGM (L. Benedetti, personal communica-tion, 2011). The last glacial stage clearly differs from MIS 6 in its trend towards local arid conditions.
After ∼16 ka, the post glacial warming is associated with the rapid re-establishment of humid conditions in the Yammoˆuneh basin, in response to ice melting and enhanced precipitation. This wetting is evidenced by, successively, a step-wise decrease in δc from 16 to 8.5 ka (Develle et al., 2010), the abrupt development of deciduous oaks around 13 ka, and the deposition of a white lacustrine marl rich in rests of aquatic organisms after 11.5 ka. The wetting optimum is reached from∼11 to 8.5 ka, in phase with S1. In the core, the Holocene is truncated at∼7.5 ka, but a trend toward aridity starting at∼7 ka is registered by the isotope record in trench TR02 (Develle et al., 2010). This early Holocene wetting was shown at other sites from Lebanon (see site location in Fig. 1) by changes in growth rate,δ18O andδ13C in a 12 ka speleothem from Jeita Cave (Verheyden et al., 2008), and by the∼15 ka-pollen records from the Aammish marsh in the Bakka Plain (Hajar et al., 2008, 2010). Pollen data from the Ghab Valley, Syria (Yasuda et al., 2000) show similar trends.
6 Discussion and conclusions
The Yammoˆuneh record represents the first long multi-proxy paleoenvironmental-paleoclimatic reconstruction based on a single sedimentary sequence and on both biotic and hydro-logical indicators in the Levant. The combination of pollen, sediment properties and isotope data allowed us to cross-check the information derived from independent proxies and to strengthen the overall interpretation of paleoenvironmen-tal changes. This record covers three Interglacials and two full glacial stages. It fills a geographical gap in data cover-age as no other long record is available in northern Levant. Main environmental characteristics of the Yammoˆuneh basin during interglacial peaks and glacial periods can be drawn as follows.
6.1 Main characteristics of interglacial and glacial
stages at Yammo ˆuneh
interglacial maximums differ significantly: very wet and cool conditions prevailed during the MIS 7 peaks; MIS 5.5 is characterised by typical Mediterranean environments with very wet winter and warm evaporative summer conditions, whereas a more temperate wet climate established during early MIS 1.
Glacial periods, characterised by the dominance of coloured silty clay in the sediments, exhibit the highest weight percentages of wind-blown particles, indicating a strong contribution of eolian dust to sedimentation. Forest vegetation cover was generally reduced compared to inter-glacial stages, favouring local erosion. Environmental con-ditions evolved, however, in opposite directions during the penultimate and the Last Glacial period. All proxy data re-veal an overall wetting during MIS 6 culminating toward the end of this stage, while a drying trend took place during MIS4-2, leading to extremely harsh LGM conditions. We suggest that, under the very cold LGM climate, water was stored by ice in frozen soils in the Yammoˆuneh depression and in glaciers in the aquifer recharge zone, resulting in ex-tremely low local liquid water availability. As for successive Interglacials, the glacial stages were not identical.
Our record shows an overall decrease in local available water: episodes of maximum moisture occurred during early-mid MIS 7; MIS 6 was wetter than the late glacial stage; the amplitude of wet pulses decreased from MIS 5.5 to the early Holocene. The basin infilling by lake sediments might explain the almost total disappearance of permanent water-bodies after 130 ka and frequent desiccation periods during MIS 2, but not changes in terrestrial vegetation. The long-term aridity trend coincides with a weakening of the seasonal insolation contrasts linked to the decreasing amplitude of the eccentricity cycle. It is as though the Yammoˆuneh water balance was partly controlled by the amplitude of the sea-sonal insolation contrast and the relative intensity of winter cooling.
6.2 Comparison with other EMS records
Placed in its regional context, the Yammoˆuneh record sug-gests similarities and differences with other records from the EMS region and raises a series of questions on the un-derlying mechanisms. Some key regional records are illus-trated in Fig. 11, which also displays two proxy curves from Yammoˆuneh for comparison. Sites cited below are located in Fig. 1.
The Yammoˆuneh evolution generally agrees with data from northeastern Mediterranean and NW Iran, except dur-ing MIS 6. This is exemplified (Fig. 11a–c) by pollen records from Albania (L. Ohrid, L´ezine et al., 2010), Greece (Tenaghi Philippon, Tzedakis et al., 2006) to NW Iran (L. Ur-mia, Djamali et al., 2008). During glacial periods, steppe landscapes took place under cool, dry conditions. Nev-ertheless, several east Mediterranean lakes (e.g., Konya in Turkey, L. Urmia) have experienced relatively high level
stands attributed to substantial temperature lowering reduc-ing evaporation loss and enhanced runoff when an open veg-etation cover prevailed (Roberts et al., 1999; Djamali et al., 2008). During interglacial peaks, maximum tree pollen per-centages reflect warm conditions and higher precipitation from the mid-latitude westerly system. Changes in seasonal-ity were proposed by several authors to explain Holocene cli-mate in the region (Stevens et al., 2001, 2006; Magny, 2007; Tzedakis, 2007; Peyron et al., 2010; Djamali et al., 2010). At Yammoˆuneh, sharpδc increases in phase with arboreal pollen peaks, attributed to enhanced seasonal thermal and hy-drological contrasts, suggest that the hypothesis of seasonal changes is valid for older interglacial stages (e.g., MIS 5.5 and MIS 5.1). The specific case of Lake Ohrid, a mountain-ous karstic lake, is interesting to compare with Yammoˆuneh: authigenic calcite precipitated during warm phases, when the karstic system was active and forests developed in the catch-ment area, while detrital siliciclastic particles accumulated and forests are replaced by steppic landscapes during the last glacial period due to strong deficits in available water stored as ice in the mountains (L´ezine et al., 2010).
f e
d
a b g
Age 40 80 60 100 120 140 160 0 20 180 200 220 240 260 c N. African runoff mm/day
0 1 2
h NE Mediterranean MIS Age (ka) 40 80 60 100 120 140 160 0 20 180 200 220 240 260 7.5 7.1 7.3 6.1 6.6 6.3 5.1 5.5 5.3 1 2 3 4 8 Hiatus i T. Philippon 0 50
(ka) 0 50
Urmia Tree pollen %
Calcite %
0 50 100
Ohrid
0 50
Tree pollen % Tree pollen %
NW Iran k j Negev T ravertines Speleothems
Dead Sea basin
500400300 200
Dead Sea L. Lisan L. Samra L. Amora Lake Level
(m b.s.l.)
Relative frequencies of ages Speleothems W. Israel speleothems -2
Soreq C.
Peqi'in C. -4 -6 -8 δ18O PDB ‰
EMS Sapropels S9 S5 S8 S6 S4 S1 S3 S7 0 20 40 60 80 %
-16 -14 -10
O (‰ SMOW)
∆δ18
-12 N Lebanon
Tree pollen %
l m
Yammoûneh
? ?
? ?
Fig. 11. Environmental changes in the eastern Mediterranean region. (a)–(c)Tree pollen percentages in sediments froma): Lake Ohrid, Albania (L´ezine et al., 2010);(b)Tenaghi Philippon, Macedonia (Tzedakis et al., 2006);(c)Lake Urmia, NW Iran (Djamali et al., 2008). (d)–(e)Yammoˆuneh proxy data.(d)Tree pollen percentages (as Fig. 10e);(e)1δ18O: (as Fig. 10g).(f)δ18O record from Soreq and Peqi’in Caves speleothems, western Israel (Bar-Matthews et al., 2003).(g)Lake level fluctuations of the Dead Sea and its predecessors (Waldmann et al., 2010). (h)Relative frequency of ages of speleothem deposition in the Dead Sea basin (Lisker et al., 2010).(i)Relative frequency of ages of speleothem deposition in the Negev (Vaks et al., 2010).(j)Periods of travertine deposition deposition in the Arava valley (Waldmann et al., 2010). (k)EMS sapropel events (Ziegler et al., 2010). (l)Simulated North African runoff to the eastern Mediterranean basin as an indicator of African monsoon (Ziegler et al., 2010). Results from the CLIMBER-2 model using orbital forcing only (black curve), orbital forcing + varying NH ice sheets and greenhouse gas concentrations (red curve).(m)MISs (Martinson et al., 1987).
correspond to these Soreq-EMS climatic changes. Keep-ing in mind that the tropical influence of the Nile River ex-tent as north as Cyprus in the Levantine basin during MIS 3 and MIS 1 (Almogi-Labin et al., 2009), an indirect tropi-cal influence superimposed to the dominant role of the North Atlantic-Mediterranean system might have reached the west-ern Levant by times. A potential impact on this region of the remote Eurasian ice sheet, much larger at 160–130 ka than during the LGM, and of the resulting huge proglacial lakes over central Europe (Svenden et al., 2004; Mangerud et al., 2004) might also be considered.
At the northern limits of the Saharan-Arabian desert, in Negev and the Arava Valley, sporadic events of deposition of speleothems (Vaks et al., 2010; Fig. 11i) and travertine (Waldmann et al., 2010: Fig. 11j) indicate episodes of en-hanced effective precipitation in phases with periods of inten-sified monsoon, schematized by simulated changes in North African river discharge to the EMS and related EMS sapro-pel events (Fig. 11k and l; Ziegler et al., 2010). These short wet pulses have suggested intrusions of humidity from southern sources during interglacial periods (Waldmann et
al., 2010), or simultaneous intensification of monsoon and Atlantic-Mediterranean cyclones (Vaks et al., 2010).