Strand-Specific RNA-Seq Analyses of Fruiting Body Development in Coprinopsis cinerea.
Texto
Imagem

Documentos relacionados
Relative gene expression for all six genes measured by RT-qPCR was compared with RNA-Seq data on days 2 and 5 for the July experiment.. In the first comparison relative expression
organization; P:cellular process; P:nucleobase, nucleoside, nucleotide and nucleic acid metabolic process; P:catabolic process; P:response to abiotic stimulus; F:hydrolase
It should be clear but worth emphasizing that when using a numerical measure to identify stably expressed genes, the outcome depends on multiple factors: the background sample set
In the present study, we used large quantities of messenger RNA (mRNA)-seq and microRNA (miRNA)- seq data in GC patients in The Cancer Genome Atlas (TCGA) database to screen
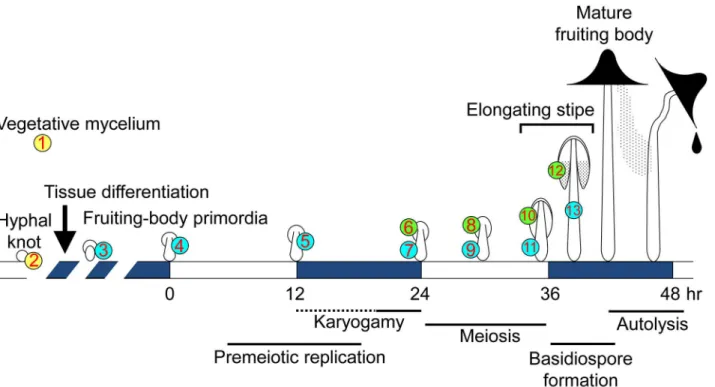
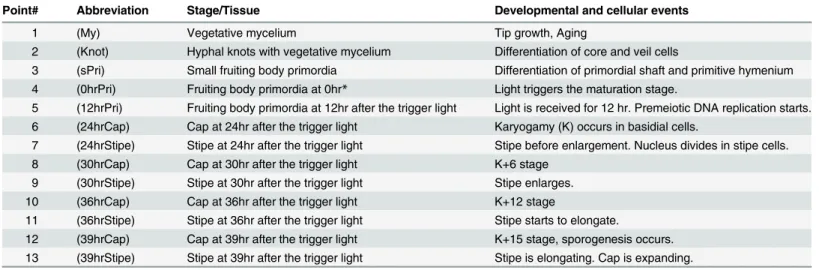
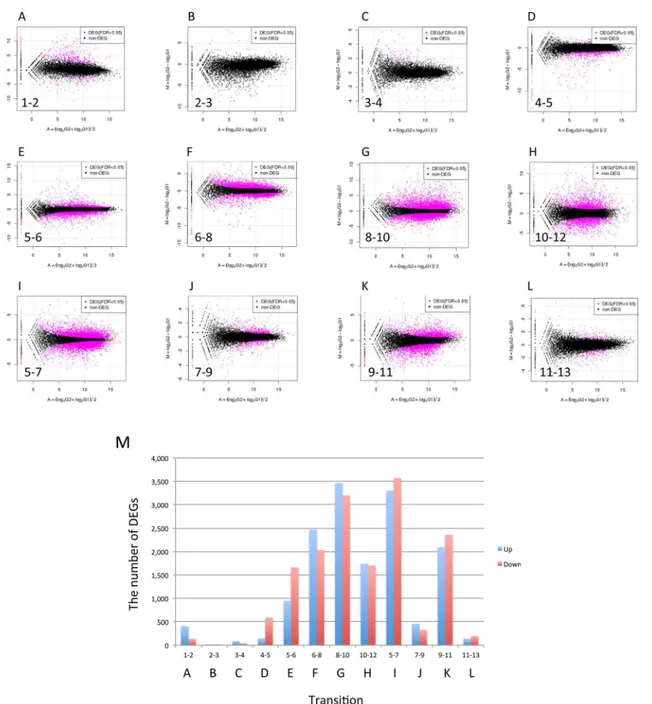
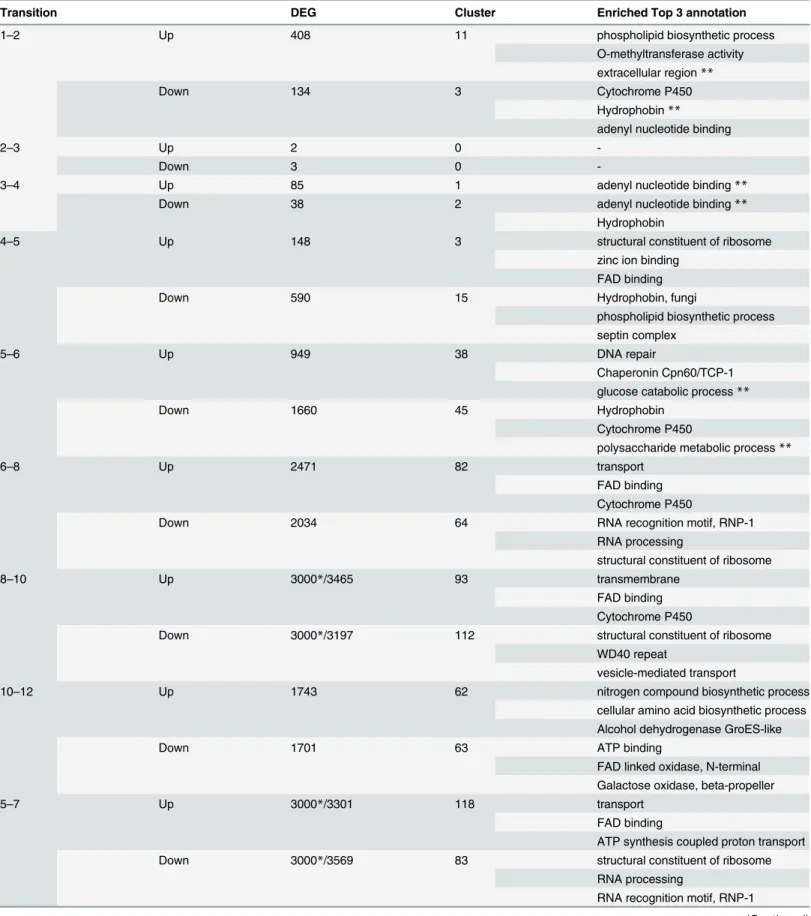
RNA-Seq analysis and identification of differentially expressed genes (DEGs) - We performed RNA-Seq anal- yses to evaluate spatiotemporal gene expression profiles along
Nonparanormal transformation resulted in the best classification performance by far on Dataset 1 ( Fig. 4 ), with a mean total accuracy of .85 and mean Kappa of .78 for
Para os resultados da idade equivalente para TGMD-2, do Subteste Controlo de Objetos, existem diferenças significativas entre as crianças com e sem experiência aquática (p
GSEA enrichment and FDR values for functional groups defined in [12] using RNA-seq data time series data for trypanosomes generated from treatment with I-BET151. for 3,6,12,24,
