www.nat-hazards-earth-syst-sci.net/14/1565/2014/ doi:10.5194/nhess-14-1565-2014
© Author(s) 2014. CC Attribution 3.0 License.
Spatio-temporal patterns of recent and future climate extremes in
the eastern Mediterranean and Middle East region
E. Kostopoulou1, C. Giannakopoulos2, M. Hatzaki2, A. Karali2, P. Hadjinicolaou3, J. Lelieveld3, and M. A. Lange3
1University of the Aegean, Department of Geography, Mytilene, Greece
2Institute for Environmental Research and Sustainable Development, National Observatory of Athens, Athens, Greece 3Energy, Environment and Water Research Center, The Cyprus Institute, Nicosia, Cyprus
Correspondence to:E. Kostopoulou ([email protected])
Received: 2 August 2013 – Published in Nat. Hazards Earth Syst. Sci. Discuss.: 4 September 2013 Revised: 11 March 2014 – Accepted: 11 May 2014 – Published: 23 June 2014
Abstract.Recent and future changes in temperature and pre-cipitation climate extremes are estimated using the Hadley Centre PRECIS (“Providing REgional Climates for Impacts Studies”) climate model for the eastern Mediterranean and Middle East region. The area of interest is considered vul-nerable to extreme climate events as there is evidence for a temperature rise while precipitation tends to decline, sug-gesting likely effects on vital socioeconomic sectors in the region. Observations have been obtained for the recent pe-riod (1961–1990) and used to evaluate the model output. The spatial distribution of recent temporal trends in temperature indicates strong increasing in minimum temperature over the eastern Balkan Peninsula, Turkey and the Arabian Penin-sula. The rate of warming reaches 0.4–0.5◦C decade−1 in a large part of the domain, while warming is expected to be strongest in summer (0.6–0.7◦C decade−1) in the east-ern Balkans and westeast-ern Turkey. The trends in annual and summer maximum temperature are estimated at approxi-mately 0.5 and 0.6◦C decade−1 respectively. Recent esti-mates do not indicate statistically significant trends in pre-cipitation except for individual sub-regions. Results indi-cate a future warming trend for the study area over the last 30 years of the 21st century. Trends are estimated to be positive and statistically significant in nearly the entire re-gion. The annual trend patterns for both minimum and maxi-mum temperature show warming rates of approximately 0.4– 0.6◦C decade−1, with pronounced warming over the
Mid-dle Eastern countries. Summer temperatures reveal a gradual warming (0.5–0.9◦C decade−1) over much of the region. The model projects drying trends by 5–30 % in annual precipita-tion towards the end of the 21st century, with the number of
wet days decreasing at the rate of 10–30 days year−1, while heavy precipitation is likely to decrease in the high-elevation areas by 15 days year−1.
1 Introduction
and reduced precipitation (IPCC, 2007; Giorgi and Lionello, 2008; Sheffield and Wood, 2008). Arnell (2004) showed that the countries most prone to increasing water stress are lo-cated around the Mediterranean and the Middle East. Precip-itation in the Mediterranean is scarce and irregular in many southern areas, and there is a significant risk of much drier future climate conditions (Lionello et al., 2012). Overall, a warming tendency for the Mediterranean has been reported (Brunet et al., 2007; Brunetti et al., 2009) which is pro-nounced in summer, while several locations do not show a significant trend in winter (Ulbrich et al., 2012). Regarding present changes in temperature, Lionello et al. (2012) pre-sented statistically significant positive trends for large parts of the Mediterranean in summer and particularly in its central part in spring. In the Middle East, climate change coupled with population growth is likely to reduce per capita water resources considerably, resulting in major social, economic and environmental changes (Chenoweth et al., 2011). Ac-cording to the Fourth IPCC report (2007), “confidence has in-creased that some extremes will become more frequent, more widespread and/or more intense during the 21st century”. In recent years, temperature- and precipitation-associated ex-treme events are studied through the use of indices mainly based on percentiles and/or fixed absolute thresholds (Klein Tank et al., 2009; Zwiers et al., 2013). There are relatively few studies relating to climate extremes for this part of the world due to data unavailability. The climate data restrictions result in local-scale studies which are limited to the use of point-data series. More studies can be found in the literature for the western part of our study region (Kostopoulou and Jones, 2005; Giannakopoulos et al., 2010; Kuglitsch et al., 2010; Hadjinicolaou et al., 2011). For instance, Kostopoulou and Jones (2005) studied possible changes in temperature-and precipitation-related climate extremes over the eastern Mediterranean region for the period 1958–2000. The most significant temperature trends were revealed for summer, where both minimum and maximum temperature extremes show statistically significant warming trends. Precipitation indices revealed regional contrasts, with larger precipitation total amounts and increases in intense rainfall events in cen-tral Mediterranean, and trends indicating drier conditions in the eastern and southern parts of the Mediterranean. Rele-vant studies have also shown that the Mediterranean area tends to experience a warmer climate with less total pre-cipitation but with positive trends in intense daily precipi-tation (Goubanova and Li, 2007; Nastos and Zerefos, 2008). In a recent work, Unkaševi´c and Toši´c (2013) analysed ex-treme temperature indices at 15 stations in Serbia (for the period 1949–2009). They found that the climate conditions became warmer in the last 61 years, and in agreement with Kostopoulou and Jones (2005) the most significant temper-ature trends were revealed for the summer season. Efthymi-adis et al. (2011) used daily gridded data sets to detect trends in Mediterranean temperature extremes since the mid-20th century. The estimated trends were generally consistent with
the global trends, showing a decrease in cold extremes and increase in warm/hot extremes. Kuglitsch et al. (2010) have shown increases in the number, intensity and length of heat waves in the eastern Mediterranean. Regarding future pro-jections, Lelieveld et al. (2013) suggested that the annual number of heat wave days may increase drastically by the end of 21st century in the EMME, and the atmospheric con-ditions in the region would become conducive for photo-chemical air pollution. Zhang et al. (2005) examined trends in extreme temperature and precipitation indices at 52 sta-tions from 15 countries in the Middle East region for the period 1950–2003. They found significant reductions in the number of cold days and increases in daily maximum and minimum temperature. Tayanç et al. (2009) showed a sig-nificant warming trend in southern and southeastern parts of Turkey for the period 1950–2004. Significant decreases in precipitation were found in the western parts of the coun-try, although the variability of precipitation was substantially different across urban and rural areas, suggesting that urban stations can experience more frequent and severe droughts and floods. Fewer studies on changes in climate extremes can be found for areas further east, mainly due to the poor data network and limited access to long daily data sets re-quired for such analyses. Recently, Almazroui et al. (2014) used daily observations from 27 stations from Saudi Arabia, with high-quality data for the period 1981–2010, to calcu-late climate indices and show that the temperature extremes in the region have significantly increased with larger rates in the recent past (1996–2010) compared to a previous period (1981–1995).
Within the framework of the CIMME (Climate Change and Impacts in the Eastern Mediterranean and Mid-dle East, www.cyi.ac.cy/completed-research-projects-clima/item/201-cimme-climate-change-and-impacts) project (Lelieveld et al., 2012), the PRECIS (Providing REgional Climates for Impacts Studies, Jones et al., 2004) RCM is run over the EMME region. The results of the project are summarised in a comprehensive regional climate assessment for the EMME region (Lelieveld et al., 2012). The study presented the natural climate variability during the past 500 years based on natural proxies and documentary and analysed the climatology of the recent past. In addition, based on the output of the RCM the study projected increases for night-time and daytime temperatures particularly during summer, combined with a general drying tendency.
is to investigate whether the 21st century changes tend to occur in a more rapid rate than during the 20th century, to identify regions in the study area that seem to undergo large amount of climate change, and provide information to policy-makers to develop management strategies for sectors which are likely to be impacted by the change, such as electricity demand, tourism and freshwater resources.
2 Data and methodology 2.1 Model data
The Hadley Centre PRECIS regional climate model is an at-mospheric and land surface model designed to provide de-tailed climate scenarios at a maximum resolution of 25 km, which is easy to use and computationally inexpensive (Jones et al., 2004). Dynamical flow, the atmospheric sulfur cycle, clouds and precipitation, radiative processes, the land surface and the deep soil are all described. Boundary conditions are required at the limits of the model’s domain to provide the meteorological forcing for the RCM (for a detailed descrip-tion of the model see the PRECIS Handbook, Jones et al., 2004). This study uses daily temperature and precipitation projections from only one climate model, the Hadley Cen-tre PRECIS regional climate model (driven by HadCM3P, Collins et al., 2005). This model output was preferred as it is run with a focus on the region of study. The area of interest extends from 22◦to 46◦N and from 10◦to 62◦E, covering a large portion of the EMME region. The model simulations were performed at the Cyprus Institute within the framework of the CIMME project which studied “Climate Change and Impacts in the Eastern Mediterranean and Middle East”.
The analysis of the present study focuses on two periods to describe present and future states of the climate for the study region. We use the classical 30-year reference period of 1961–1990 to define the “present-day”, whereas we de-fine as “future” the time period from 2070–2099. Lelieveld et al. (2012) compared monthly CRU (TS3.0, http://badc.nerc. ac.uk/data/cru/) (Mitchell and Jones, 2005) averages with PRECIS and showed that the model realistically reproduces climatic patterns and indices of extremes. In the current study, the model results are evaluated against observational data sets.
2.2 Methodological approach
As an initial step, we evaluate the performance of the model by comparing model-simulated temperature and precipita-tion with daily observaprecipita-tions for the reference period 1961– 1990. The station data are available only from sites located on the western half of the EMME region. We present a se-lection of 14 stations located in the Balkan Peninsula and Turkey at various altitudes. We combine the annual cycles of temperature and precipitation to examine the skill of the model to represent the observed regional climatological
char-acteristics. The temperature annual cycle was calculated by using a 3-day time window centred on the calendar day. Then, the output was smoothed using a cubic smoothing spline algorithm (Chambers and Hastie, 1992). The precip-itation annual cycle was examined for each station by calcu-lating the 30-year mean value for each calendar day over the reference period and then applying the smoothing algorithm. Subsequently, we construct estimates of the density func-tion from each pair (of observed and model time series) of the examined climate variables using the non-parametric kernel density function (further details of the Kernel density esti-mator can be found in Silverman, 1986). Kernel estiesti-mators centre a kernel function at each data point and then smooth out the contribution of every each data point over a local neighbourhood of that data point. A density estimate of the smoothed contributions provides information about the struc-ture of the data and other related feastruc-tures such as skewness (Silverman, 1986), and hence it can be used as an alternative way to determine similarity between the compared series. An important parameter in the kernel estimator is the smoothing parameter or bandwidth,h. The choice of bandwidth is
cru-cial as a large value will lead to an oversmoothing density function estimate, while a small value will produce a very ragged density with many spikes at the observations. We use
h=1.5 chosen by Silverman’s rule of thumb for bandwidth
selection. We further analyse the time series of daily min-imum, maximum temperature and precipitation for the two time slices (present and future).
A linear least squares fit to the temperature and precipita-tion time series is used to identify temporal trends in these variables over the 30-year periods, which demonstrate re-gional differentiations in the rates of change. To gain an in-sight into the perspective changes in climate extreme con-ditions in the EMME region, climate indices are calculated and expressed as the number of days on which a temper-ature or precipitation value falls above or below a certain threshold. The indices are defined by the Expert Team on Climate Change Detection and Indices (ETCCDI, Karl et al., 1999; Peterson, 2005; Klein Tank et al., 2009). In par-ticular, the warming conditions are expressed by the num-ber of “warm” days, which defines the annual count of days with TX>25◦C; the number of “hot” days are defined as
those with TX>35◦C, and the number of “tropical” nights
are days per year with TN>20◦C. The number of frost
nights are defined by days with TN<0◦C. Regarding
pre-cipitation we use the average number of days (number of wet days) with RR>1.0 mm, and heavy precipitation is
de-fined by the annual number of days with RR>10 mm (a
Hirsch, 1992). The significance level of 5 % is used to indi-cate statistically significant trends.
3 Results
3.1 Model evaluation
Randall et al. (2007) state that the better a model simu-lates the seasonal cycle of present climate the more confi-dence there is in its ability to represent the most important physical processes, and predict long-term climatic changes. Hence, the representation of temperature and precipitation annual cycles by PRECIS was examined for each station by calculating the mean value for each calendar day over the reference period. We have used a 3-day window cen-tred on the calendar day to estimate the daily maximum and minimum temperature for every day and these estimates are used to calculate the long-term average value for the day. We then applied a smoothing spline to the annual cycle of TX and TN of the 14 representative stations and the re-sults are shown in Fig. 1. In general, the average TX and TN seasonal cycles are well represented, with the observa-tions defining the ability of the model to simulate a reason-able seasonal cycle in most stations. However, in some cases the amplitude of the temperature annual cycle as produced by the model is larger compared to the observed annual cycle, with higher maximum temperatures during summer-time (e.g. Kneja, Bucharest, Izmir, Belgrade) and lower min-imum temperatures during the winter months (e.g. Athens, Bucharest Izmir, Nis). These are particularly noticeable in continental and high elevation stations and are possibly re-lated to local effects (e.g. pronounced surface topography). The comparison of the smoothed precipitation annual cycle with the observational cycle indicates that the model gener-ally reproduces the wet/dry seasonal precipitation distribu-tion in most cases. However, the observed seasonal cycle of precipitation is not accurately simulated by the model for every station. Our results demonstrate a systematic under-estimation of the model simulated summer precipitation in stations characterised by continental climates (e.g. Zagreb, Novo Mesto). In contrast, the model is found to overesti-mate precipitation, mainly during spring, in other stations (e.g. Sarajevo, Kneja).
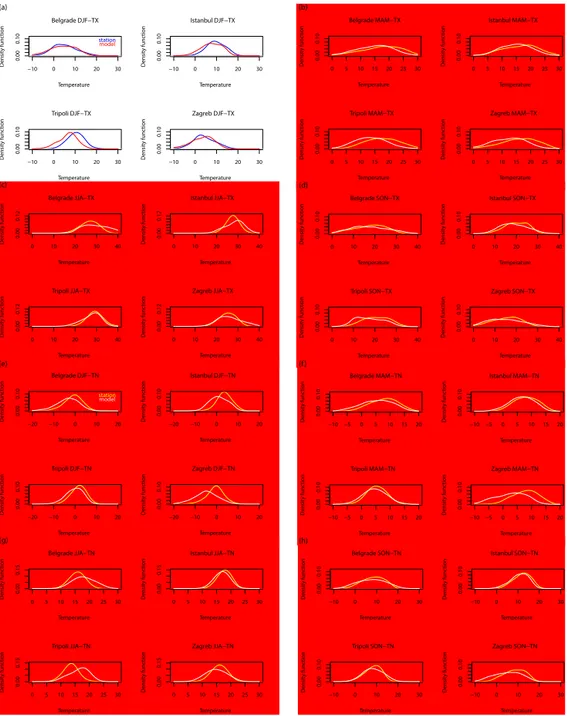
Subsequently, kernel density estimations were constructed on a seasonal scale, for every pair of observed/modelled data sets at every station, and used for the evaluation of the mod-elled temperature. Figure 2 presents the results of the normal kernel function with a 1.5◦C bandwidth, which were used to develop smooth histograms of seasonal maximum (TX) and minimum (TN) temperature, using observed (blue colour) and modelled (red) data, in four representative stations. TX is slightly better estimated than TN, except for the station of Tripoli (elevation: 651 m), where the model is seen to under-estimate the variable in winter, spring and summer. In
con-trast, summer TX is overestimated by the model in Istanbul. Regarding TN, the kernel estimates have shown that model underestimates TN in many cases, except for the summer TN in the stations of Belgrade and Tripoli. In the following sec-tions we present model simulasec-tions of the present climate and projections of future climate change for the end of the 21st century. Hence, the evaluation of the model provides basic evidence of the accuracy of the model results and the related uncertainties.
3.2 Model simulation of present-day climate
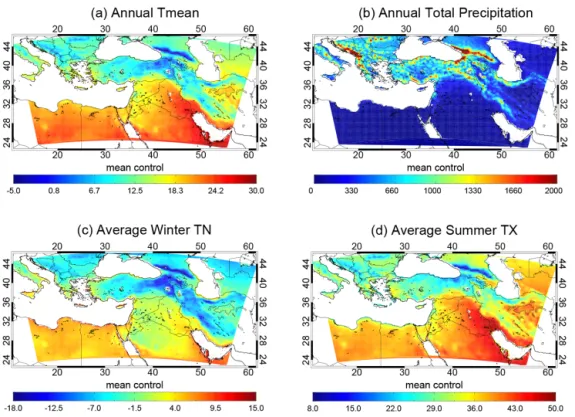
The mean temperature and precipitation patterns over the EMME region during the control period 1961–1990 are pre-sented in Fig. 3. The spatial patterns of the 30-year mean conditions can provide an indication of the gradients in tem-perature and precipitation patterns from the northern to the southern parts of the EMME region. According to the model simulations, the annual mean temperature ranges from 0◦C in mountainous areas to 10–15◦C in most parts of the north-ern Mediterranean region. The southnorth-ern part of the region, i.e. North Africa and the Middle East, shows the warmer temperature pattern with averages in the range of 18–28◦C. Precipitation within sub-regions varies considerably, with an-nual totals ranging from over 1500 mm in the humid north (western Balkans, northwestern Turkey), to approximately 500 mm in Mediterranean lowlands (southern Balkans, west-ern Turkey) and to less than 200 mm in the arid south (Ara-bian Peninsula). Highly elevated areas receive large precipi-tation amounts indicating the predominant influence of orog-raphy on the spatial distribution of rainfall. The average pat-terns in relation to extreme temperature conditions are in-vestigated based on the spatial distribution of winter TN and summer TX patterns. The winter average TN reach values as low as−10◦C in the mountainous areas and around 0◦C in continental parts north of 38◦N latitude. In southern Europe winter TN ranges from−5 to 10◦C, while further south it approximates 10◦C. The temperature contrasts between the northern and southern EMME sub-regions are particularly evident in the average summer TX, which ranges between 22 and 30◦C in the north, while further east and south it exceeds 40◦C.
0 10 20 30 40 Sarajevo (BA) 0 10 20 30 40 Zenica (BA) 0 10 20 30 40 Kneja (BG) 0 10 20 30 40
TX / TN (
o C) Zagreb (HR)
0 10 20 30 40 Athens (GR) 0 10 20 30 40 Ioannina (GR)
J F M A M J J A S O N D 0 10 20 30 40 Tripoli (GR) 0 10 20 30 40
Bucharest (RO) Station
Precis 0 10 20 30 40
Novo Mesto (SI)
0 10 20 30 40 Edirne (TR) 0 10 20 30 40 Istanbul (TR) 0 10 20 30 40 Izmir (TR) 0 10 20 30 40 Belgrade (RS)
J F M A M J J A S O N D 0 10 20 30 40 Nis (RS) 0 2 4 6 8 10 Sarajevo (BA) 0 2 4 6 8 10 Zenica (BA) 0 2 4 6 8 10 Kneja (BG) 0 2 4 6 8 10
RR (mm)
Zagreb (HR) 0 2 4 6 8 10 Athens (GR) 0 2 4 6 8 10 Ioannina (GR)
J F M A M J J A S O N D 0 2 4 6 8 10 Tripoli (GR) 0 2 4 6 8 10
Bucharest (RO) Station
Precis 0 2 4 6 8 10
Novo Mesto (SI)
0 2 4 6 8 10 Edirne (TR) 0 2 4 6 8 10 Istanbul (TR) 0 2 4 6 8 10 Izmir (TR) 0 2 4 6 8 10 Belgrade (RS)
J F M A M J J A S O N D 0 2 4 6 8 10 Nis (RS) (a) (b)
Figure 1.Temperature (1st and 2nd panels) and precipitation (3rd and 4th panels) annual cycle at 14 examined stations, as represented by station (black line) and model (red line) data. In temperature diagrams, the upper (lower) pair of lines represent maximum (minimum) temperature.
shown). Regarding winter TN positive and statistical sig-nificant trends are only found over Italy and the western Balkans, while during autumn positive and statistical signif-icant trends are detected mainly over the southern parts of EMME, which have reached up to 1◦C decade−1in the cen-tral Arabian Peninsula. It is noteworthy that statistically sig-nificant trends are found over most of the study region during spring and summer seasons. Strong positive trends in spring and summer TN are found over the eastern Balkan Peninsula, Turkey and the Arabian Peninsula. During summer, trends between 0.6 and 0.7◦C decade−1 are found in the eastern
Balkans and western Turkey, while the most prominent TN warming trends are seen in spring at a rate of about 0.7– 0.8◦C decade−1. Regarding TX, positive trends are found
in the western half of the study region in winter and over the most of the region in spring and summer. However, the trends are found to be statistically significant over large parts of the domain in the spring and summer patterns. The over-all strongest warming over the reference period is found for spring TX reaching up to 0.9◦C decade−1mainly occurred in the southern Balkans and Turkey, while, the trends in summer TX are estimated at approximately 0.5 and 0.6◦C decade−1 especially in the eastern Balkans and western Turkey. The model results do not show an overall statistically significant trend in seasonal precipitation during the reference period, except for individual sub-regions. For instance, note the in-creased winter and autumn precipitation over Iran, which is due to the Zagros mountain effect on the spatial distri-bution of precipitation in the colder seasons more than the warmer period (Alijani, 2008). Moreover, it is worth not-ing the statistically significant decreasnot-ing trends (approx. 30– 50 mm decade−1) at the amount of spring precipitation in the central Balkans and the eastern Mediterranean region.
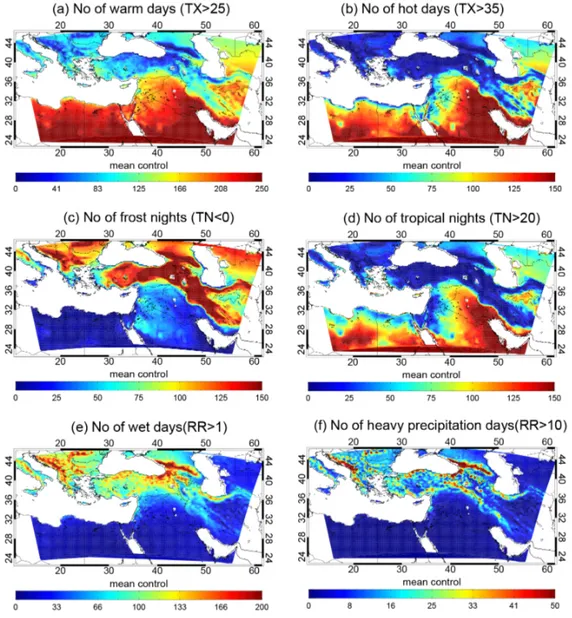
The geographical patterns of the mean of the selected in-dices for the reference period, based on PRECIS output, are presented in Fig. 5. Between the north and south of the EMME there is a considerable difference in temperature, which is evident in the number of warm and hot days. The annual average number of days with TX exceeding 25◦C ranges from one month (in elevated areas) to three months in the northern EMME, while in the south two-thirds of the year can be considered as warm days. This is the effect of the absolute threshold used and allows us to depict the tempera-ture gradient in the area of study. Moreover, hot days occur at a maximum 30–50 days year−1in low elevation areas of
the north and less than a month in areas of higher altitudes. In the southern EMME, days with temperature>35◦C are
common, occurring in up to five months a year (Gulf region). In contrast, continental (above 36◦N) and high-altitude areas (across the Taurus and Zagros Mountains) experience up to 150 frost days year−1, while in the south the annual num-ber of frost days does not exceed 20 days year−1. Further, tropical nights (TN>25◦C) are rare (up to a month year−1)
in the northern EMME, whereas in the south occur typi-cally 1–2 months and more than 3 months year−1around the Persian Gulf. The north–south contrast becomes most ev-ident from the precipitation indices patterns. Precipitation is typically heavier on the western slopes of the moun-tain ranges, while precipitation amounts decrease rapidly with latitude in the semi-arid southern EMME. The num-ber of wet days (RR>1 mm day−1) during the reference
pe-riod ranges from 200 days year−1 in high altitudes and
−10 0 10 20 30 0.00 0.10 Belgrade DJF−TX Temperature Density function station model
−10 0 10 20 30
0.00
0.10
Istanbul DJF−TX
Temperature
Density function
−10 0 10 20 30
0.00
0.10
Tripoli DJF−TX
Temperature
Density function
−10 0 10 20 30
0.00
0.10
Zagreb DJF−TX
Temperature
Density function
0 5 10 15 20 25 30
0.00
0.10
Belgrade MAM−TX
Temperature
Density function
0 5 10 15 20 25 30
0.00
0.10
Istanbul MAM−TX
Temperature
Density function
0 5 10 15 20 25 30
0.00
0.10
Tripoli MAM−TX
Temperature
Density function
0 5 10 15 20 25 30
0.00
0.10
Zagreb MAM−TX
Temperature
Density function
0 10 20 30 40
0.00
0.12
Belgrade JJA−TX
Temperature
Density function 0 10 20 30 40
0.00
0.12
Istanbul JJA−TX
Temperature
Density function
0 10 20 30 40
0.00
0.12
Tripoli JJA−TX
Temperature
Density function
0 10 20 30 40
0.00
0.12
Zagreb JJA−TX
Temperature
Density function
0 10 20 30 40
0.00
0.10
Belgrade SON−TX
Temperature
Density function
0 10 20 30 40
0.00
0.10
Istanbul SON−TX
Temperature
Density function
0 10 20 30 40
0.00
0.10
Tripoli SON−TX
Temperature
Density function
0 10 20 30 40
0.00
0.10
Zagreb SON−TX
Temperature
Density function
−20 −10 0 10 20
0.00 0.10 Belgrade DJF−TN Temperature Density function station model
−20 −10 0 10 20
0.00
0.10
Istanbul DJF−TN
Temperature
Density function
−20 −10 0 10 20
0.00
0.10
Tripoli DJF−TN
Temperature
Density function
−20 −10 0 10 20
0.00
0.10
Zagreb DJF−TN
Temperature
Density function
−10 −5 0 5 10 15 20
0.00
0.10
Belgrade MAM−TN
Temperature
Density function −10 −5 0 5 10 15 20
0.00
0.10
Istanbul MAM−TN
Temperature
Density function
−10 −5 0 5 10 15 20
0.00
0.10
Tripoli MAM−TN
Temperature
Density function
−10 −5 0 5 10 15 20
0.00
0.10
Zagreb MAM−TN
Temperature
Density function
0 5 10 15 20 25 30
0.00
0.15
Belgrade JJA−TN
Temperature
Density function
0 5 10 15 20 25 30
0.00
0.15
Istanbul JJA−TN
Temperature
Density function
0 5 10 15 20 25 30
0.00
0.15
Tripoli JJA−TN
Temperature
Density function
0 5 10 15 20 25 30
0.00
0.15
Zagreb JJA−TN
Temperature
Density function
−10 0 10 20 30
0.00
0.10
Belgrade SON−TN
Temperature
Density function
−10 0 10 20 30
0.00
0.10
Istanbul SON−TN
Temperature
Density function
−10 0 10 20 30
0.00
0.10
Tripoli SON−TN
Temperature
Density function
−10 0 10 20 30
0.00 0.10 Zagreb SON−TN Temperature Density function (a) (b) (c) (d)
(e) (f )
(g) (h)
Figure 2.Kernel density estimation of seasonal (winter: DJF, spring: MAM, summer: JJA, autumn: SON) maximum (TX) and minimum (TN) temperature, using station (blue colour) and model (red) data, in four representative stations.
maximum of 50 days a year. The same occurs for about 30– 40 days year−1 over the Taurus mountain range in southern Turkey, and the Zagros Mountains in southwestern Iran and northern Iraq. Over the reference period, the occurrence of heavy precipitation days is negligible in the southern EMME region.
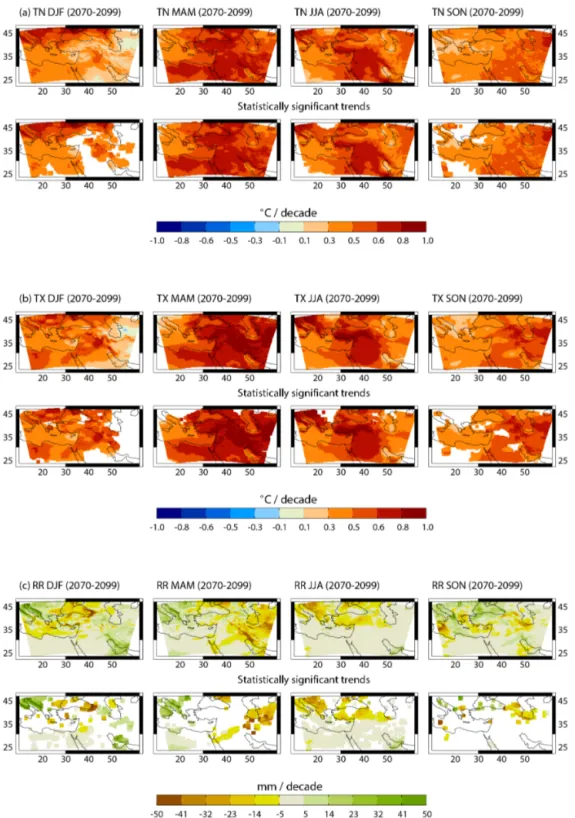
3.3 Projected temperature and precipitation changes In the following, we discuss the mean climate change for 2070–2099 and Fig. 6 provides key insights in the projected future trends in temperature and precipitation, as well as
presenting the distribution of statistically significant trends in the seasonal TX, TN and RR. It is worth noting that the temperature trends are estimated to be positive in all cases and statistically significant in nearly the entire study region. The annual trend patterns for both TN, TX show similar warming rates of approximately 0.4–0.6◦C decade−1
Figure 3.Average annual mean temperature(a), total annual precipitation(b), average winter minimum temperature(c)and average summer maximum temperature(d)based on the model control runs for the reference period 1961–1990.
Consistent with the findings for the reference period, the model projections suggest prominent trends in spring TN and TX, which increase by 0.6–0.8 and 0.7–0.9◦C decade−1,
re-spectively, with pronounced warming over the Middle East-ern countries. Summer temperatures reveal a gradual warm-ing (0.5–0.9◦C decade−1) over much of the region. Regard-ing precipitation, only a few grid cells were found to present statistical trends. Towards the end of the 21st century, pre-cipitation tends to increase during winter and spring and de-crease during summer in Italy and the western Balkan Penin-sula. In addition, spring, summer and autumn precipitation are projected to decrease over the Zagros and Elburz Moun-tains which extend along the western and northern part of Iran respectively.
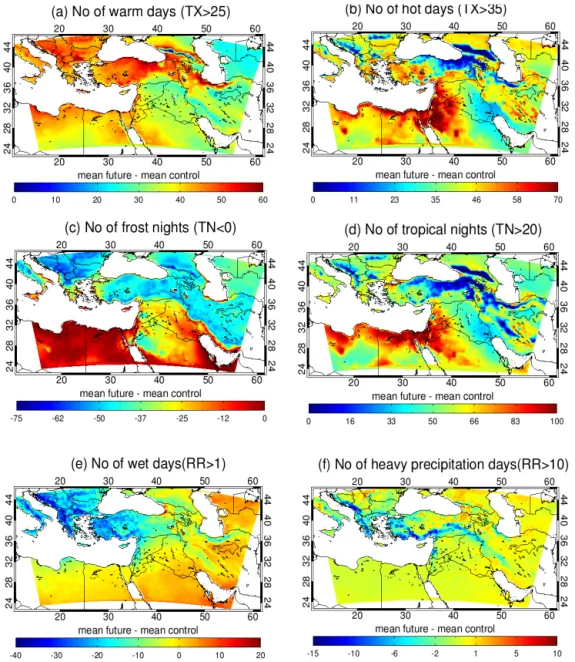
We defined the “present-day” period as 1961–1990 and “future” as the time period from 2070 to 2099, and computed differences in climate indices between these two periods. An attempt to quantify uncertainty is made by bootstrapping the 30-year differences of each index between the two periods (Mudelsee and Alkio, 2007). Bootstrapping works with arti-ficially produced resampled sets (by means of a random num-ber generator) of the difference index sample. In our study, each sample consists of 30 values which are resampled 1000 times with replacement. In each resample, the method calcu-lates the mean of each sample and the 95th percentile confi-dence intervals are then computed from the resulting series. Thus, in the analysis performed, each index change is pre-sented with a (±α) value, which represents the confidence
range value to add or subtract from the mean difference to get the limits. This is used as a measure to assess confidence in our results which are shown in Fig. 7. The number of warm days is found to increase particularly in the northern part of EMME by 50–60 additional days year−1 by the end of the
21st century with a confidence range between±5 to±8 days. Hot days are estimated to occur much more frequently in the EMME. In particular, low-elevation and coastal regions in the northern part are estimated to experience about 1–2 extra months with TX>35◦C, while the warmer and arid
south-ern parts are expected to face conditions with two additional months of hot days year−1. The signal of this change for the entire domain is robust since the confidence range is±5 days. It is estimated that the warmer future of the area will also in-clude strong increases in the occurrence of warm nights. The change in the number of tropical nights translates to 1–2 ad-ditional months of tropical nights year−1in the north and to
3 additional months in the southern EMME by the end of the 21st century. Uncertainties associated with this parameter are very small since the confidence range varies from±5 days in the north to±8 days in the south.
Figure 4.Trends in seasonal (winter: DJF, spring: MAM, summer: JJA, autumn: SON) minimum (TN), maximum (TX) temperatures and precipitation (RR). Upper panels in every set of(a),(b),(c)present all trends, while lower panels show only grid points with statistically significant trends over the period 1961–1990.
precipitation is likely to decrease in the high-elevation areas by 15 days year−1by the end of the 21st century. Greater
un-certainties are found for the precipitation indices with values ranging from ±5 to ±9 for the wet days and from ±2 to
±6 days for the heavy precipitation days.
4 Conclusions
Figure 5.Spatial patterns of the number of warm days(a), hot days(b), frost nights(c), tropical nights(d), wet days(e)and days with heavy precipitation(f), per year, during the control period 1961–1990.
eastern Mediterranean and Middle East region. The evalu-ation results have shown that the model reproduces the ma-jor features of the observed annual cycle and provided ev-idence of the accuracy of the model results and associated uncertainties. The calculated annual temperature trends indi-cate statistically significant warming over land in the EMME of approximately 0.4–0.6◦C decade−1during the reference
period, which is projected to increase to 0.9◦C decade−1in
the future. Similarly, warming trends are revealed in the sea-sonal TX and TN, with the spring temperatures increasing at a faster rate. The strongest warming over the reference period is found for spring TX reaching up to 0.9◦C decade−1mainly observed in the southern Balkans and Turkey. Precipitation trends have shown more regional and seasonal differences. Regarding the reference period, a large part of the study re-gion has seen a decrease in spring precipitation, while de-crease in winter precipitation is mainly found to be
statisti-cally significant over Turkey. In contrast, some western parts of the EMME region have seen an increase in winter and autumn precipitation. Minimal evidence of statistical signifi-cance is found in the future trends of precipitation patterns over the region of study. However, it is worth noting the decreasing trends in summer precipitation over large parts of the northern Mediterranean countries. Further decreases in summer precipitation could have particularly important effects in local societies and economies, in a climate zone which is characterised by low precipitation during the sum-mer season.
Figure 6.As in Fig. 4 for the future period 2070–2099.
present and future precipitation, based on the model data, are more uncertain; however, the future precipitation indices showed decreases in the number of wet days and the heavy precipitation events towards the end of the 21st century. The application of the PRECIS model over the EMME re-gion produced results which are consistent with the find-ings of relative studies developed for the Mediterranean
Figure 7.Spatial patterns of the mean changes in the number of warm days(a), hot days(b), frost nights(c), tropical nights(d), wet days (e)and days with heavy precipitation(f), for the future period 2070–2099 relative to the control period 1961–1990.
have important negative consequences for human health and ecosystems.
The socio-economic impacts of potential future climate change vary substantially among different regions depend-ing on the vulnerability of regions and the degree of expo-sure to climate change. It is worth noting the urgent need for effective implementation of policy actions, preparedness and response mechanisms to potential climate change, to reduce the risks of associated future socio-economic-environmental threats. According to the findings of the present work, large parts of the EMME region are expected to suffer drought conditions leading to water shortages, which are crucial espe-cially for the semi-arid areas of the eastern half of the EMME region. Furthermore, the combined effects of decreased
pre-cipitation and increases in temperatures could have impacts on the agricultural and tourism sectors, which are crucial for local economies especially in the southern European countries.
Acknowledgements. The research leading to these results has received funding from the European Research Council under the European Union’s Seventh Framework Programme (FP7/2007-2013)/ERC grant agreement no. 226144.
Edited by: P. Nastos
References
Alijani, B.: Effect of the Zagros Mountains on the spa-tial distribution of precipitation, J. Mt. Sci., 5, 218–231, doi:10.1007/s11629-008-0126-8, 2008.
Almazroui, M., Nazrul Islam, M., Dambul, R., and Jones, P. D.: Trends of temperature extremes in Saudi Arabia, Int. J. Climatol., 34, 808–826, doi:10.1002/joc.3722, 2014.
Arnell, N. W.: Climate change and global water resources: SRES emissions and socio economic scenarios, Global. Environ. Chang., 14, 31–52, 2004.
Brunet, M., Jones, P. D., Sigro, J., Saladie, O., Aguilar, E., Moberg, A., Della-Marta, P. M., Lister, D., Walther, A., and Lopez, D.: Temporal and spatial temperature variability and change over Spain during 1850–2005. J. Geohys. Res., 112, D12117, doi:10.1029/2006JD008249, 2007.
Brunetti, M., Lentini, G., Maugeri, M., Nanni, T., Auer, I., Böhm, R., and Schöner, W.: Climate variability and change in the Greater Alpine Region over the last two centuries based on multi-variable analysis, Int. J. Climatol., 29, 2197–2225, doi:10.1002/joc.1857, 2009.
Collins, M., Booth, B. B. B., Harris, G. R., Murphy, J. M., Sexton, D. M. H., and Webb, M. J.: Towards quantifying uncertainty in transient climate change, Clim. Dynam., 27, 127–147, 2005. Chambers, J. M. and Hastie, T. J.: Statistical Models in S,
Wadsworth & Brooks/Cole, 1992.
Chenoweth, J., Hadjinicolaou, P., Bruggeman, A., Lelieveld, J., Levin, Z., Lange, M. A., Xoplaki, E., and Hadjikakou, M.: The impact of climate change on the water resources of the east-ern Mediterranean and Middle East region: modelled 21st cen-tury changes and implications, Water. Resour. Res., 47, W06506, doi:10.1029/2010WR010269, 2011.
Christensen, J. H., Hewitson, B., Busuioc, A., Chen, A. , Gao, X., Held, I., Jones, R., Kolli, R. K., Kwon, W.-T., Laprise, R., Mag-aña Rueda, V., Mearns, L., Menéndez, C. G., Räisänen, J., Rinke, A., Sarr, A., and Whetton, P.: Regional climate projections, in: Climate change 2007: The physical science basis. Contribution of Working Group I to the Fourth Assessment Report of the In-tergovernmental Panel on Climate Change, edited by: Solomon, A., Qin, D., Manning, M., Chen, Z., Marquis, M., Averyt, K. B,. Tignor, M., and Miller, H. L., Cambridge University Press, Cam-bridge, UK and New York, NY, USA, 2007a.
Christensen, J. H., Carter, T. R., Rummukainen, M., and Amana-tidis, G.: Evaluating the performance and utility of regional cli-mate models: the PRUDENCE project, Clim. Chang., 81, 1–6, 2007b.
Efthymiadis, D., Goodess, C. M., and Jones, P. D.: Trends in Mediterranean gridded temperature extremes and large-scale cir-culation influences, Nat. Hazards Earth Syst. Sci., 11, 2199– 2214, doi:10.5194/nhess-11-2199-2011, 2011.
Frei, C., Schöll, R., Fukutome, S., Schmidli, J., and Vidale, P. L.: Future change of precipitation extremes in Europe: Intercompar-ison of scenarios from regional climate models, J. Geophys. Res. Atmos., 111, D06105, doi:10.1029/2005JD005965, 2006. Giannakopoulos, C., Hadjinicolaou, P., Kostopoulou, E., Varotsos,
K. V., and Zerefos, C.: Precipitation and temperature regime over Cyprus as a result of global climate change, Adv. Geosci., 23, 17–24, 2010,
http://www.adv-geosci.net/23/17/2010/.
Giorgi, F. and Lionello, P.: Climate change projections for the Mediterranean region, Global Planet. Change, 63, 90–104, 2008. Goubanova, K. and Li, L.: Extremes in temperature and precipi-tation around the Mediterranean basin in an ensemble of future climate scenario simulations, Global Planet. Change, 57, 27–42, 2007.
Hadjinicolaou, P., Giannakopoulos, C., Zerefos, C., Lange, M. A., Pashiardis, S., and Lelieveld, J.: Mid-21st century climate and weather extremes in Cyprus as projected by six regional climate models, Reg. Environ. Change, 11, 441–457, 2011.
Helsel, D. R. and Hirsch, R. M.: Statistical Methods in Water Re-sources, Elsevier, p. 522, 1992.
IPCC: The Physical Science Basis. Contribution of Working Group I to the Fourth Assessment Report of the Intergovernmental Panel on Climate Change, edited by: Solomon, S., Qin, D., Manning, M., Chen, Z., Marquis, M., Averyt, K. B., Tignor, M., and Miller, H. L., Cambridge University Press, Cambridge, United Kingdom and New York, NY, USA, 996 pp., 2007.
Jacob, D., Bärring, L., Christensen, O. B., Christensen, J. H., de Castro, M., Déqué, M., Giorgi, F., Hagemann, S., Hirschi, M., Jones, R., Kjellström, E., Lenderink, G., Rockel, B., Sánchez, E., Schär, C., Seneviratne, S., Somot, S., van Ulden, A., and van den Hurk, B.: An inter-comparison of regional climate models for Europe: model performance in present-day climate, Clim. Chang., 81, 31–52, 2007.
Jones, R. G., Noguer, M., Hassell, D. C., Hudson, D., Wilson, S. S., Jenkins, G. J., and Mitchell, J. F. B.: Generating high resolu-tion climate change scenarios using PRECIS, Met Office Hadley Centre, Exeter, UK, 40 pp., 2004.
Karl, T. R., Nicholls, N., and Ghazi, A.: CLIVAR/GCOS/WMO workshop on indices and indicators for climate extremes: work-shop summary, Clim. Chang., 42, 3–7, 1999.
Kendall, M. G.: Rank Correlation Methods, 4th Ed., London: Grif-fin, 258 pp., 1970.
Klein Tank, A. M. G., Zwiers, F. W., and Zhang, X.: Guide-lines on analysis of extremes in a changing climate in sup-port of informed decisions for adaptation (WCDMP-72, WMO-TD/No.1500), 56 pp., 2009.
Kostopoulou, E. and Jones, P. D.: Assessment of climate extremes in the Eastern Mediterranean, Meteor. Atmos. Phys., 89, 69–85, doi:10.1007/s00703-005-0122-2, 2005.
Kostopoulou, E., Giannakopoulos, C., Hatzaki, M., and Tziotziou, K.: Climate extremes in the NE Mediterranean: assessing the E-OBS dataset and regional climate simulations, Clim. Res., 54, 249–270, doi:10.3354/cr01110, 2012.
Kuglitsch, F. G., Toreti, A., Xoplaki, E., Della-Marta, P. M., Zere-fos, C. S., Türkes, M., and Luterbacher, J.: Heat wave changes in the eastern Mediterranean since 1960, Geophys. Res. Lett., 37, L04802, doi:10.1029/2009GL041841, 2010.
Lelieveld, J., Hadjinicolaou, P., Kostopoulou, E., Chenoweth, J., Gi-annakopoulos, C., Hannides, C., Lange, M. A., El Maayar, M., Tanarhte, M., Tyrlis, E., and Xoplaki, E.: Climate change and impacts in the Eastern Mediterranean and the Middle East, Clim. Chang., 114, 667–687, 2012.
Lionello, P. (Ed.): The Climate of the Mediterranean Region: From the Past to the Future, Amsterdam: Elsevier (Netherlands) 9780124160422, 502 pp., 2012.
Meehl, G. A., Stocker, T. F., Collins, W. D., Friedlingstein, P., Gaye, A. T., Gregory, J. M., Kitoh, A., Knutti, R., Murphy, J. M., Noda, A., Raper, S. C. B., Watterson, I. G., Weaver, A. J., and Zhao, Z. C.: Global Climate Projections, in: “Climate Change 2007: The Physical Science Basis. Contribution of Working Group I to the Fourth Assessment Report of the Intergovernmental Panel on Climate Change”, edited by: Solomon, S., Qin, D., Manning, M., Chen, Z., Marquis, M., Averyt, K. B., Tignor, M., and Miller, H. L., 747–845, Cambridge University Press: Cambridge, United Kingdom and New York, NY, USA, 2007.
Mitchell, T. D. and Jones, P. D.: An improved method of construct-ing a database of monthly climate observations and associated high-resolution grids, Int. J. Climatol. 25, 693–712, 2005. Naki´cenovi´c, N. and Swart, R. (Eds.): IPCC Special Report on
Emissions Scenarios. Cambridge University Press, UK, 2000. Nastos, P. T. and Zerefos, C. S.: Decadal changes in
ex-treme daily precipitation in Greece, Adv. Geosci., 16, 55–62, doi:10.5194/adgeo-16-55-2008, 2008.
Peterson, T. C.: Climate change indices, World Meteorol. Organ. Bull. 54, 83–86, 2005.
Randall, D. A., Wood, R. A., Bony, S., Colman, R., Fichefet, T., Fyfe, J., Kattsov, V., Pitman, A., Shukla, J., Srinivasan, J., Stouf-fer, R. J., Sumi, A., and Taylor, K. E.: Climate Models and Their Evaluation, in: Climate Change 2007: The Physical Science Ba-sis. Contribution of Working Group I to the Fourth Assess-ment Report of the IntergovernAssess-mental Panel on Climate Change, Solomon, S., Qin, D., Manning, M., Chen, Z., Marquis, M., Av-eryt, K. B., Tignor, M. and Miller, H. L., Cambridge University Press, Cambridge, United Kingdom and New York, NY, USA, 2007.
Rummukainen, M.: State-of-the-art with regional climate models, WIREs Clim. Change., 1, 82–96, 2010.
Sheffield, J. and Wood, E. F.: Projected changes in drought occur-rence under future global warming from multi-model, multi sce-nario, IPCC AR4 simulations, Clim. Dynam., 31, 79–105, 2008. Silverman, B. W.: Density estimation for statistics and data analysis. Monographs on Statistics and Applied Probability, Chapman and Hall, London, New York, 175 pp., 1986.
Tayanç, M., ˙Im, U., Do˘gruel, M., and Karaca, M.: Climate change in Turkey for the last half century, Clim. Chang., 94, 483–502, 2009.
Ulbrich, U., Lionello, P., Belušic, D., Jacobeit, J., Knippertz, P., Kuglitsch, F. G., Leckebusch, G. C., Luterbacher, J., Maugeri, M., Maheras, P., Nissen, K. M., Pavan, V., Pinto, J. G., Saa-roni, H., Seubert, S., Toreti, A., Xoplaki, E., and Ziv, B.: Cli-mate of the Mediterranean: Synoptic Patterns, Temperature, Pre-cipitation, Winds, and Their Extremes, in: The Climate of the Mediterranean Region, edited by: Lionello, P., From the Past to the Future, Amsterdam: Elsevier (Netherlands) 9780124160422, 502 pp., 2012.
Unkaševi´c, M. and Toši´c, I.: Trends in temperature indices over Ser-bia: relationships to large-scale circulation patterns, Int. J. Clima-tol., 33, 3152–3161, doi:10.1002/joc.3652, 2013.
Vidale, P. L., Daniel Lüthi, D., Christoph Frei, C., Sonia I. Seneviratne, S. I., and Schär, C.: Predictability and uncertainty in a regional climate model, J. Geophys. Res., 108, 4586, doi:10.1029/2002JD002810, 2003.
Zhang, X., Aguilar, E., Sensoy, S., Melkonyan, H., Tagiyeva, U., Ahmed, N., Kutaladze, N., Rahimzadeh F., Taghipour, A., Han-tosh, T. H., Albert, P., Semawi, M., Ali, M. K., Al-Shabibi, M. H. S., Al-Oulan, Z., Zatari, T., Al Dean Khelet, I., Hamoud, S., Sagir R., Demircan, M., Eken, M., Adiguzel, M., Alexander, L., Peterson, T. C., and Wallis, T.: Trends in Middle East climate ex-treme indices from 1950 to 2003, J. Geophys. Res., 110, D22104, doi:10.1029/2005JD006181, 2005.