CO
2-C losses and carbon quality of selected Maritime
Antarctic soils
JULIANA VANIR DE SOUZA CARVALHO1, EDUARDO DE SA´ MENDONC¸A2*, NEWTON LA SCALA JR3,
CE´ SAR REIS4
, EFRAIN LA´ ZARO REIS4
and CARLOS E.G.R. SCHAEFER5
1
Chemistry Department, Universidade do Estado de Minas Gerais, Av. Olega´rio Maciel 1427, 36500-000, Uba´, Minas Gerais, Brazil 2Department of Plant Production, Federal University of Espı´rito Santo, 29500-000, Alegre, ES, Brazil
3
FCAV, Universidade Estadual Paulista, Via de Acesso Prof Paulo Donato Castellane s/n, 14884-900, Jaboticabal, SP, Brazil 4
Chemistry Department, Federal University of Vic¸osa, Av. PH Rolfs, s/n, 36570-000, Vic¸osa, Minas Gerais, Brazil 5
Visiting scholar, Scott Polar Research Institute, Lensfield Rd, Cambridge CB2 1ER, UK *corresponding author: esmjplia@gmail.com
Abstract:Polar Regions are the most important soil carbon reservoirs on Earth. Monitoring soil carbon storage in a changing global climate context may indicate possible effects of climate change on terrestrial environments. In this regard, we need to understand the dynamics of soil organic matter in relation to its chemical characteristics. We evaluated the influence of chemical characteristics of humic substances on the process of soil organic matter mineralization in selected Maritime Antarctic soils. A laboratory assay was carried out with soils from five locations from King George Island. We determined the contents of total organic carbon, oxidizable carbon fractions of soil organic matter, and humic substances. Twoin situfield experiments were carried out during two summers, in order to evaluate the CO2-C emissions in relation to
soil temperature variations. The overall low amounts of soil organic matter in Maritime Antarctic soils have a low humification degree and reduced microbial activity. CO2-C emissions showed significant exponential
relationship with temperature, suggesting a sharp increase in CO2-C emissions with a warming scenario, and
Q10 values (the percentage increase in emission for a 108C increase in soil temperature) were higher than values reported from elsewhere. The sensitivity of the CO2-C emission in relation to temperature was significantly
correlated with the humification degree of soil organic matter and microbial activity for Antarctic soils.
Received 22 November 2011, accepted 19 June 2012, first published online 3 October 2012
Key words: CO2emission, C sequestration, C stocks, permafrost, polar soils
Introduction
Soils constitute the major carbon reservoir of the terrestrial system (Silva & Mendonc¸a 2007), hence the study of carbon dynamics at different soil types, even in natural environments and in areas under anthropogenic influence, has been an important issue due to its relation to the greenhouse gas effect (Batjes 1996). In contrast with other cold regions (Arctic and alpine environment), the Antarctic continent has been comparatively less studied, although it represents an opportunity for exploring phenomena. Terrestrial Antarctic ecosystems are restricted in the ice-free zone, distributed basically along the coast or isolated mountains chain, representing less than 0.5% of the total area of that continent (Campbell & Claridge 1987).
The severe climate and low water availability are important factors driving the Antarctic soils formation (Campbell & Claridge 1987), and soil losses by periglacial erosion influences the amount of organic matter in Antarctic soils, which are highly variable (Michel et al. 2006, Carvalho
et al. 2010).
Soil C stock is a result of the combination between the primary production by autotrophic organisms and the organic
matter decay promoted microbial activity (Silva & Mendonc¸a 2007). For this reason, the monitoring of soil C stocks with emphasis on soil temperature may indicate future changes in stocks due to changes in the terrestrial environment. The Maritime Antarctic has experienced significant temperature increases in the last 50 years (Vaughan et al. 2001, Quayle
et al. 2002, Steig et al. 2009). Higher temperatures may
increase the soil organic matter (SOM) decomposition due to the great exposure of formerly frozen soil (La Scala et al. 2010, Mendonc¸a et al. 2011), resulting in decreasing soil C stocks (Carvalhoet al. 2010, La Scalaet al. 2010).
The organic matter mineralization process affects primarily the less persistent SOM forms, resulting in a gradual accumulation of organic materials with higher recalcitrance in substances such as chitin, uric acid and humic substances (Myrchaet al. 1983). This process is part of the C cycle and promotes, simultaneously, enhanced CO2in
the atmosphere and reduction of soil C stocks. The microbial activity in Antarctic soils, like elsewhere, is dependent on multiple factors, such as nutrient availability, pH, moisture, salinity, besides temperature.
bryophytes and a few higher plants present on the soil surface are capable of fixing atmospheric C in Antarctic soils (Simaset al. 2006). However, the majority of global warming models predict an increase in temperature especially in periglacial regions, which will greatly affect CO2-C production and SOM content (La Scalaet al. 2010).
In addition, increasing soil temperature results in higher soil CO2-C emissions according to different vegetation
covers (Mendonc¸a et al. 2011). There is a consensus that the characterization of C dynamics in Antarctic soils is fundamental to establish the relation between soil properties and climatic changes (Beyeret al. 2004).
To examine the consequences of increasing soil temperature in Antarctica the understanding of mineralization rate of SOM, including an enhanced knowledge of C quality and soil microbial activity, is necessary. The aim of this study was to analyse the influence of these characteristics on the
mineralization process of SOM in selected, representative Maritime Antarctic soils.
Material and methods
Characterization of the studied sites
Admiralty Bay is located at King George Island (62803'–62805'S, 58823'–58824'W) which is the largest island in the South Shetland Islands (Simas et al. 2007). During the 2008–09 summer, soils were collected in three replicates at 0–10 cm and 10–20 cm in five different soils locations across Keller Peninsula, as shown in Fig. 1.
Based on the physical-chemical, mineralogical and morphological soil characteristics (Table I), soil located in sites 1 and 2 were classified as basaltic/andesitic soils while those in sites 3, 4 and 5 were classified as acid sulphate soils (Simas et al. 2006). Prior to analytical procedures, all
Fig. 1.Map of King George Island, highlighting Keller Peninsula, where soils were collected (adapted from Birkenmajer 2002).
Table I.Co-ordinates, physical and mineralogical characteristics of the soils collected in the Keller Peninsula.
Sample Co-ordinates Stone (%) Soil density (g cm-3) Mineralogy Texture
P1 21 E 0427137 53.9 1.60
UTM 3115552
HIS-sme.pyr, pl.all Sandy silt
P2 21 E 0427091 46.1 1.36
UTM 3116260
P3 21 E 0425658 63.9 1.43
UTM 3115916
P4 21 E 0425922 73.1 1.24 ka, ch, I-S.ja.feh Sandy clay
UTM 3117161
P5 21 E 0426010 53.4 1.31
UTM 3117588
HIS-sme5interstratified smectite-hydroxy-interlayered-smectite, pyr5pyroxene, pl5plagioclase, all5allophone, ka5kaolinite, ch5chlorite, I-S5
samples were passed through a 2 mm sieve to quantify the percentage of coarse fragments, larger than 2 mm.
Total soil organic carbon (TOC) content in all studied locations was determined according to Yeomans & Bremner (1988). Oxidizable organic C labile and recalcitrant fractions (Clabileand Crecalc) were determined according to Chanet al.
(2001), while total nitrogen was determined by the Kejldahl method (Bremner & Mulvaney 1982). Microbial biomass (Cmic) was determined by the irradiation extraction method (Islam & Weil 1998, Ferreiraet al. 1999). The Cmic/TOC was used as an indicator of soil microbial biomass pool (Marchiori & Mello 1999), and considered a proxy of SOM quality.
Soil humic and fulvic acids fractions were extracted, fractioned and purified according to the International Humic Substances Society (IHSS) (Swift 1996), and following, total C content was determined according the method described in Yeomans & Bremner (1988). Soil bulk density was determined in soil samples with the use of paraffin impregnation method (Embrapa 1997). C stock of surface horizons of soil was calculated using the following formula:
Cst¼ ðTOCÞðE:C:ÞðDÞ½1 -ð%fragments42 mmÞ=100;
where Cst5C stock (kg m-2), TOC5total soil organic carbon (g C kg-1 soil), E.C.5thickness of the soil (m),
and D5soil density (kg soil m-3), expressed in g cm-3 or 10-3kg m-3.
In situsoil CO2-C emission experiment
The field experiment was conducted in the vicinity of Comandante Ferraz Brazilian Antarctic Station, Keller Peninsula. Soils from locations 1–5 (0–10 cm), with and without vegetation (mixedDeschampsiaand mosses), were kept at open environmental conditions. Measurement of CO2-C emission were conducted during two summer seasons,
from 24 January to 10 February 2008 and from December 2008 to March 2009, totalling 21 days of readings during these periods, in accordance with weather conditions.
Samples were collected from five sites and were kept in open-air on a 60 x 60 cm wooden board, composed by 21 PVC collars (10 cm diameter each), containing 300 g of bare soil or 200 g of soil1100 g of natural vegetation (mixedDeschampsiaand mosses). An automated soil CO2
flux system (LI-8100, Li-Cor Environmental) was coupled to the collars to measure CO2 emitted at each sample.
At measurement mode, three replicates were applied for each collar, performing 63 measurements per day under contrasting soil temperature conditions. The LI-8100
Table II.Characterization of the soil organic matter of the soil samples.
Samples TOC TN C stock C/N Clabile Crecalc qMIC Cfulv Chum
g kg-1 g kg-1 kg m-2 % % % g kg-1 g kg-1
P1 0–10 cm 4.39 0.12 0.334 36.36 36.37 63.77 1.91 0.14 0.00
P1 10–20 cm 3.68 0.08 0.236 47.65 46.66 53.39 1.42 0.09 0.00
P2 0–10 cm 7.57 0.32 0.507 23.45 48.19 51.78 1.52 0.90 0.00
P2 10–20 cm 5.96 0.16 0.243 38.06 38.39 61.64 1.07 0.22 0.00
P3 0–10 cm 12.04 0.83 0.961 14.54 69.05 30.87 0.27 2.10 1.47
P3 10–20 cm 5.12 0.41 0.407 12.59 49.35 50.70 1.07 0.46 0.25
P4 0–10 cm 9.85 0.50 0.787 19.62 68.55 31.41 0.56 1.58 0.74
P5 0–10 cm 13.51 0.76 0.873 17.75 50.2 49.79 0.25 1.91 2.80
P5 10–20 cm 9.46 0.66 0.676 14.23 64.41 35.64 0.75 1.83 0.36
TOC5total organic carbon, TN5total nitrogen, Clabile5C in the labile form, Crecalc5C in the recalcitrant form, qMIC5percentage of the total C in the microbial biomass, Cfulv5C in the fulvic acid fraction, Chum5C in the humic acid fraction.
Table III.Descriptive statistics of CO2-C emission from soil with or without vegetation (S1V or S, respectively).
Samples n Mean Mean Standard C.V. Min. Max.
(g m-2h-1) (g (g soil C)-1h-1) deviation
P1 S 28 0.096 0.07289 0.058 0.607 0.000 0.250
P1 S1V 28 0.281 - 0.125 0.446 0.100 0.610
P2 S 35 0.138 0.06077 0.111 0.802 0.030 0.590
P2 S1V 35 0.428 - 0.193 0.450 0.157 1.000
P3 S 35 0.218 0.06035 0.117 0.534 0.080 0.667
P3 S1V 35 0.585 - 0.217 0.371 0.203 1.140
P4 S 35 0.114 0.03858 0.106 0.933 0.000 0.600
P4 S1V 35 0.372 - 0.249 0.668 0.060 1.150
P5 S 28 0.155 0.01894 0.055 0.353 0.060 0.253
P5 S1V 35 0.709 - 0.523 0.738 0.207 2.860
Mean S 0.144 0.03553 0.093 - 0.034 0.472
Mean S1V 0.475 0.295 - 0.145 1.352
system is based on the infrared absorption spectroscopy that analyse the time changes of CO2concentration inside
the chamber once it is placed onto the soil PVC collars. As the internal chamber is a closed system (internal volume5854 cm3), with a fixed contact area to the soil (exposed area583 cm2), changes in CO2 concentration
inside the chamber once it was placed on the collars, was used to calculate emissions at measurement mode, during 1.5 min reading. As soon as emissions were measured,in situ
soil temperature was also recorded in all treatments with a field thermometer placed at 10 cm depth.
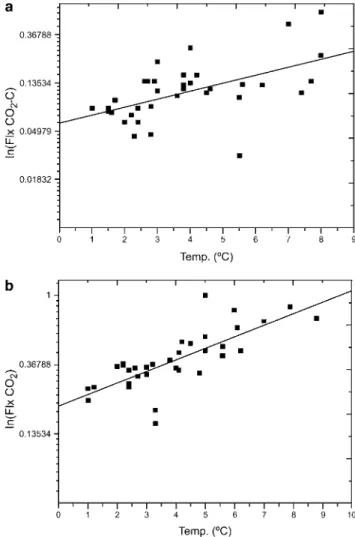
The relation between CO2 and soil temperature was
described by the equation FCO25F0 x exp(b x Tsoil),
with the natural log (Ln) of the CO2 emission we have
Ln(FCO2)5Ln(F0 x exp(b x Tsoil)), the result is Ln(FCO2)5
Ln(F0)1b x Tsoil. A linear relation between Ln(FCO2) and
the Tsoil is expected in the environments where soil temperature is a limiting factor.
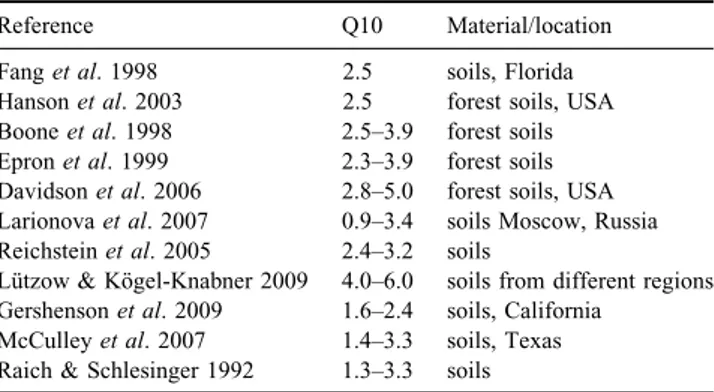
Based on the B coefficients it is possible to derive the Q10 factor, which represents the percentage increase in emission for a 108C increase in soil temperature. This is derived as Q105e10 x B.
Statistical analysis
Data was submitted to the studentst-test (significance level of 5%) in order to compare the mean values by using the SAEG software (Funarbe 2007). Graphs and linear regressions were performed using the Origin 8.0 software (Origin Lab Corp).
Results
Soil organic matter characterization
Table II presents the results of SOM characterization in all locations studied for both depths, except for location 4, where the bedrock was found at 10 cm depth and no soil could be collected. The lowest C stocks were found in
samples 1 and 2 (basaltic/andesitic soils), both very rocky and shallow. The microbial coefficient (qMIC) ratio indicates higher values for soils 1 and 2, contrasting to
Table IV.Parameters of the model between CO2-C emissions and soil temperature for the studied soil and Q10 factor.
Location ln(FCO2)5A1B*Tsoil Q10
A B (8C-1) R P
P1 S -3.154 ± 0.221 0.189a ± 0.055 0.566 2.1 x 10⁻² 6.593a ± 4.558
P1 S1V -1.878 ± 0.140 0.157a ± 0.038 0.632 3.0 x 10⁻⁴ 4.816a ± 2.027
P2 S -2.818 ± 0.190 0.166a ± 0.044 0.551 6.0 x 10
-4
5.238a ± 2.636
P2 S1V -1.595 ± 0.107 0.167a ± 0.025 0.765 8.9 x 10
-8
5.312a ± 1.362
P3 S -2.050 ± 0.113 0.101b ± 0.023 0.609 1.0 x 10
-4
2.732a ± 0.648
P3 S1V -1.097 ± 0.105 0.124a,b ± 0.023 0.679 7.5 x 10
-6
3.463a ± 0.844
P4 S -2.914 ± 0.221 0.112b ± 0.041 0.432 1.1 x 10
-2
3.059a ± 1.432
P4 S1V -1.557 ± 0.260 0.085b,c ± 0.058 0.248 1.5 x 10⁻¹ 2.347a ± 1.751
P5 S -2.240 ± 0.164 0.069c ± 0.034 0.372 5.1 x 10⁻² 1.990a ± 0.728
P5 S1V -0.903 ± 0.194 0.086b ± 0.039 0.360 3.4 x 10⁻² 2.368a ± 1.032
Mean 0.126 Mean 3.792
s.e. 0.042 s.e. 1.579
*Means followed by same letter do not differ significantly by student’st-test at the 5% level of significance.
A and B5linear and angular coefficients, obtained from the linear regression analysis, respectively; R5linear correlation coefficient;P5significance level; and s.e.5standard error.
Fig. 2.Logarithm of CO2-C emission as related to soil
different proportion of Clabileand Crecalcfractions. Differences
associated with biological and chemical methods can represent different C fractions.
Soil CO2-C emission
Table III presents the mean CO2-C values from the twoin situ
summer experiments. The mean CO2-C emissions varied from
0.034–0.472 g of CO2-C m-2h-1for soil samples (S) and from
0.145–1.352 g of CO2-C m-2 h-1 for soil plus vegetation
samples (S1V). Changes in CO2-C can be related to soil
temperature, as shown in Table IV. Significant (P,0.05) exponential relationship between CO2-C and soil temperature
was observed for all locations, in samples either with or without vegetation. The relation FCO2-C5F0eB x Tsoil, was linearly fit
by applying Ln(FCO2-C)5Ln(F0)1B(Tsoil) (Fig. 2). Results
indicate that CO2-C emission sensitivity to soil temperature
(B coefficient in Table IV) is similar in all soils studied, irrespective of location and presence of vegetation. This is corroborated by the observed B values ± standard errors.
The significant and positive linear correlation of the B factor with C/N ratio and qMIC is illustrated in Figs 3 & 4. These results show how sensitive soil CO2-C emissions are to
increasing soil temperature. Fig. 3.Relationship between the B factor of CO2-C emissions
for tests with bare soil (S) versusa.the values of C/N ratio, andb.microbial coefficient (qMIC) for Antarctic soils.
Fig. 4.Relationship between the B factor of CO2-C emissions for tests with bare soil with vegetation (S1V) versusa.the values of C/N ratio, andb.microbial coefficient (qMIC) for Antarctic soils.
Table V. Q10 values for soils from different regions, estimated by several authors.
Reference Q10 Material/location
Fanget al. 1998 2.5 soils, Florida Hansonet al. 2003 2.5 forest soils, USA Booneet al. 1998 2.5–3.9 forest soils Epronet al. 1999 2.3–3.9 forest soils Davidsonet al. 2006 2.8–5.0 forest soils, USA Larionovaet al. 2007 0.9–3.4 soils Moscow, Russia Reichsteinet al. 2005 2.4–3.2 soils
Lu¨tzow & Ko¨gel-Knabner 2009 4.0–6.0 soils from different regions Gershensonet al. 2009 1.6–2.4 soils, California
The Q10 values are reported in Table IV. The mean Q10 value in our study (3.792 ± 1.579) is higher than that observed elsewhere by several authors (Table V).
Discussion
Soil organic matter characterization
The mean C content for all soil samples (7.95 ± 3.47 g kg-1) is within the range of previous studies (Bo¨lter 1995, Bo¨lteret al. 1997, Simaset al. 2008, Francelino et al. 2011), but lower than the ones found in Carvalhoet al. (2010) for mineral soils of King George Island, and other terrestrial studies elsewhere in Antarctica (Campbell & Claridge 1987, Simaset al. 2008). However, soil C stocks presented values similar to those reported by Michelet al. (2006), with a range 0.1–0.9 kg m-2 (in the upper 10 cm layer) for Admiralty Bay soils.
The high C/N ratio of the soil is usually related to low decomposition rate of soil organic matter (Silva & Mendonc¸a 2007). Higher C/N ratio was observed in samples 1 and 2 for both depths, indicating a low decomposition degree of SOM. On the other hand, samples 3, 4 and 5, corresponding to acid sulphate soils, presented intermediate C/N ratios, varying from 12.6–19.6. Considering that all samples are subjected to cold climate conditions, and with a poor vegetation cover (basically Deschampsia antarctica Desv. and mosses), the differences in C/N ratio may be attributed to varying soil moisture conditions. Samples 1 and 2 are loamy sand soils contrasting to sandy clay soils 3, 4 and 5. It is well-documented that higher clay content effectively protects soil C due to colloidal interactions (Silva & Mendonc¸a 2007). Under experimental conditions it is expected only limited colloidal interactions between clay and SOM occur since there is little soil structural development. Hence, only resistant structural SOM with high C/N ratio, and recalcitrant fractions, remain.
Soils 1 and 2 have high pH, nutrient contents and cation exchange capacity (Simaset al. 2006), which may positively affect soil microbial activity. In these areas erosion is intense, and soils are less developed and have lower SOM content, compared with soils 3, 4 and 5. Our data are supported by the results of Hopkins et al. (2009), which indicated that with permafrost melting, the SOM from Maritime Antarctica can have a relatively fast turnover, which may be related to recent exposure of labile material, protected by the frozen state.
The low or negligible contents of humic and fulvic acid fractions in the soils indicate that inherited humin is the main route for humic substances formation. Low temperature and little clay content of Antarctic soils do not favour the physical protection of SOM, increasing C losses (Silva & Mendonc¸a 2007).
Soil CO2-C emission
The presence of vegetation, regardless of the soil studied, resulted in 230% emission increase, or the equivalent of 0.331 g of CO2-C m-2 h-1. In any bare soil condition, the
ratio between total emission (or mean emission) and the soil C stock, would be related to the rate of the soil C decay (time-1). In this regard, our results indicate that the higher this ratio, the lower the soil C stock. This means that the soil C losses through CO2 are the main
mechanism which controls the soil C stock in Maritime Antarctic soils.
The difference between minimum and maximum mean values for bare soil emissions were as high as 1288%, while in S1V samples differences were 832%. The lowest emissions, with negligible values, were observed in soil 1 (basaltic/andesitic soils, sandy soil), without vegetation, which also had the lowest soil C stocks (Table II). On the other hand higher mean emissions during the two summer periods were obtained for soil 5 with vegetation (2.860 g C-CO2 m-2 h-1, acid sulphate clay soil), which showed
higher soil C stocks. The mean emissions suggest that soil C losses through CO2 were greater in soil 5, under
D. antarctica plus moss cover. On the other hand higher
emissions from bare soils were observed in soil 3, and similar figures were obtained for soils 2 and 4. These results suggest that soil exposure following permafrost melting may enhance the decay of native SOM to CO2, as
already suggested by previous studies (Michaelson et al. 2004, Carvalhoet al. 2010, La Scalaet al. 2010, Mendonc¸a
et al. 2011). Overall, the maximum, minimum and the
mean values of C emission from soil plus vegetation were greater than the bare soil emissions, which can be attributed to plant root respiration (Tang & Baldocchi 2005), being influenced by different plant photosynthetic activity (Kuzyakov & Gavrichkova 2010).
The CO2-C emission is sensitive to soil temperature and
the significance of B values shows three different sensitivity ranges, a higher range for soils 1 and 2, a mean for soils 3 and 4, and a lower range for soil 5, with 0.069 C-1. Soils with higher B factor are those with lower SOM contents and C stocks (soils 1 and 2). These are also loamy sand soils, with lower clay content than the remaining soils 3, 4 and 5. The former soils have higher SOM humification degree, similar SOM content, C/N ratio and soil C stock, whereas soil 5 presented lower labile C content compared to soils 3 and 4. This is related to the lower B factor of soil 5 in relation to the others, since the labile C pool, readily oxidizable, is less at soil 5.
It is known that the sensitivity of soil C to soil temperature is affected by numerous factors that are directly or indirectly related to temperature (Yuste et al. 2007). These relations are better illustrated in Fig. 3 as the B factor, which expresses how sensitive soil CO2-C
emission is to increasing soil temperature. We observed a significant and positive linear correlation with C/N ratio and qMIC. These data contrast with the results of Hopkins
et al. (2009) that showed positive relation of high C/N ratio
(Jingguo & Bakken 1997). However, highest bacterial biomass is located in surface levels, independent of actual high C/N ratios (Bo¨lteret al. 1999). It is also well known that N has significant importance in SOM accumulation, since it is effective for organic matter humification routes (Silva & Mendonc¸a 2007). These soil characteristics are therefore attributes that may be useful to infer soil C losses through CO2 emission in ice-free zones, during
the Antarctic summer. By comparing the data in Fig. 4, a decreasing trend in the coefficient of determination for the soil with vegetation suggests that other factors, besides the C/N ratio and qMIC, are affecting the sensitivity of emissions. This result is corroborated by data obtained by La Scalaet al. (2010), showing that soil temperature exerts a controlling factor on temporal variations in soil CO2-C
emissions, and points out that vegetation is an additional important effect.
The experimental results of vegetated soils indicate, after cluster analysis, that B values of soil 3 plus vegetation were intermediate between values for soils 1 and 2 and soil 4 and 5 (Table IV). This is probably due to the higher changes in CO2-C emissions promoted by photosynthetic
activity and evolved root exudates (Mendonc¸aet al. 2011), which are more subject to microbial degradation. The studied soils have SOM with greater susceptibility to degradation when exposed to environmental conditions than SOM from other regions (Carvalho et al. 2010). Results in the present work is in the range of Q10 reported for forest soils (Epron
et al. 1999, Davidsonet al. 2006), which have much greater
SOM contents, hence having high sensitivities.
The above discussion requires a potential scenario in which the regional temperature would significantly increase, consequently reducing the soil C stock by increasing CO2
emissions. However, increasing soil biomass due to greater photosynthesis and primary productivity may counteract this trend (Michelet al. 2006). Hence, the SOM balance would be a result of the soil C input/output at this new hypothetical scenario.
Conclusions
Maritime Antarctic soils having lower humification degree showed higher CO2-C emissions. A significant relationship
(P,0.05) between CO2-C emission and soil temperature
was observed for both bare soil or vegetated soil.
The emission of CO2-C showed significant exponential
relationship (P,0.05) with temperature, with increasing emission of CO2-C with increasing temperature.
The sensitivity of CO2-C emissions in relation to
temperature showed significant correlation with the degree of humification and microbial activity. Thus, further losses of CO2-C with rising temperature are expected in soils with a
lower degree of humification.
The average Q10 values for the soils did not differ, but overall values were higher than those observed elsewhere.
The high Q10 value is related to the fragility of the SOM with low degree of humification and chemical characteristics of humic substances, becoming more susceptible to microbial degradation.
Acknowledgements
We acknowledge Conselho Nacional de Desenvolvimento Cientı´fico e Tecnolo´gico, Brazil, for financial support. Carlos Schaefer thanks CAPES agency for granting a sabbatical visiting professorship at Cambridge University. This work is a contribution of INCT-Criosfera TERRANTAR group. The constructive comments of the reviewers are also gratefully acknowledged.
References
BATJES, N.H. 1996. Total carbon and nitrogen in the soils of the world. European Journal of Soil Science,47, 151–163.
BEYER, L., WHITE, D.M., PINGPANK, K. & BO¨ LTER, M. 2004. Composition and transformation of soil organic matter in cryosols and gelic histosols in coastal eastern Antarctica (Casey Station, Wilkes Land).InKIMBLE, J.,ed. Cryosols: permafrost affected soils. Berlin: Springer, 525–557. BIRKENMAJER, K. 2002. Retreat of the Ecology Glacier, Admiralty Bay,
King George Island (South Shetland Islands, West Antarctica), 1956–2001. Bulletin of the Polish Academy of Sciences, Earth Sciences,50, 16–29.
BO¨ LTER, M. 1995. Distribution of bacterial numbers and biomass in soils and on plants from King George Island (Arctowski Station, Maritime Antarctica).Polar Biology,15, 115–124.
BO¨ LTER, M., BLUME, H.P. & KUHN, D. 1999. Soils and their microbiological properties from a transect from Cape Horn to the Antarctic Peninsula. Polar Bioscience,12, 54–67.
BO¨ LTER, M., BLUME, H.P., SCHNEIDER, D. & BEYER, L. 1997. Soil properties and distribution of invertebrates and bacteria from King George Island (Arctowski Station), Maritime Antarctic.Polar Biology,18, 295–304. BOONE, R.D., NADELHOFFER, K.J., CANARY, J.D. & KAYE, J.P. 1998. Roots
exert a strong influence on the temperature sensitivity of soil respiration. Nature,396, 570–572.
BREMNER, J.M. & MULVANEY, C.S. 1982. Nitrogen total. InPAGE, A.L., ed. Methods of soil analysis: chemical and microbiological properties. Madison: American Society of Agronomy, 595–624.
CAMPBELL, I.B. & CLARIDGE, G.G.C. 1987.Antarctica: soils, weathering processes and environment. Amsterdam: Elsevier, 368 pp.
CARVALHO, J.V.S., MENDONC¸ A, E.S., BARBOSA, R.T., REIS, E.L., SEABRA, P.N. & SCHAEFER, C.E.G.R. 2010. Impact of expected global warming on C mineralization in Maritime Antarctic soils: results of laboratory experiments.Antarctic Science,22, 485–493.
CHAN, K.Y., BOWMAN, A. & OATES, A. 2001. Oxidizable organic carbon fractions and soil quality changes in oxic paleustalf under different pasture leys.Soil Science,166, 61–67.
DAVIDSON, E.A., JANSSENS, I.A. & LUO, Y. 2006. On the variability of respiration in terrestrial ecosystems: moving beyond Q10. Global Change Biology,12, 154–164.
EMBRAPA (Empresa Brasileira de Pesquisa Agropecua´ria). 1997.Manual de me´todos de ana´lise de solo, 2nd ed. Rio de Janeiro: EMBRAPA, Centro Nacional de Pesquisa de Solos, 212 pp.
EPRON, D., FARQUE, L., LUCOT, E. & BADOT, P. 1999. Soil CO2efflux in a beech forest: dependence on soil temperature and soil water content. Annals of Forest Science,56, 221–226.
FERREIRA, A.S., CAMARGO, F.A.O. & VIDOR, C. 1999. Utilizac¸a˜o de microondas na avaliac¸a˜o da biomassa microbiana do solo. Revista Brasileira de Cieˆncia do Solo,23, 991–996.
FRANCELINO, M.R., SCHAEFER, C.E.G.R., SIMAS, F.N.B., FERNANDESFILHO, E.I., SOUZA, J.J.L. & COSTA, L.M. 2011. Geomorphology and soils distribution under paraglacial conditions in an ice-free area of Admiralty Bay, King George Island, Antarctica.Catena,85, 194–204.
FUNARBE (Fundac¸a˜o Arthur Bernardes). 2007. SAEG: sistema para ana´lises estatı´sticas, version 9.1. Vic¸osa, MG, Brazil: Federal University of Vic¸osa, CD-ROM.
GERSHENSON, A., BADER, N.E. & CHENG, W. 2009. Effects of substrate availability on the temperature sensitivity of soil organic matter decomposition.Global Change Biology,15, 176–183.
HANSON, P.J., O’NEILL, E.G. & CHAMBERS, M.L.S. 2003. Soil respiration and litter decomposition.InHANSON, P.J. & WULLSCHLEGER, S.D.,eds. North American temperate deciduous forest responses to changing precipitation regimes. New York: Springer, 163–189.
HOPKINS, D.W., SPARROW, A.D., GREGORICH, E.G., ELBERLING, B., NOVIS, P., FRASER, F., SCRIMGEOUR, C., DENNIS, P.G., MEIER-AUGENSTEIN, M. & GREENFIELD, L.G. 2009. Isotopic evidence for the provenance and turnover of organic carbon by soil microorganisms in the Antarctic dry valleys.Environmental Microbiology,11, 597–608.
ISLAM, K.R. & WEIL, R.R. 1998. Microwave irradiation of soil for routine measurement of microbial biomass carbon. Biology and Fertility of Soils,27, 408–416.
JINGGUO, W. & BAKKEN, L.R. 1997. Competition for nitrogen during mineralization of plant residues in soil: microbial response to C and N availability.Soil Biology & Biochemistry,29, 163–170.
KUZYAKOV, Y. & GAVRICHKOVA, O. 2010. Time lag between photosynthesis and carbon dioxide efflux from soil: a review of mechanisms and controls.Global Change Biology,14, 1365–2486.
LARIONOVA, A.A., YEVDOKIMOV, I.V. & BYKHOVETS, S.S. 2007. Temperature sensitivity of soil respiration is dependent on readily decomposable C substrate concentration.Biogeosciences Discussions,4, 2007–2025. LASCALA, N., MENDONC¸ A, E.S., CARVALHO, J.V.S., PANOSSO, A.R., SIMAS,
F.N.B. & SCHAEFER, C.E.G.R. 2010. Spatial and temporal variability in soil CO2-C emissions and relation to soil temperature at King George Island, Maritime Antarctica.Polar Science,4, 479–487.
LU¨ TZOW, M.V. & KO¨ GEL-KNABNER, I. 2009. Temperature sensitivity of soil organic matter decomposition - what do we know?Biology and Fertility of Soils,46, 1–25.
MARCHIORI JR M. & MELO, W.J. 1999. Carbono, carbono da biomassa microbiana e atividade enzima´tica em um solo sob mata natural, pastagem e cultura do algodoeiro.Revista Brasileira De Cieˆncia Do Solo,23, 257–263.
MCCULLEY, R.L., BOUTTON, I.C. & ARCHER, S.R. 2007. Soil respiration in a subtropical savanna parkland: response to water additions.Soil Science Society of America Journal,71, 820–828.
MENDONC¸ A, E.S., LASCALAJRN., PANOSSO, A.R.P., SIMAS, F.N.B. & SCHAEFER, C.E.G.R. 2011. Spatial variability models of CO2 emissions from soils colonized by grass (Deschampsia antarctica) and moss (Sanionia uncinata) in Admiralty Bay, King George Island.Antarctic Science,23, 27–33. MICHAELSON, G.J., DAI, X.Y. & PING, C.L. 2004. Organic matter and
bioactivity in cryosols of arctic Alaska.InKIMBLE, J.M.,ed. Cryosols: permafrost affected soils. Berlin: Springer, 463–479.
MICHEL, R.F.M., SCHAEFER, C.E.G.R., DIAS, L., SIMAS, F.N.B., BENITES, V. & MENDONC¸ A, E.S. 2006. Ornithogenic gelisols (cryosols) from Maritime Antarctica: pedogenesis, vegetation and carbon studies. Soil Science Society of America Journal,70, 1370–1376.
MYRCHA, A., PIETR, S.J. & TATUR, A. 1983. The role of pygoscelid penguin rockeries in nutrient cycles at Admiralty Bay, King George Island.In SIEGFRIED, W.R., CONDY, P.R. & LAWS, R.M.,eds. Antarctic nutrient cycles and food webs. Berlin: Springer, 700 pp.
QUAYLE, W.C., PECK, L.S., PEAT, H., ELLIS-EVANS, J.C. & HARRIGAN, P.R. 2002. Extreme responses to climate change in Antarctic lakes.Science, 295, 645.
RAICH, J.W. & SCHLESINGER, W.H. 1992. The global carbon dioxide flux in soil respiration and its relationship to vegetation and climate.Tellus, 44B, 81–99.
REICHSTEIN, M., KA¨ TTERER, T., ANDRE, O., CIAIS, P., SCHULZE, E-D., CRAMER, W., PAPALE, D. & VALENTINI, R. 2005. Temperature sensitivity of decomposition in relation to soil organic matter pools: critique and outlook.Biogeosciences Discussions,2, 317–321.
SILVA, I.R. & MENDONC¸ A, E.S. 2007. Mate´ria orgaˆnica do solo.InNOVAIS, R.F., ALVAREZ, V., BARROS, N.F., FONTES, R.L.F., CANTARUTTI, R.B & NEVES, J.C.L.,eds.Fertilidade do solo. Vic¸osa, MG, Brazil: Sociedade Brasileira de Cieˆncia do Solo, 275–374.
SIMAS, F.N.B., SCHAEFER, C.E.G.R., MELO, V.F., FRANCELINO, M.R., FERNANDESFILHO, E.I. & COSTA, L.M. 2008. Genesis, properties and classification of cryosols from Admiralty Bay, Maritime Antarctica. Geoderma,144, 116–122.
SIMAS, F.N.B., SCHAEFER, C.E.G.R., MELO, V.F., GUERRA, M.B.B., SAUNDERS, M. & GILKES, R.J. 2006. Clay-sized minerals in permafrost-affected soils (cryosols) from King George Island, Antarctica.Clays and Clay Minerals,54, 723–738.
SIMAS, F.N.B., SCHAEFER, C.E.G.R., MELO, V.F., ALBUQUERQUE-FILHO, M.R., MICHEL, R.F.M., PEREIRA, V.V., GOMES, M.R.M. & COSTA, L.M. 2007. Ornithogenic cryosols from Maritime Antarctica: phosphatization as a soil forming process.Geoderma,138, 191–203.
STEIG, E.J., SCHNEIDER, D.P., RUTHERFORD, S.D., MANN, M.E., COMISO, J.C. & SHINDELL, D.T. 2009. Warming of the Antarctic ice sheet surface since the 1957 International Geophysical Year.Nature,457, 459–463. SWIFT, R.S. 1996. Organic matter characterization.InSPARKS, D.L., PAGE,
A.L., HELMKE, P.A., LOEPPERT, R.H., SOLTANPOUR, P.N., TABATABAI, M.A., JOHNSTON, C.T. & SUMNER, M.E.,eds. Methods of soil analysis: chemical methods. Madison, WI: American Society of Agronomy, 1011–1020.
TANG, J. & BALDOCCHI, D.B. 2005. Spatial-temporal variation in soil respiration in an oak-grass savanna ecosystem in California and its partitioning into autotrophic and heterotrophic components. Biogeochemistry,73, 183–207.
VAUGHAN, D.G., MARCHALL, G.J., CONNOLLEY, W.M., KING, J.C. & MULVANEY, R. 2001. Devil in the detail.Science,293, 1777–1779. YEOMANS, J.C. & BREMNER, J.M. 1988. A rapid and precise method for
routine determination of organic carbon in soil.Communications in Soil Science and Plant Analysis,19, 1467–1476.