ACPD
12, 24043–24093, 2012Long-term observations of
aerosol size distributions
V. Vakkari et al.
Title Page
Abstract Introduction
Conclusions References
Tables Figures
◭ ◮
◭ ◮
Back Close
Full Screen / Esc
Printer-friendly Version Interactive Discussion
Discussion
P
a
per
|
Dis
cussion
P
a
per
|
Discussion
P
a
per
|
Discussio
n
P
a
per
|
Atmos. Chem. Phys. Discuss., 12, 24043–24093, 2012 www.atmos-chem-phys-discuss.net/12/24043/2012/ doi:10.5194/acpd-12-24043-2012
© Author(s) 2012. CC Attribution 3.0 License.
Atmospheric Chemistry and Physics Discussions
This discussion paper is/has been under review for the journal Atmospheric Chemistry and Physics (ACP). Please refer to the corresponding final paper in ACP if available.
Long-term observations of aerosol size
distributions in semi-clean and polluted
savannah in South Africa
V. Vakkari1, J. P. Beukes2, H. Laakso1, D. Mabaso3, J. J. Pienaar2, M. Kulmala1, and L. Laakso2,4
1
Department of Physics, University of Helsinki, P.O. Box 64, 00014 University of Helsinki, Finland
2
School of Physical and Chemical Sciences, North-West University, Potchefstroom, South Africa
3
Rustenburg Local Municipality, Rustenburg, South Africa
4
Finnish Meteorological Institute, Research and Development, P.O. Box 503, 00101, Finland
Received: 12 June 2012 – Accepted: 3 September 2012 – Published: 14 September 2012
Correspondence to: V. Vakkari (ville.vakkari@helsinki.fi)
ACPD
12, 24043–24093, 2012Long-term observations of
aerosol size distributions
V. Vakkari et al.
Title Page
Abstract Introduction
Conclusions References
Tables Figures
◭ ◮
◭ ◮
Back Close
Full Screen / Esc
Printer-friendly Version Interactive Discussion
Discussion
P
a
per
|
Dis
cussion
P
a
per
|
Discussion
P
a
per
|
Discussio
n
P
a
per
|
Abstract
This study presents a total of four years of sub-micron aerosol particle size distribution measurements in the Southern African savannah, an environment with few previous observations covering a full seasonal cycle and the size range below 100 nm. During the first 19 months, July 2006–January 2008, the measurements were carried out at
5
Botsalano, a semi-clean location, whereas during the latter part, February 2008–May 2010, the measurements were carried out at Marikana (approximately 150 km east of Botsalano), which is a more polluted location with both pyrometallurgical industries and informal settlements nearby.
The median total concentration of aerosol particles was more than four times as
10
high at Marikana than at Botsalano. In the size ranges of 12–840 nm, 50–840 nm and 100–840 nm the median concentrations were 1850, 1280 and 700 particles cm−3 at Botsalano and 7800, 3800 and 1600 particles cm−3at Marikana, respectively.
The diurnal variation of the size distribution for Botsalano arose as a result of fre-quent regional new particle formation. However, for Marikana the diurnal variation was
15
dominated by the morning and evening household burning in the informal settlements, although regional new particle formation was even more frequent than at Botsalano. The effect of the industrial emissions was not discernible in the size distribution at Marikana although it was clear in the sulphur dioxide diurnal pattern, indicating the emissions to be mostly gaseous.
20
Seasonal variation was strongest in the concentration of particles larger than 100 nm, which was clearly elevated at both locations during the dry season from May to Septem-ber. In the absence of wet removal during the dry season the concentration of particles larger than 100 nm had a correlation above 0.7 with CO for both locations, which im-plies incomplete burning to be an important source of aerosol particles during the dry
25
ACPD
12, 24043–24093, 2012Long-term observations of
aerosol size distributions
V. Vakkari et al.
Title Page
Abstract Introduction
Conclusions References
Tables Figures
◭ ◮
◭ ◮
Back Close
Full Screen / Esc
Printer-friendly Version Interactive Discussion
Discussion
P
a
per
|
Dis
cussion
P
a
per
|
Discussion
P
a
per
|
Discussio
n
P
a
per
|
Air mass history analysis for Botsalano identified four regional scale source areas in Southern Africa and enabled the differentiation between fresh and aged rural back-ground aerosol originating from the clean sector, i.e., western sector with very few large anthropogenic sources. Comparison to size distributions published for other compara-ble environments in Northern Hemisphere shows Southern African savannah to have
5
a unique combination of sources and meteorological parameters. The observed strong link between combustion and seasonal variation is comparable only to the Amazon basin; however the lack of long-term observations in the Amazonas does not allow a quantitative comparison.
All the data presented in the figures, as well as the time series of monthly mean and
10
median size distributions are included in numeric form as a Supplement to provide a reference point for the aerosol modelling community.
1 Introduction
Atmospheric aerosol particles impact our lives in several ways. They moderate climate via directly scattering and absorbing solar radiation and indirectly by modifying the
15
properties of clouds and therefore affecting the global radiation budget (e.g. Seinfeld and Pandis, 2006). In addition to climate impacts, aerosol particles cause adverse health effects and deteriorate visibility (e.g. Charlson, 1969; Pope and Dockery, 2006). Atmospheric aerosol particles are recognised as the source of the largest uncertainty in the current global climate models (Forster et al., 2007). Reducing the uncertainty
20
in the global climate models requires temporally and spatially representative data sets on a global scale, preferably including both chemical and physical properties of the aerosol particles. One of the key physical parameters of aerosols is the number size distribution, and especially for the climate effects, the size distribution in the sub-micron range.
25
ACPD
12, 24043–24093, 2012Long-term observations of
aerosol size distributions
V. Vakkari et al.
Title Page
Abstract Introduction
Conclusions References
Tables Figures
◭ ◮
◭ ◮
Back Close
Full Screen / Esc
Printer-friendly Version Interactive Discussion
Discussion
P
a
per
|
Dis
cussion
P
a
per
|
Discussion
P
a
per
|
Discussio
n
P
a
per
|
et al. (2010) for comparison with a global aerosol model. However, most of the long-term observations are from the Northern Hemisphere and very few from continental locations in the Southern Hemisphere (Spracklen et al., 2010). Since the study by Spracklen et al. (2010) even more data sets have been published for the continental boundary layer in the Northern Hemisphere. For example Asmi et al. (2011) presented
5
two years of size distributions from 20 European stations, Hyv ¨arinen et al. (2011) more than two years of size distributions from two sites in India and Shen et al. (2011) more than a year of size distributions from the North China Plain.
However, for the Southern Hemisphere there is a very limited number of long-term data sets of sub-micron aerosol particle size distributions in the continental boundary
10
layer (Laakso et al., 2006; Laakso et al., 2008; Hirsikko et al., 2012; Laakso et al., 2012). Even from the Amazon basin, where several intensive measurement campaigns have been carried out during recent years, no size distribution measurements that cover a full year have been published (see e.g. the review by Martin et al. (2010) and references therein).
15
The locations of currently available (published or accessible via databases) long-term data sets representing continental boundary layer are illustrated in Fig. 1. Figure 1 is based on the data set by Spracklen et al. (2010) and follows the division into marine, high altitude and continental boundary layer locations by Spracklen et al. (2010). Fig-ure 1 was updated with this study and other recently published aerosol size distribution
20
observations in the continental boundary layer extending below 100 nm and covering at least one full seasonal cycle (Asmi et al., 2011; Hyv ¨arinen et al., 2011; Shen et al., 2011; Hirsikko et al., 2012; Laakso et al., 2012).
The only exception to the rule of one full seasonal cycle was made to have one comparison location in South America. The data set in South America in Fig. 1 refers
25
ACPD
12, 24043–24093, 2012Long-term observations of
aerosol size distributions
V. Vakkari et al.
Title Page
Abstract Introduction
Conclusions References
Tables Figures
◭ ◮
◭ ◮
Back Close
Full Screen / Esc
Printer-friendly Version Interactive Discussion
Discussion
P
a
per
|
Dis
cussion
P
a
per
|
Discussion
P
a
per
|
Discussio
n
P
a
per
|
For Southern Africa the main source of information on atmospheric aerosol particles has been the SAFARI 2000 campaign (Swap et al., 2003). However, as SAFARI 2000 was focused on wild fires, the size distribution measurements were biased toward mea-suring emissions from fires. The measurements were conducted onboard of aircrafts to enable the tracking of fire plumes and hence the data sets gathered were typically
5
only for some tens of hours of flight time (Haywood et al., 2003a,b; Hobbs et al., 2003; Ross et al., 2003). The campaign was conducted in September 2000, which is usually part of the peak period for wild fires, i.e., the late dry season. Furthermore the wild fires were exceptionally intense in September 2000 (Swap et al., 2003), if compared with an average burning season. Considering all the above, the measurements
dur-10
ing SAFARI 2000 are therefore not temporally or spatially representative of the typical aerosol particle size distribution in Southern Africa.
Since SAFARI 2000 the next observations on sub-micron aerosol particle size distri-bution in Southern Africa were published by Laakso et al. (2008), who presented the monthly statistics of the number concentration of 10 to 840 nm aerosol particles
mea-15
sured at Botsalano from July 2006 to July 2007. Laakso et al. (2008) were the first to cover one full seasonal cycle in Southern Africa; however, the paper did not give more details than the monthly medians and percentiles of the observed total concentration. Recently Hirsikko et al. (2012) briefly discussed the diurnal and seasonal variations of the sub-micron aerosol size distribution in connection to new particle formation at
20
Marikana village, 150 km east of Botsalano, from February 2008 to May 2010. Laakso et al. (2012) included seasonal variation of aerosol number concentration from 10 nm to 10 µm in an overview of measurements at Elandsfontein, 200 km east of Marikana, from February 2009 to January 2011, that were part of the South African component of the European Union sponsored project EUCAARI (Kulmala et al., 2009, 2011).
25
ACPD
12, 24043–24093, 2012Long-term observations of
aerosol size distributions
V. Vakkari et al.
Title Page
Abstract Introduction
Conclusions References
Tables Figures
◭ ◮
◭ ◮
Back Close
Full Screen / Esc
Printer-friendly Version Interactive Discussion
Discussion
P
a
per
|
Dis
cussion
P
a
per
|
Discussion
P
a
per
|
Discussio
n
P
a
per
|
industrial sources and some informal settlements (Hirsikko et al., 2012; Venter et al., 2012) enabling a comparison between clean and polluted size distributions. The afore-mentioned measurement campaigns were supported also by the EUCAARI South African component (Kulmala et al., 2009, 2011; Laakso et al., 2012).
The diurnal, seasonal and spatial variations of sub-micron aerosol size distribution
5
were analysed and the differences between the semi-clean and the polluted environ-ment discussed. Additionally, we have included all the data used in the figures, as well as the monthly averaged time series of the size distributions in full size resolution as a Supplement to provide a reference point for future modelling studies.
2 Measurements and methods
10
2.1 Location
This study presents size distributions from two locations in the North-West Province of the Republic of South Africa. The measurements were conducted in Botsalano game reserve, latitude 25.54◦S, longitude 25.75◦E, 1420 m a.s.l., from 20 July 2006 until 5
February 2008 (Laakso et al., 2008; Vakkari et al., 2011) and in Marikana village,
lati-15
tude 25.70◦S, longitude 27.48◦E, 1170 m a.s.l., from 8 February 2008 to 17 May 2010
(Hirsikko et al., 2012; Venter et al., 2012).
The Botsalano game reserve has no local sources and has an extensive clean sec-tor to the west, with very little anthropogenic activities (Laakso et al., 2008). How-ever, the prevailing air mass origin for Botsalano is from the anticyclonic recirculation
20
path, which accumulates emissions from the entire industrialised Highveld (Tyson et al., 1996; Vakkari et al., 2011). The median SO2concentration is therefore nearly 1 ppb at Botsalano and hence the site is described as semi-clean instead of clean background site (Laakso et al., 2008). Botsalano is also occasionally affected by direct plumes from the megacity of Johannesburg-Pretoria (Lourens et al., 2012) and the surrounding
in-25
ACPD
12, 24043–24093, 2012Long-term observations of
aerosol size distributions
V. Vakkari et al.
Title Page
Abstract Introduction
Conclusions References
Tables Figures
◭ ◮
◭ ◮
Back Close
Full Screen / Esc
Printer-friendly Version Interactive Discussion
Discussion
P
a
per
|
Dis
cussion
P
a
per
|
Discussion
P
a
per
|
Discussio
n
P
a
per
|
Marikana, on the other hand is in the middle of the pyrometallurgical industry sur-rounding the city of Rustenburg approximately 100 km north-west of the Johannesburg-Pretoria megacity and 150 km east of Botsalano (Hirsikko et al., 2012; Venter et al., 2012). The pyrometallurgical industry around Marikana consists mainly of platinum group metal smelters that have high SO2 emissions (Venter et al., 2012) and
fer-5
rochrome smelters (Beukes et al., 2010). In addition to the industrial sources there are also informal settlements and low-cost housing in the Marikana village and the site is impacted daily by the household cooking and space heating activities in these areas (Hirsikko et al., 2012; Venter et al., 2012). Because of the significance of the industrial sources the area surrounding the measurement site at Marikana has been proposed
10
as a third legislatively proclaimed national air pollution hotspot in South Africa (Scott, 2010), in addition to the two existing priority areas, i.e., the Vaal Triangle and the High-veld priority areas (Yako, 2005; van Schalkwyk, 2007). Wild fires are frequent during the dry season in Southern Africa and may occur in any direction from the afore-mentioned measurement sites.
15
Marikana is located close to the transitional zone of the grassland biome to the sa-vannah biome (Mucina and Rutherford, 2006). The area surrounding Marikana that are not in industrial or residential use, are mainly used for farming activities, including both grazing and cash crop (e.g. maize) production (Venter et al., 2012). The Botsalano game reserve is situated totally in the savannah biome, which also supports
agricul-20
tural use (Friedl et al., 2002; Laakso et al., 2008). The clean sector west of Botsalano changes within approximately 100 km into semi-arid shrublands with low biomass and biological activity (Friedl et al., 2002; Mucina and Rutherford, 2006). This biome contin-ues in the sector between north and west from Botsalano into the neighbouring coun-tries of Botswana and Namibia. This region is commonly referred to as the Kalahari. To
25
ACPD
12, 24043–24093, 2012Long-term observations of
aerosol size distributions
V. Vakkari et al.
Title Page
Abstract Introduction
Conclusions References
Tables Figures
◭ ◮
◭ ◮
Back Close
Full Screen / Esc
Printer-friendly Version Interactive Discussion
Discussion
P
a
per
|
Dis
cussion
P
a
per
|
Discussion
P
a
per
|
Discussio
n
P
a
per
|
2.2 Instrumentation
The measurements were carried out at both Botsalano and Marikana with a mobile measurement trailer, which has been described in detail by Pet ¨aj ¨a et al. (2007) and Laakso et al. (2008). In this study we utilise only the aerosol particle size distributions from the differential mobility particle sizer (DMPS) (Hoppel, 1978; Jokinen and M ¨akel ¨a,
5
1997), size range 12–840 nm, time resolution 10 min, and as auxiliary data the CO and SO2concentrations measured with Horiba APMA-360 and Thermo 42S analysers, respectively.
Data coverage of the aerosol particle size distribution measurements from the DMPS was 75 % for the entire measurement period combined at both sites. For Botsalano
10
problems at the beginning of the measurement campaign, i.e., irregularities in the in-coming power and CPC breakdown in September 2006, decreased the average data coverage to 69 %. However from January 2007 onwards until the end of the measure-ments at Botsalano on 5 February 2008 the data coverage was on average 82 %.
For Marikana the average data coverage was 80 %. From the start of the
measure-15
ments on 10 February 2008 until the end of July 2009 the data coverage was good, on average 90 %, but during the second half of the Marikana measurement campaign some technical problems occurred: a CPC breakdown at the end of July 2009, a virus infection in the measurement PC in December 2009–January 2010 and a leak in the DMPS sheath air pump in March–April 2010. Nevertheless, the monthly data coverage
20
for both campaigns presented in Fig. 2 shows that the gaps in the measurements do not hinder studying seasonal variation.
A TSI 3772 CPC was running in parallel with the trailer DMPS for one week in August 2011. While the concentration was below 10 000 particles cm−3, i.e., the 3772 CPC operating in single particle count mode, the DMPS total concentration was on average
25
ACPD
12, 24043–24093, 2012Long-term observations of
aerosol size distributions
V. Vakkari et al.
Title Page
Abstract Introduction
Conclusions References
Tables Figures
◭ ◮
◭ ◮
Back Close
Full Screen / Esc
Printer-friendly Version Interactive Discussion
Discussion
P
a
per
|
Dis
cussion
P
a
per
|
Discussion
P
a
per
|
Discussio
n
P
a
per
|
2.3 Size distribution parameters
Number concentrations of aerosol particles larger than 50 or 100 nm in diameter are quite commonly used as proxies of cloud condensation nuclei (CCN), when direct mea-surements of CCN do not exist (e.g. Asmi et al., 2011). In this study, these number concentrations are approximated by integrating the measured size distribution
concen-5
trations from 50 to 840 nm (N50) and from 100 to 840 nm (N100) in particles cm−3. To provide a more comprehensive overview of the data, the size distribution number con-centrations are also integrated from 12 to 840 nm (N12) and from 12 to 25 nm (N <25) (cm−3) and, in addition to the sectional number concentrations, log-normal size distri-bution fits also are calculated.
10
The fitting of the log-normal size distribution to the measured aerosol particle size distribution was done with the method described by Vartiainen et al. (2007). Ann-modal log-normal size distribution is here defined with 10-base logarithm as
dN
d log10(Dp) =
n
X
i=1
Ni
√
2πlog10(σi)exp
−
log10(Dp)−log10(µi)2
2 (log10(σi))2
(1)
where Dp is the particle diameter in nm, Ni is particle number in mode i, µi is the
15
geometric mean of the modei in nm andσi is the standard deviation of modei(Seinfeld
and Pandis, 2006). In this method (Vartiainen et al., 2007) the number of modes per size distribution, n, is allowed to vary freely from one to three to obtain the best fit. Also the geometric means of the modes (µi) are left unconstrained.
While the modal fits presented in this study describe the size distribution in more
20
ACPD
12, 24043–24093, 2012Long-term observations of
aerosol size distributions
V. Vakkari et al.
Title Page
Abstract Introduction
Conclusions References
Tables Figures
◭ ◮
◭ ◮
Back Close
Full Screen / Esc
Printer-friendly Version Interactive Discussion
Discussion
P
a
per
|
Dis
cussion
P
a
per
|
Discussion
P
a
per
|
Discussio
n
P
a
per
|
distributionnobs
RME=
i2
P
i=i1
nobs(Dp(i))−nfit(Dp(i))
nobs(Dp(i))
(i2−i1+1)
×100 % (2)
whereDpis the size resolution vector of the measured distributionnobs as d logdN
10Dp and
the limits of the summationi1 andi2 can be selected to cover the entire range of the
size distribution or only a fraction of it. Thenfithere is calculated from Eq. (1).
5
Especially at the larger particle sizes the size distribution was quite often not log-normal for both Botsalano and Marikana, which led to over- or underestimation of the size distribution by the modal fits. To account for this, we have calculated the MRE separately for the distribution both below and above 300 nm in addition to the overall error.
10
For the Botsalano median distribution, Fig. 3, the modal fits represented the distri-bution quite well below 300 nm with a mean relative error of 5 %, but above 300 nm the fits overestimated the concentration by on average 30 %. For Marikana the modal fits were closer to the median distribution with a 0.5 % mean relative error below 300 nm and 8 % mean relative error above 300 nm.
15
Since the concentrations above 300 nm were not large, even a 30 % overestimate of the size distribution did not affect the total concentration significantly. For example for the Botsalano median distribution using the log-normal modal fits instead of the measured data to calculateN100 led to an error of 0.9 %. However, we recommend using the primary data instead of the modal fits whenever possible.
20
The number size distributions are presented as d logdN
10Dp with units of particles cm
−3
ACPD
12, 24043–24093, 2012Long-term observations of
aerosol size distributions
V. Vakkari et al.
Title Page
Abstract Introduction
Conclusions References
Tables Figures
◭ ◮
◭ ◮
Back Close
Full Screen / Esc
Printer-friendly Version Interactive Discussion
Discussion
P
a
per
|
Dis
cussion
P
a
per
|
Discussion
P
a
per
|
Discussio
n
P
a
per
|
2.4 Ancillary data
The spatial variability of the size distributions was studied with air mass history from back-trajectories similarly to Vakkari et al. (2011). The 96-h back-trajectories for each hour throughout the measurement period were calculated with the HYSPLIT 4.8 model (Draxler and Hess, 2004). The HYSPLIT model was run with the GDAS
meteorologi-5
cal archive produced by the US National Weather Service’s National Centre for Envi-ronmental Prediction (NCEP) and archived by the National Oceanic and Atmospheric Administration (NOAA) Air Resources Laboratory (ARL) (Air Resources Laboratory, 2011).
In the simple approach used by Vakkari et al. (2011) a 0.5◦
×0.5◦grid is first defined 10
over Southern Africa. Each back-trajectory is then assigned the parameters observed at the measurement site when the trajectory arrived – in this case theN12,N50 and
N100 number concentrations. Each grid cell is then allocated an average value of the observed parameters assigned to the trajectories passing over it, i.e., the value of each grid cell represents the average value observed at the measurement site when
15
air masses passed over that point.
The accuracy of trajectories depends on the quality of the underlying meteorological data in use (Stohl, 1998) and the errors accompanying single trajectories are currently estimated as 15 to 30 % of the trajectory distance travelled (Stohl, 1998; Riddle et al., 2006). However, Vakkari et al. (2011) demonstrated that the afore-mentioned approach
20
gives a fairly representative picture of the regional patterns around Botsalano.
The seasonality of wild fires in Southern Africa was studied using MODIS collection 5 Burned Area product (Roy et al., 2008). The MODIS Burned Area product provides an estimate of when a specific 500 m×500 m land area has been burned based on
rapid changes in the surface reflectance (Roy et al., 2008). The monthly number of fire
25
ACPD
12, 24043–24093, 2012Long-term observations of
aerosol size distributions
V. Vakkari et al.
Title Page
Abstract Introduction
Conclusions References
Tables Figures
◭ ◮
◭ ◮
Back Close
Full Screen / Esc
Printer-friendly Version Interactive Discussion
Discussion
P
a
per
|
Dis
cussion
P
a
per
|
Discussion
P
a
per
|
Discussio
n
P
a
per
|
3 Results and discussion 3.1 Median size distributions
The individual overall median distributions for both Botsalano and Marikana with modal fits are presented in Fig. 3. The median total concentration from 12 to 840 nm (N12) was 1800 and 7800 particles cm−3for Botsalano and Marikana, respectively. The
me-5
dian and mean number concentrations for both Botsalano and Marikana in all four size ranges (N12,N <25,N50 andN100) are given in Table 1 together with the six refer-ence data sets indicated in Fig. 1. Also two data sets from Southern Africa covering a full seasonal cycle are included in Table 1, although they did not present size re-solved concentrations. Log-normal size distribution parameters fitted to both median
10
and mean size distributions are presented in Table 2 for both Botsalano and Marikana. The fitted Aitken mode concentration of Marikana (Table 2) is over four times higher than for Botsalano, although the fitted accumulation mode number concentrations are quite close to each other. Also the nucleation mode concentration is relatively high for Marikana, whereas the Botsalano median distribution below 25 nm is fairly well
15
represented as the tail of the Aitken mode. This indicates that the measurements at Marikana were much closer to the sources of the aerosol particles than at Botsalano.
Four of the sites chosen for the comparison in Table 1, i.e., Mukteshwahr, India (Hyv ¨arinen et al., 2011), Shangdianzi, China (Shen et al., 2011), Southern Great Plains, US (Sheridan et al., 2001) and K-Puszta, Hungary (Asmi et al., 2011), are
20
surrounded by grassland or cropland with no local sources, although none of them are really remote locations. Mukteswahr lies approximately 200 km from the megacity of New Delhi (Hyv ¨arinen et al., 2011) and Shangdianzi approximately 150 km from the megacity of Beijing (Shen et al., 2011). The nearest coal-fired power plants lie within 50 km of the Southern Great Plains site (Rissman et al., 2006) and K-Puszta is located
25
ACPD
12, 24043–24093, 2012Long-term observations of
aerosol size distributions
V. Vakkari et al.
Title Page
Abstract Introduction
Conclusions References
Tables Figures
◭ ◮
◭ ◮
Back Close
Full Screen / Esc
Printer-friendly Version Interactive Discussion
Discussion
P
a
per
|
Dis
cussion
P
a
per
|
Discussion
P
a
per
|
Discussio
n
P
a
per
|
with 100 000 inhabitants (Rissler et al., 2006). The Rondonia site is impacted by exten-sive biomass burning during the dry season (Rissler et al., 2006) and thus the concen-trations in Rondonia are clearly higher than in natural environment in Amazon basin (Martin et al., 2010).
The Gual Pahari site in India was included for comparison with Marikana, because
5
both are affected by biomass burning for household heating and cooking (Hyv ¨arinen et al., 2011; Hirsikko et al., 2012). However, Gual Pahari is only 25 km from New Delhi, thus it is impacted by the megacity (Hyv ¨arinen et al., 2011). The Ispra site in Italy was selected to represent a more industrially polluted location (Asmi et al., 2011).
The total concentration at Botsalano is slightly lower or comparable to the other
semi-10
clean grass- or cropland sites in Table 1, except for the Shangdianzi site (Shen et al., 2011) and the Rondonia site during the dry season (Rissler et al., 2006), which have total concentrations comparable to Marikana. However, the concentration of particles larger than 100 nm is clearly lower at Botsalano than at the other semi-clean sites except for the Southern Great Plains (Sheridan et al., 2001). One plausible
explana-15
tion is that the prevailing anticyclonic recirculation of air masses for Botsalano (Vakkari et al., 2011) forces air masses from the industrial sources around Johannesburg to travel considerably longer than the direct distance to Botsalano. Longer transportation allows more time for removal processes and dilution. On the other hand the concentra-tion below 100 nm and therefore also the total concentraconcentra-tion are kept relatively high by
20
the extremely high frequency of new particle formation observed at Botsalano (Vakkari et al., 2011).
The concentrations at Marikana are only slightly higher than at Shangdianzi and clearly lower than at Gual Pahari, but higher than for Ispra (Table 1). The concentration above 100 nm is lower than in any of these three sites. It seems that for Marikana
25
the total concentration is largely due to the new particle formation, which occurs with record-high frequency (Hirsikko et al., 2012).
ACPD
12, 24043–24093, 2012Long-term observations of
aerosol size distributions
V. Vakkari et al.
Title Page
Abstract Introduction
Conclusions References
Tables Figures
◭ ◮
◭ ◮
Back Close
Full Screen / Esc
Printer-friendly Version Interactive Discussion
Discussion
P
a
per
|
Dis
cussion
P
a
per
|
Discussion
P
a
per
|
Discussio
n
P
a
per
|
concentrations in Botsalano and Marikana, which is reasonable considering the an-thropogenic sources in the locations.
3.2 Diurnal variation of the size distribution
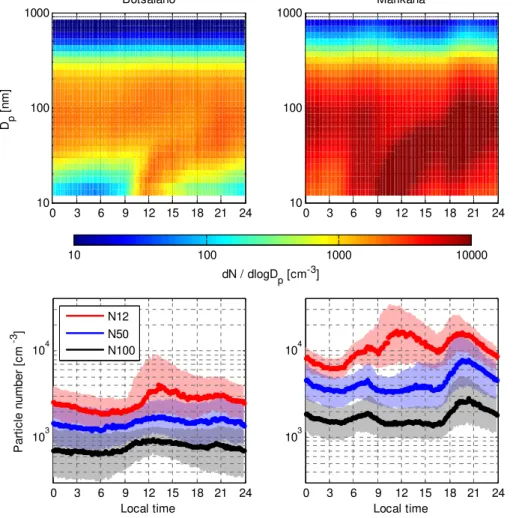
Figure 4 illustrates the median diurnal variation of aerosol particle size distribution for Botsalano and Marikana. Both surface plots have been calculated from the
measure-5
ments so that each 10 min size distribution is a median for that specific time interval over the entire measurement period for each location. The edges of the new particle formation event in Fig. 4 left panel (Botsalano) are not as sharp as in a typical event, since the onset of the new particle formation follows sunrise, which varies from 05:18 to 07:01 local time (LT) at Botsalano. This time dependant variation, as well as the shape
10
of the typical event can be seen in Appendix A Fig. A1, where median diurnal variation for Botsalano is plotted for each month.
For Botsalano new particle formation is the main driving force of the diurnal varia-tion in the size distribuvaria-tion. Furthermore, the accumulavaria-tion mode concentravaria-tion does not appear to drop at the onset of the event, if the median diurnal behaviour or data
15
from March to November is considered. However, during summer, i.e., December to February, there is a drop in the accumulation mode in the morning, as seen in monthly median diurnal plots in Fig. A1 in Appendix A – for mean diurnal variation the drop is stronger.
Considering the median diurnal distribution, the accumulation mode concentration
20
increased at the onset of the new particle formation event: the increase in N100 in Fig. 4 is concurrent with the appearance of the nucleation mode. Even in the one hour median size distribution parameters in Table 3 the N100 increased from 06:00 to 12:00 LT. This is due to the growth of the pre-existing Aitken mode particles, as is seen in the modal fits of the median diurnal distribution in Fig. 5. The growth of the
pre-25
ACPD
12, 24043–24093, 2012Long-term observations of
aerosol size distributions
V. Vakkari et al.
Title Page
Abstract Introduction
Conclusions References
Tables Figures
◭ ◮
◭ ◮
Back Close
Full Screen / Esc
Printer-friendly Version Interactive Discussion
Discussion
P
a
per
|
Dis
cussion
P
a
per
|
Discussion
P
a
per
|
Discussio
n
P
a
per
|
For Marikana the size distribution also presents a strong regional new particle forma-tion event in the midday (Fig. 4). However, in addiforma-tion to this the aerosol particle con-centration also increased in the early morning at sunrise (after 6 o’clock local time) and again in the evening at sunset (after 18 o’clock local time). The morning and evening peaks originate from domestic space heating and cooking in the surrounding informal
5
and semi-formal settlements (Venter et al., 2012; Hirsikko et al., 2012), which is seen also in the rise in CO concentration during corresponding time periods in Fig. 6.
The seasonal variation of sunrise and sunset times affects the Marikana median diur-nal variation (Fig. 4) similarly as discussed previously for Botsalano. The dependency on sunrise and sunset in Marikana is clearly seen in Fig. A2 in Appendix A, where
10
diurnal variation is plotted separately for each month.
The effect of the pyrometallurgical industry around Marikana is seen as a steep rise in the SO2 concentration after sunrise (Fig. 6). The peak in SO2 concentration at Marikana does not reflect a change in the emissions, as the industrial processes are continuous, but can rather be attributed to the development of the boundary layer
(Ven-15
ter et al., 2012). As the top of the boundary layer reaches the effective stack height, the SO2 emissions from the stacks reach the ground level and at the same time the mixing volume of the emissions is at its minimum, which leads to a peak in the ground level concentration (Venter et al., 2012). If Fig. 4 and 6 are compared, it seems that the emissions from the industry are mainly gaseous since there is no simultaneous
in-20
crease in the concentrations ofN50 andN100. The onset of the regional new particle formation event does occur at the same time as the increase in the SO2concentration; however, the calculated sulphuric acid proxy cannot explain the observed growth at Marikana (Hirsikko et al., 2012).
In addition to the regional new particle formation during daytime the nucleation mode
25
ACPD
12, 24043–24093, 2012Long-term observations of
aerosol size distributions
V. Vakkari et al.
Title Page
Abstract Introduction
Conclusions References
Tables Figures
◭ ◮
◭ ◮
Back Close
Full Screen / Esc
Printer-friendly Version Interactive Discussion
Discussion
P
a
per
|
Dis
cussion
P
a
per
|
Discussion
P
a
per
|
Discussio
n
P
a
per
|
new particle formation event may contribute significantly to the concentration of CCN-sized particles at Marikana.
The morning and evening peaks at Marikana do however not necessarily give a re-gionally representative picture of the size distribution for the entire mining and metallur-gical industrial region around Marikana, known as the western Igneous Bushveld
Com-5
plex (Venter et al., 2012; Hirsikko et al., 2012). This is because the nights in Marikana are calm and therefore the emissions from the household combustion accumulate close to the surface, which is seen also as dilution of the concentration after sunrise in Figs. 4, 6 and 7. Even though the early morning and evening peaks might not represent the regional aerosol, they characterise the emissions from informal settlements that have
10
not received much attention (Hirsikko et al., 2012), notwithstanding that such informal settlements are common around the cities in South Africa (Venter et al., 2012).
Of the previously published data sets selected for comparison in Table 1, diurnal variation is dominated by new particle formation all year round only in the Shangdianzi site in China (Shen et al., 2011). Also the Southern Great Plains site has higher total
15
concentration during midday and Sheridan et al. (2001) speculate this to be due to new particle formation. However, there is no size-resolved size distribution information available for the Southern Great Plains below 100 nm and therefore the source of the diurnal variation remains unknown (Sheridan et al., 2001). In Gual Pahari, India, the morning peak from traffic and the evening peak from heating and cooking dominate
20
the diurnal variation, although new particle formation is also seen as an increase in the total concentration during pre-monsoon and monsoon seasons (Hyv ¨arinen et al., 2009; Raatikainen et al., 2011).
The morning and evening peaks of the Gual Pahari size distribution diurnal variation are relatively similar to the Marikana diurnal variation, but the origin and timing of the
25
ACPD
12, 24043–24093, 2012Long-term observations of
aerosol size distributions
V. Vakkari et al.
Title Page
Abstract Introduction
Conclusions References
Tables Figures
◭ ◮
◭ ◮
Back Close
Full Screen / Esc
Printer-friendly Version Interactive Discussion
Discussion
P
a
per
|
Dis
cussion
P
a
per
|
Discussion
P
a
per
|
Discussio
n
P
a
per
|
diurnal variation in Rondonia, Brazil has a resemblance to the Marikana diurnal vari-ation in that the highest concentrvari-ations from biomass burning are had during evening and night-time, however, there is no or little new particle formation during daytime in Rondonia (Rissler et al., 2006). The best resemblance to the Marikana morning and evening peaks has been reported by Jayaratne and Verma (2001) from Gaborone,
5
Botswana, although their measurements only covered the size range above 100 nm. Jayaratne and Verma (2001) also interpreted the increase in evening concentration to originate in biomass burning for space heating.
3.3 Seasonal variation of the size distribution
The seasonality in the size distribution for both sites is strongest for theN100
concen-10
tration, i.e., the accumulation mode. For MarikanaN50 also exhibit seasonal variation in addition to the underlyingN100 seasonality. Comparing Fig. 8 and 9 shows how the highestN50 andN100 concentrations are concurrent with the highest CO concentra-tions.
Studying the correlation coefficient of hourly mean CO and N100 for each month
15
(Fig. 10) indicates how the months with higherN100 concentration also have a higher correlation between CO and N100, which implies that the seasonal variability of the size distribution is closely associated with incomplete burning for both Botsalano and Marikana. During the dry season, from May to September,N100 and CO are continu-ously relatively highly correlated with correlation coefficient above 0.7 for both locations.
20
The monthly average number of MODIS Burned Area product (Roy et al., 2008) fire observations within 500 km radius of each measurement location shown in Fig. 10 indicates that for Botsalano the highestN100 concentrations (Fig. 8) are reached at the peak of wild fire occurrence, i.e., September. In contrast, for Marikana the high-estN100 andN50 concentrations were observed already in July, which is the coldest
25
ACPD
12, 24043–24093, 2012Long-term observations of
aerosol size distributions
V. Vakkari et al.
Title Page
Abstract Introduction
Conclusions References
Tables Figures
◭ ◮
◭ ◮
Back Close
Full Screen / Esc
Printer-friendly Version Interactive Discussion
Discussion
P
a
per
|
Dis
cussion
P
a
per
|
Discussion
P
a
per
|
Discussio
n
P
a
per
|
continued high correlation of CO andN100, even after the diminishing need for domes-tic space heating in September. Even if only daytime data is selected for Marikana, the shape of the correlation with CO andN100 and theN100 seasonal variation stay un-changed; only the correlation with CO andN100 during the wet season (from October until April) is lower. The daytimeN50 andN12 indicate the seasonality of the formation
5
and growth rates (Hirsikko et al., 2012), which is reflected as increased concentrations during the wet season. However, the dry season peak inN50 andN100 still stays in July, which indicates that the household space heating and cooking remain a stronger source of particles than regional wild fires at Marikana even considering only daytime data.
10
The impact of burning, as wild fires and/or household combustion, alone cannot fully explain the relatively increase in the concentrations during the dry season. The absence of wet removal, combined with lower formation and growth rates during the dry season (Vakkari et al., 2011; Hirsikko et al., 2012) increases the relative importance of the afore-mentioned combustion source of aerosol particles during the dry season.
15
This is seen as a drop in the N100 and CO correlation at the beginning of the wet season (Fig. 10), which usually start after middle October.
Wild fires and agricultural biomass burning have been recognised as a major source of aerosol particles during the dry season also in the Amazon basin (Martin et al., 2010). However, there are no size distribution measurements covering the complete
20
seasonal cycle in the Amazon basin and therefore the full effect of the fires cannot be quantified (Martin et al., 2010). Rissler et al. (2006) reported the total aerosol concen-tration in Rondonia to be on average five times as high at the end of the dry season as during the early wet season. However, the measurements in Rondonia were con-ducted in an area with very intensive biomass burning, and therefore the results cannot
25
be considered representative of more pristine regions in the Amazon Basin although they are affected by the fires as well (Rissler et al., 2006; Martin et al., 2010).
ACPD
12, 24043–24093, 2012Long-term observations of
aerosol size distributions
V. Vakkari et al.
Title Page
Abstract Introduction
Conclusions References
Tables Figures
◭ ◮
◭ ◮
Back Close
Full Screen / Esc
Printer-friendly Version Interactive Discussion
Discussion
P
a
per
|
Dis
cussion
P
a
per
|
Discussion
P
a
per
|
Discussio
n
P
a
per
|
seems to be due to the monsoon seasonality rather than changes in the sources (Hyv ¨arinen et al., 2011; Raatikainen et al., 2011). Of the other measurement sites listed in Table 1 higher concentrations were reported during winter in Gaborone (Ja-yaratne and Verma, 2001) and Ispra (Asmi et al., 2011). However, the origin of the seasonality for Ispra is not discussed by Asmi et al. (2011) and therefore the only
com-5
parison locations where seasonality has previously been attributed to biomass burning are Rondonia (Rissler et al., 2006) and Gaborone, where the burning seems to origi-nate in space heating (Jayaratne and Verma, 2001). In Shangdianzi the seasonality is driven by new particle formation leading to highest concentrations in spring (Shen et al., 2011) and for the Southern Great Plains the highest concentrations of particles larger
10
than 100 nm are had during late summer, which has been attributed to windblown dust (Sheridan et al., 2001).
Therefore, barring the limited spatial coverage of the comparison data, outside of Southern Africa combustion seems to be the most important source of seasonal varia-tion in the size distribuvaria-tion only in the Amazon basin, although there are no long-term
15
data sets from the Amazon to quantify the effect over the complete seasonal cycle (Rissler et al., 2006; Martin et al., 2010). The seasonal median size distribution param-eters for both Botsalano and Marikana are collated in Table 4. Here summer is defined as December to February, autumn as March to May, winter as June to August and spring as September to November.
20
3.4 Spatial variation of the size distribution
Spatial variability of the size distributions was studied by combining the size distri-bution measurements with back-trajectories as by Vakkari et al. (2011). However, for Marikana anthropogenic sources in the surrounding 60 km long and 30 km wide valley are so strong that they dominate the air mass history and therefore only the data from
25
Botsalano could be used for this purpose.
ACPD
12, 24043–24093, 2012Long-term observations of
aerosol size distributions
V. Vakkari et al.
Title Page
Abstract Introduction
Conclusions References
Tables Figures
◭ ◮
◭ ◮
Back Close
Full Screen / Esc
Printer-friendly Version Interactive Discussion
Discussion
P
a
per
|
Dis
cussion
P
a
per
|
Discussion
P
a
per
|
Discussio
n
P
a
per
|
anthropogenic activity. The source areas N12, N50 and N100 at Botsalano can be divided further into four regions, as indicated in Fig. 11. The first two are the clean sector west of Botsalano, which is divided into two sub-regions, i.e., the Karoo region southwest of Botsalano and the Kalahari region northwest of Botsalano. The third is the industrial hub of South Africa located around the Johannesburg-Pretoria megacity
5
and the fourth is the anticyclonic re-circulation path (Tyson et al., 1996; Vakkari et al., 2011) that encircles the industrial hub of South Africa.
In order to obtain a more detailed picture of the size distribution within the source regions, back-trajectories were used to select a subset of the measurements best rep-resenting each source region. For the selection the time spent over each source region
10
in Fig. 11 was first calculated for each back-trajectory. The calculated times were then linearly interpolated to the DMPS time stamps, thus attributing to each size distribution a time the air mass had spend over each of the source regions. In this manner, each 10 min size distribution could be classified according to the criteria listed in Table 5, which resulted in a total of 17 000 10 min size distributions with well-defined source
re-15
gion origins. The criteria in Table 5 were set to select the air masses best representing each source region, while simultaneously minimizing the contribution from other source regions.
The median distributions for the four source regions are shown in Fig. 12, which confirms the differences between the regions defined in Fig. 11. In the clean sector
20
the Karoo size distribution is dominated by nucleation mode and in the Kalahari by accumulation mode. This can be explained by the different origin of air masses from the Karoo and the Kalahari source regions. The air masses from the Karoo source region frequently originate over the ocean, especially during times of arriving cold fronts sweeping over Southern Africa from the south-west. In contrast the Kalahari source
25
ACPD
12, 24043–24093, 2012Long-term observations of
aerosol size distributions
V. Vakkari et al.
Title Page
Abstract Introduction
Conclusions References
Tables Figures
◭ ◮
◭ ◮
Back Close
Full Screen / Esc
Printer-friendly Version Interactive Discussion
Discussion
P
a
per
|
Dis
cussion
P
a
per
|
Discussion
P
a
per
|
Discussio
n
P
a
per
|
of the aerosol. Therefore the Kalahari source region can be considered as an aged clean sector and the Karoo source region as a fresh clean sector for Botsalano.
To the east of Botsalano both the re-circulation and the industrial hub source regions have highN50 andN100 concentrations compared to the clean source regions. The industrial hub differs from the re-circulation by having a higher Aitken mode
concentra-5
tion and slightly lower N100 concentration, as is seen in Table 6. This indicates that the industrial hub aerosol is fresher than the re-circulation aerosol, which is reasonable since it contains most of the large point sources, e.g. at least 13 coal fired power station without de-SOx and de-NOx, several petrochemical plants, at least 13 pyrometallurgi-cal smelters and the mega-city of Johannesburg-Pretoria, with more than 10 million
10
inhabitants (Lourens et al., 2012). There are some individual large anthropogenic point sources also in the re-circulation source region, including one coal-fired power plant approximately 300 km northeast of Botsalano and the city of Gaborone 50 km north of Botsalano. However, there are certainly far less large anthropogenic point sources in the recirculation source region and they are also less concentrated in terms of
geo-15
graphical distribution.
Notwithstanding the relatively high total number concentration of the industrial hub source region, its concentration is more than three times lower than the measured concentration in Marikana, cf. Tables 1 and 2. At Marikana also the mean diameter is clearly lower than for the industrial hub source region at Botsalano, as seen in Fig. 12.
20
This demonstrates how after 200 km of transport over relatively clean area the industrial hub source region does not represent the size distribution at the sources.
While the differences in the anthropogenic activities are clear between the western and eastern source regions, the difference in the aerosol size distribution is partly of natural origin as well. The re-circulation and industrial hub source regions lie in the
sa-25
ACPD
12, 24043–24093, 2012Long-term observations of
aerosol size distributions
V. Vakkari et al.
Title Page
Abstract Introduction
Conclusions References
Tables Figures
◭ ◮
◭ ◮
Back Close
Full Screen / Esc
Printer-friendly Version Interactive Discussion
Discussion
P
a
per
|
Dis
cussion
P
a
per
|
Discussion
P
a
per
|
Discussio
n
P
a
per
|
which cannot be distinguished from anthropogenic sources in this analysis. Consid-ering the median distributions in Fig. 12 differences observed in the median diurnal variation for the defined source regions in Fig. 13 are not surprising. The re-circulation and industrial hub source regions have distinct new particle formation events at midday. The main difference is that the industrial hub source region’s new mode concentration
5
is higher than the re-circulation source region.
The Kalahari is the only source region that does not exhibit regional new particle formation in the median diurnal variation. This is probably due to smaller concentrations of both biogenic and anthropogenic precursors if compared to the re-circulation and industrial hub source regions, because the condensation sink in Kalahari is lower than
10
that of the eastern source regions (Vakkari et al., 2011). In the Karoo source region the combination of an even lower condensation sink than in the Kalahari source region to low growth rates (Vakkari et al., 2011) results in the nucleation mode being continuously present.
4 Conclusions
15
We have presented here a total of four years of submicron aerosol particle size distri-bution measurements from semi-clean and polluted Southern African savannah. Very few previous observations, extending below 100 nm and covering a full seasonal cycle, exist for this region. The median total concentration from 12 to 840 nm in the semi-clean Botsalano was 1850 particles cm−3. In the more polluted Marikana the total concen-20
tration was more than four times higher, median 7800 particles cm−3. The difference between the semi-clean and polluted median distributions was largest in the nucleation mode, partly because the nucleation mode was present for Marikana also at night-time. Regional new particle formation frequency for both Botsalano and Marikana is the highest ever recorded (Vakkari et al., 2011; Hirsikko et al., 2012) and at Botsalano the
25
ACPD
12, 24043–24093, 2012Long-term observations of
aerosol size distributions
V. Vakkari et al.
Title Page
Abstract Introduction
Conclusions References
Tables Figures
◭ ◮
◭ ◮
Back Close
Full Screen / Esc
Printer-friendly Version Interactive Discussion
Discussion
P
a
per
|
Dis
cussion
P
a
per
|
Discussion
P
a
per
|
Discussio
n
P
a
per
|
the effect of the heating and cooking in the informal and semi-formal settlements. Sur-prisingly the industry in Marikana does not have discernible direct effects on the size distribution, although the SO2shows clearly the emissions from the industry.
The seasonal variation of the size distribution is driven by emissions from incomplete combustion at both Botsalano and Marikana. At Botsalano the source of the
combus-5
tion is the regional wild fires and the highest concentrations ofN100 are in September, i.e., the end of the dry season and the peak of wild fire occurrence. In Marikana, how-ever, the seasonal variation in N100 and N50 originates from the domestic heating and cooking practises in the informal and semi-formal residential areas. Consequently the highest concentrations occur in July, which is the coldest month of the year. In
10
both locations theN100 and CO are correlated throughout the dry season from May to September.
Comparison of the data presented here to previously published long-term aerosol particle size distribution measurements carried out in comparable environments shows that Botsalano and Marikana have unique combinations of aerosol particle sources
15
and meteorological conditions. Especially the strong seasonal dependency on incom-plete burning differentiates the semi-clean and polluted savannah from the previous observations. The Amazon basin seems to be the only location outside Southern Africa where seasonality of the aerosol particle size distribution is dominated by wild fires and biomass burning, but the lack of measurements covering a full seasonal cycle does not
20
allow quantifying the effect of the combustion in the Amazon basin (Martin et al., 2010). The air mass history study revealed four different source regions for size distributions for Botsalano. For Marikana the large local sources made it impossible to distinguish source regions from the air mass history. Two of the source regions for Botsalano lie in the clean western sector: the north-western Kalahari region and the South-Western
25
ACPD
12, 24043–24093, 2012Long-term observations of
aerosol size distributions
V. Vakkari et al.
Title Page
Abstract Introduction
Conclusions References
Tables Figures
◭ ◮
◭ ◮
Back Close
Full Screen / Esc
Printer-friendly Version Interactive Discussion
Discussion
P
a
per
|
Dis
cussion
P
a
per
|
Discussion
P
a
per
|
Discussio
n
P
a
per
|
other hand, represents aged clean background air and is dominated by the accumula-tion mode and a nearly complete absence of the nucleaaccumula-tion mode. The concentraaccumula-tions from the Kalahari are lower than from the eastern sector.
In the eastern sector from Botsalano the difference between the re-circulation and the industrial hub source regions is that the industrial hub has higher concentration
5
in Aitken mode, a sign of fresh aerosol. The N100 concentration from the eastern source regions is at least twice as high as the N100 in the western source regions and compared to the fresh clean air from the Karoo source region up to four times as high. However, the difference between the clean and polluted source regions is not only anthropogenic, but partly also natural as the eastern sector has higher biological
10
activity and therefore higher aerosol particle formation and growth rates (Vakkari et al., 2011).
Appendix A
Seasonal variation of the aerosol size distribution diurnal variation is presented in
15
Fig. A1 for Botsalano and in Fig. A2 for Marikana.
Supplementary material related to this article is available online at: http://www.atmos-chem-phys-discuss.net/12/24043/2012/
acpd-12-24043-2012-supplement.zip.
Acknowledgements. The authors acknowledge the financial support by the Academy of
Fin-20
land under the projects Air pollution in Southern Africa (APSA) (project number 117505) and Atmospheric monitoring capacity building in Southern Africa (project number 132640) and by the European Commission 6th Framework program project EUCAARI, contract no 036833-2 (EUCAARI). The support of Rustenburg local municipality is gratefully acknowledged. The au-thors thank Head of Botsalano game reserve, M. Khukhela and the game reserve employees 25
ACPD
12, 24043–24093, 2012Long-term observations of
aerosol size distributions
V. Vakkari et al.
Title Page
Abstract Introduction
Conclusions References
Tables Figures
◭ ◮
◭ ◮
Back Close
Full Screen / Esc
Printer-friendly Version Interactive Discussion
Discussion
P
a
per
|
Dis
cussion
P
a
per
|
Discussion
P
a
per
|
Discussio
n
P
a
per
|
References
Air Resources Laboratory, Gridded Meteorological Data Archives, available at: http://www.arl. noaa.gov/archives.php, last access: 9 August 2011.
Asmi, A., Wiedensohler, A., Laj, P., Fjaeraa, A.-M., Sellegri, K., Birmili, W., Weingartner, E., Bal-tensperger, U., Zdimal, V., Zikova, N., Putaud, J.-P., Marinoni, A., Tunved, P., Hansson, H.-C., 5
Fiebig, M., Kivek ¨as, N., Lihavainen, H., Asmi, E., Ulevicius, V., Aalto, P. P., Swietlicki, E., Kris-tensson, A., Mihalopoulos, N., Kalivitis, N., Kalapov, I., Kiss, G., de Leeuw, G., Henzing, B., Harrison, R. M., Beddows, D., O’Dowd, C., Jennings, S. G., Flentje, H., Weinhold, K., Mein-hardt, F., Ries, L., and Kulmala, M.: Number size distributions and seasonality of submicron particles in Europe 2008–2009, Atmos. Chem. Phys., 11, 5505–5538, doi:10.5194/acp-11-10
5505-2011, 2011.
Beukes, J. P., Dawson, N. F. and Van Zyl, P. G.: Theoretical and practical aspects of Cr(VI) in the South African FeCr industry, S. African Inst. Min. M., 110, 743–750, 2010.
Charlson, R. J.: Atmospheric visibility related to aerosol mass concentration: review, Environ. Sci. Technol., 3, 913–918, doi:10.1021/es60033a002, 1969.
15
Draxler, R. R. and Hess, G. D.: Description of the HYSPLIT 4 Modelling System, NOAA Tech-nical Memorandum ERL ARL–224, 2004.
Forster, P., Ramaswamy, V., Artaxo, P., Berntsen, T., Betts, R., Fahey, D. W., Haywood, J., Lean, J., Lowe, D. C., Myhre, G., Nganga, J., Prinn, R., Raga, G., Schulz, M., and Van Dor-land, R.: Changes in Atmospheric Constituents and in Radiative Forcing. In: Climate Change 20
2007: The Physical Science Basis. Contribution of Working Group I to the Fourth Assess-ment Report of the IntergovernAssess-mental Panel on Climate Change, edited by: Solomon, S., Qin, D., Manning, M., Chen, Z., Marquis, M., Averyt, K. B., Tignor, M., and Miller, H. L., Cambridge University Press, Cambridge, UK and New York, NY, USA, 136, 2007.
Friedl, M. A., McIver, D. K., Hodges, J. C. F., Zhang, X. Y., Muchoney, D., Strahler, A. H., Wood-25
cock, C. E., Gopal, S., Schneider, A., Cooper, A., Baccini, A., Gao, F., and Schaaf, C.: Global land cover mapping from MODIS: algorithms and early results, Remote Sens. Environ., 83, 287–302, doi:10.1016/S0034-4257(02)00078-0, 2002.
Gustafsson, ¨O., Krusa, M., Zencak, Z., Sheesley, R. J., Granat, L., Engstr ¨om, E., Praveen, P. S.,
Rao, P. S. P., Leck, C., and Rodhe, H.: Brown clouds over South Asia: biomass or fossil fuel 30
ACPD
12, 24043–24093, 2012Long-term observations of
aerosol size distributions
V. Vakkari et al.
Title Page
Abstract Introduction
Conclusions References
Tables Figures
◭ ◮
◭ ◮
Back Close
Full Screen / Esc
Printer-friendly Version Interactive Discussion
Discussion
P
a
per
|
Dis
cussion
P
a
per
|
Discussion
P
a
per
|
Discussio
n
P
a
per
|
Haywood, J., Francis, P., Dubovik, O., Glew, M., and Holben, B.: Comparison of aerosol size distributions, radiative properties, and optical depths determined by aircraft ob-servations and Sun photometers during SAFARI 2000, J. Geophys. Res., 108, 8471, doi:10.1029/2002JD002250, 2003a.
Haywood, J. M., Osborne, S. R., Francis, P. N., Keil, A., Formenti, P., Andreae, M. O., and 5
Kaye, P. H.: The mean physical and optical properties of regional haze dominated by biomass burning aerosol measured from the C-130 aircraft during SAFARI 2000, J. Geophys. Res., 108, 8473, doi:10.1029/2002JD002226, 2003b.
Hirsikko, A., Vakkari, V., Tiitta, P., Manninen, H. E., Gagn ´e, S., Laakso, H., Kulmala, M., Mirme, A., Mirme, S., Mabaso, D., Beukes, J. P., and Laakso, L.: Characterisation of sub-10
micron particle number concentrations and formation events in the western Bushveld Ig-neous Complex, South Africa, Atmos. Chem. Phys., 12, 3951–3967, doi:10.5194/acp-12-3951-2012, 2012.
Hobbs, P. V., Sinha, P., Yokelson, R. J., Christian, T. J., Blake, D. R., Gao, S., Kirchstetter, T. W., Novakov, T., and Pilewskie, P.: Evolution of gases and particles from a savannah fire in South 15
Africa, J. Geophys. Res., 108, 8485, doi:10.1029/2002JD002352, 2003.
Hoppel, W. A.: Determination of the aerosol size distribution from the mobility distribution of the charged fraction of aerosols, J. Aerosol Sci., 9, 41–54, 1978.
Hyv ¨arinen, A.-P., Lihavainen, H., Komppula, M., Sharma, V. P., Kerminen, V.-M., Panwar, T. S., and Viisanen, Y.: Continuous measurements of optical properties of atmospheric aerosols in 20
Mukteshwar, Northern India, J. Geophys. Res., 114, D08207, doi:10.1029/2008JD011489, 2009.
Hyv ¨arinen, A.-P., Raatikainen, T., Komppula, M., Mielonen, T., Sundstr ¨om, A.-M., Brus, D.,
Pan-war, T. S., Hooda, R. K., Sharma, V. P., de Leeuw, G., and Lihavainen, H.: Effect of the
sum-mer monsoon on aerosols at two measurement stations in Northern India – Part 2: Physical 25
and optical properties, Atmos. Chem. Phys., 11, 8283–8294, doi:10.5194/acp-11-8283-2011, 2011.
Jayaratne, E. R. and Verma, T. S.: The impact of biomass burning on the environmental aerosol concentration in Gaborone, Botswana, Atmos. Environ., 35, 1821–1828, 2001.
Jokinen, V. and M ¨akel ¨a, J. M.: Closed loop arrangement with critical orifice for DMA 30
sheath/excess flow system, J. Aerosol Sci., 28, 643–648, 1997.
ACPD
12, 24043–24093, 2012Long-term observations of
aerosol size distributions
V. Vakkari et al.
Title Page
Abstract Introduction
Conclusions References
Tables Figures
◭ ◮
◭ ◮
Back Close
Full Screen / Esc
Printer-friendly Version Interactive Discussion
Discussion
P
a
per
|
Dis
cussion
P
a
per
|
Discussion
P
a
per
|
Discussio
n
P
a
per
|
and O’Dowd, C. D.: Introduction: European Integrated Project on Aerosol Cloud Climate and Air Quality interactions (EUCAARI) – integrating aerosol research from nano to global scales, Atmos. Chem. Phys., 9, 2825–2841, doi:10.5194/acp-9-2825-2009, 2009.
Kulmala, M., Asmi, A., Lappalainen, H. K., Baltensperger, U., Brenguier, J.-L., Facchini, M. C., Hansson, H. C., Hov, Ø., O’Dowd, C. D., P ¨oschl, U., Wiedensohler, A., Boers, R., Boucher, O., 5
de Leeuw, G., Denier van der Gon, H. A. C., Feichter, J., Krejci, R., Laj, P., Lihavainen, H., Lohmann, U., McFiggans, G., Mentel, T., Pilinis, C., Riipinen, I., Schulz, M., Stohl, A., Swi-etlicki, E., Vignati, E., Alves, C., Amann, M., Ammann, M., Arabas, S., Artaxo, P., Baars, H., Beddows, D. C. S., Bergstr ¨om, R., Beukes, J. P., Bilde, M., Burkhart, J. F., Canonaco, F., Clegg, S. L., Coe, H., Crumeyrolle, S., D’Anna, B., Decesari, S., Gilardoni, S., Fischer, M., 10
Fjaeraa, A. M., Fountoukis, C., George, C., Gomes, L., Halloran, P., Hamburger, T.,
Har-rison, R. M., Herrmann, H., Hoffmann, T., Hoose, C., Hu, M., Hyv ¨arinen, A., H ˜orrak, U.,
Iinuma, Y., Iversen, T., Josipovic, M., Kanakidou, M., Kiendler-Scharr, A., Kirkev ˚ag, A., Kiss, G., Klimont, Z., Kolmonen, P., Komppula, M., Kristj ´ansson, J.-E., Laakso, L., Laakso-nen, A., Labonnote, L., Lanz, V. A., LehtiLaakso-nen, K. E. J., Rizzo, L. V., MakkoLaakso-nen, R., Man-15
ninen, H. E., McMeeking, G., Merikanto, J., Minikin, A., Mirme, S., Morgan, W. T., Ne-mitz, E., O’Donnell, D., Panwar, T. S., Pawlowska, H., Petzold, A., Pienaar, J. J., Pio, C., Plass-Duelmer, C., Pr ´ev ˆot, A. S. H., Pryor, S., Reddington, C. L., Roberts, G., Rosenfeld, D., Schwarz, J., Seland, Ø., Sellegri, K., Shen, X. J., Shiraiwa, M., Siebert, H., Sierau, B., Simp-son, D., Sun, J. Y., Topping, D., Tunved, P., Vaattovaara, P., Vakkari, V., Veefkind, J. P., Viss-20
chedijk, A., Vuollekoski, H., Vuolo, R., Wehner, B., Wildt, J., Woodward, S., Worsnop, D. R.,
van Zadelhoff, G.-J., Zardini, A. A., Zhang, K., van Zyl, P. G., Kerminen, V.-M., S Carslaw, K.,
and Pandis, S. N.: General overview: European Integrated project on Aerosol Cloud Climate and Air Quality interactions (EUCAARI) – integrating aerosol research from nano to global scales, Atmos. Chem. Phys., 11, 13061–13143, doi:10.5194/acp-11-13061-2011, 2011. 25
Laakso, L., Koponen, I. K., M ¨onkk ¨onen, P., Kulmala, M., Kerminen, V.-M., Wehner, B., Wieden-sohler, A., Wu, Z., and Hu, M.: Aerosol particles in the developing world; a comparison be-tween New Delhi in India and Beijing in China, Water Air Soil Poll., 173, 5–20, 2006.
Laakso, L., Laakso, H., Aalto, P. P., Keronen, P., Pet ¨aj ¨a, T., Nieminen, T., Pohja, T., Siivola, E., Kulmala, M., Kgabi, N., Molefe, M., Mabaso, D., Phalatse, D., Pienaar, K., and Kerminen, V.-30