NPGD
1, 917–952, 2014Hybrid
variational-ensemble assimilation
K. Apodaca et al.
Title Page
Abstract Introduction
Conclusions References
Tables Figures
◭ ◮
◭ ◮
Back Close
Full Screen / Esc
Printer-friendly Version Interactive Discussion
Discussion
P
a
per
|
D
iscussion
P
a
per
|
Discussion
P
a
per
|
Discuss
ion
P
a
per
|
Nonlin. Processes Geophys. Discuss., 1, 917–952, 2014 www.nonlin-processes-geophys-discuss.net/1/917/2014/ doi:10.5194/npgd-1-917-2014
© Author(s) 2014. CC Attribution 3.0 License.
Open Access
Nonlinear Processes in Geophysics
Discussions
This discussion paper is/has been under review for the journal Nonlinear Processes in Geophysics (NPG). Please refer to the corresponding final paper in NPG if available.
Hybrid variational-ensemble assimilation
of lightning observations in a mesoscale
model
K. Apodaca1, M. Zupanski1, M. DeMaria2,*, J. A. Knaff2, and L. D. Grasso1
1
Colorado State University/Cooperative Institute for Research in the Atmosphere, Fort Collins, Colorado, USA
2
NOAA Center for Satellite Research and Applications, Fort Collins, Colorado, USA
*
now at: Technology and Science Branch, National Hurricane Center, Miami, Florida, USA
Received: 14 April 2014 – Accepted: 27 April 2014 – Published: 13 May 2014
Correspondence to: K. Apodaca ([email protected])
NPGD
1, 917–952, 2014Hybrid
variational-ensemble assimilation
K. Apodaca et al.
Title Page
Abstract Introduction
Conclusions References
Tables Figures
◭ ◮
◭ ◮
Back Close
Full Screen / Esc
Printer-friendly Version Interactive Discussion
Discussion
P
a
per
|
D
iscussion
P
a
per
|
Discussion
P
a
per
|
Discuss
ion
P
a
per
|
Abstract
Lightning measurements from the Geostationary Lightning Mapper (GLM) that will be aboard the Goestationary Operational Environmental Satellite – R Series will bring new information that can have the potential for improving the initialization of numeri-cal weather prediction models by assisting in the detection of clouds and convection
5
through data assimilation. In this study we focus on investigating the utility of lightning observations in mesoscale and regional applications suitable for current operational environments, in which convection cannot be explicitly resolved. Therefore, we exam-ine the impact of lightning observations on storm environment. Preliminary steps in developing a lightning data assimilation capability suitable for mesoscale modeling are
10
presented in this paper. World Wide Lightning Location Network (WWLLN) data was utilized as a proxy for GLM measurements and was assimilated with the Maximum Likelihood Ensemble Filter, interfaced with the Nonhydrostatic Mesoscale Model core of the Weather Research and Forecasting system (WRF-NMM). In order to test this methodology, regional data assimilation experiments were conducted. Results indicate
15
that lightning data assimilation had a positive impact on the following: information con-tent, influencing several dynamical variables in the model (e.g., moisture, temperature, and winds), improving initial conditions, and partially improving WRF-NMM forecasts during several data assimilation cycles.
1 Introduction 20
Thunderstorms are an important component of the climate system as they can impact the atmospheric environment around them; they are capable of redistributing mois-ture, heat, and wind patterns (Price, 2013). The assimilation of lighting observations is a relatively new field. Several efforts to incorporate lightning data into Numerical Weather Prediction (NWP) models have been made recently (Alexander et al., 1999;
25
NPGD
1, 917–952, 2014Hybrid
variational-ensemble assimilation
K. Apodaca et al.
Title Page
Abstract Introduction
Conclusions References
Tables Figures
◭ ◮
◭ ◮
Back Close
Full Screen / Esc
Printer-friendly Version Interactive Discussion
Discussion
P
a
per
|
D
iscussion
P
a
per
|
Discussion
P
a
per
|
Discuss
ion
P
a
per
|
et al., 2012). In the vast majority of these studies dynamical relaxation, or nudging techniques were applied. Even though these studies highlighted the importance of uti-lizing lightning observations to improve the representation of convection in models, they had less emphasis on improving the environmental conditions.
Motivated by the initial success of nudging techniques in cloud-resolving model
ap-5
plications, the objective of this study is to investigate if lightning observations can be useful in mesoscale, regional, and global applications at a coarse resolution, in which convection cannot be explicitly resolved. Therefore, we would like to evaluate the im-pact of lightning observations on the environment around storms, with potential implica-tions to data assimilation, reanalysis, and climate studies. As for any other observation,
10
the information from lightning observations can have impacts at several spatiotemporal scales. In the case of lightning, one can assume that most of the information relates to cloud-resolving processes. However, there should be also a fraction of lightning infor-mation that can spread into larger scales (e.g., the storm environment). In this study we will evaluate the large-scale component of information from lightning observations.
15
We anticipate that a myriad of applications can stem from monitoring lightning ac-tivity. For instance, the lack of ground-based observations (e.g., radiosondes, radars, etc.) over the open oceans can result in deficient initialization of numerical weather and climate prediction models, especially if weather systems that develop in these regions subsequently travel to continental landmasses. Satellite radiances are an important
20
source of observations over the oceans. However, processing satellite observations requires considerably more computational time due to the use of radiative transfer models, rather than just processing lightning observations, which is computationally less intensive. Therefore, the incorporation of this new type of data can fill in the obser-vational void and provide useful information for model initialization.
25
In addition, lightning may have a significant impact on the Earth’s climate by pro-ducing nitrogen oxides (NOx) in the upper troposphere. NOx is a precursor of ozone,
NPGD
1, 917–952, 2014Hybrid
variational-ensemble assimilation
K. Apodaca et al.
Title Page
Abstract Introduction
Conclusions References
Tables Figures
◭ ◮
◭ ◮
Back Close
Full Screen / Esc
Printer-friendly Version Interactive Discussion
Discussion
P
a
per
|
D
iscussion
P
a
per
|
Discussion
P
a
per
|
Discuss
ion
P
a
per
|
large uncertainties. Incorporating geo-located lightning data may assist these models in the simulation of convection, and consequently NOx emissions.
Lightning might be useful in future climate change monitoring studies due to the interplay between lightning and atmospheric parameters, such as, temperature, upper tropospheric water vapor, and cloud cover (Price, 2013). Since lightning can be easily
5
monitored through surface networks and satellite platforms it can be a useful tool for tracking changes in important climate parameters in the future (Price, 2009).
Satellite instruments have been launched in the past with the objective of studying storm dynamics, cloud characteristics, annual and inter-annual variability of thunder-storms, etc. (Adamo et al., 2009). In 1997, the Lightning Imaging Sensor (LIS) was
10
launched aboard de joint National Aeronautics and Space Administration (NASA) and the Japan Aerospace Exploration Agency (JAXA) Tropical Rainfall Measuring Mission (TRMM). This instrument can detect lightning activity continuously at a horizontal res-olution of 4 km over the tropics (http://trmm.gsfc.nasa.gov/overview_dir/lis.html).
In the near future, mapping of lightning from geostationary orbit at cloud scale
15
resolution will be possible, thus complementing established surface detection net-works (Adamo et al., 2009; Finke, 2009). The launch of the Geostationary Lightning Mapper (GLM) instrument that will be aboard the next generation of the National Oceanic and Atmospheric Administration (NOAA) geostationary satellites (i.e., GOES-R, http://www.goes-r.gov/spacesegment/glm.html) will allow continuous day and night
20
monitoring of total lightning activity over the Americas and adjacent ocean regions up to 52◦north. One of the advantages over previous lightning mapping instruments is that it will be able to monitor weather affecting the adjacent ocean regions of the continen-tal US and not just the tropics. Some of the mission objectives for the GLM instrument include: improvement in severe thunderstorm lead times and false alarm reduction,
ad-25
NPGD
1, 917–952, 2014Hybrid
variational-ensemble assimilation
K. Apodaca et al.
Title Page
Abstract Introduction
Conclusions References
Tables Figures
◭ ◮
◭ ◮
Back Close
Full Screen / Esc
Printer-friendly Version Interactive Discussion
Discussion
P
a
per
|
D
iscussion
P
a
per
|
Discussion
P
a
per
|
Discuss
ion
P
a
per
|
In this paper the possibility of assimilating lightning observations within a hybrid variational-ensemble system in a mesoscale numerical weather prediction model is explored, focusing on the typical resolution of operational weather forecasting and cli-mate models. The methodologies presented herein represent an initial stage towards developing a comprehensive, multivariate, multi-scale, multi-sensor data assimilation
5
system that prepares for the assimilation of lightning data along with other types of observations.
Eventually, this data assimilation technique will be tested in different applications at various time and length scales. In the mean time, we intend to investigate if the assimilation of lightning data can (1) add information content into a mesoscale
model-10
ing system that can resolve a convective environment, rather than explicit convection, (2) positively impact the dynamical variables of the model, and (3) improve analysis and prediction. Note that a coarse resolution is also typical of climate models, and thus assessing the utility of lightning observations in data assimilation at these scales can be relevant for climate studies as well. To our knowledge, lightning data have not been
15
used in operational weather prediction, in climate monitoring studies, or in reanalysis. By assimilating lightning data in a coarse resolution model we are taking first steps toward extending their use to weather and climate applications.
As a proof of concept case we chose the mesoscale convective system that spawned numerous tornados over the southeastern US on 27–28 April 2011. Lightning data from
20
the World Wide Lightning Location Network (WWLLN, http://webflash.ess.washington. edu) was used as a proxy to test the potential impact of the assimilation of lightning flash rates measured by the GLM. This data network has global coverage, including ocean regions. For North America, this lightning detection network better approximates the coverage of the upcoming GLM instrument compared to some surface networks
25
that primarily cover the continental US.
NPGD
1, 917–952, 2014Hybrid
variational-ensemble assimilation
K. Apodaca et al.
Title Page
Abstract Introduction
Conclusions References
Tables Figures
◭ ◮
◭ ◮
Back Close
Full Screen / Esc
Printer-friendly Version Interactive Discussion
Discussion
P
a
per
|
D
iscussion
P
a
per
|
Discussion
P
a
per
|
Discuss
ion
P
a
per
|
(WRF-NMM – Janjićet al., 2010). The simplified microphysics and low-resolution of the model defined the spatiotemporal scales for data assimilation, as well as the options for the employed observation operator. In this case, a 6 h data assimilation window was chosen (±3 h from a central time), in which the lightning observations were averaged at a horizontal resolution of 10 km closely matching that of the innermost domain of
5
WRF-NMM.
This paper is organized in the following manner: the methodology for using lightning observations is described in Sect. 2, details on the experimental design are provided in Sect. 3, followed by results in Sect. 4, and finally a summary and future work are presented in Sect. 5.
10
2 Methodology for utilizing lightning observations
2.1 Data assimilation system
WRF-NMM was interfaced with MLEF, a hybrid ensemble-variational data assimilation method developed at Colorado State University. The solution of the analysis maxi-mizes the likelihood of the posterior probability distribution, obtained by a minimization
15
of a cost function that includes a general nonlinear observation operator. As in typ-ical variational and ensemble data assimilation methods, a cost function is derived using a Gaussian probability density function framework. Like other ensemble data assimilation algorithms, MLEF produces an estimate of the analysis uncertainty (e.g., analysis error covariance). In addition to the common use of ensembles in calculations
20
of the forecast error covariance, the ensembles in MLEF are exploited to efficiently calculate the Hessian preconditioning and the gradient of a cost function. The MLEF method is well suited for use with highly nonlinear observation operators, for a small additional computational cost of the minimization procedure. Relevant prognostic WRF-NMM variables were selected as control variables, as they can significantly impact the
25
NPGD
1, 917–952, 2014Hybrid
variational-ensemble assimilation
K. Apodaca et al.
Title Page
Abstract Introduction
Conclusions References
Tables Figures
◭ ◮
◭ ◮
Back Close
Full Screen / Esc
Printer-friendly Version Interactive Discussion
Discussion
P
a
per
|
D
iscussion
P
a
per
|
Discussion
P
a
per
|
Discuss
ion
P
a
per
|
following variables: temperature (T), specific humidity (q), hydrostatic pressure depth (PD), theU and V components of the wind, and total cloud condensate (CWM) that combines all cloud hydrometeors into a total sum. The goal is to minimize the following cost function:
J(x)=1 2[x−x
f]TP−1 f [x−x
f]+1
2[y−h(x)]
TR−1[y−h(x)] (1)
5
wherexrepresents the above defined control variables with a forecast error covariance
Pf, the index f denotes the forecast guess,y is the lightning flash rate observations with
an error covarianceR, andhis the nonlinear lightning observation operator that maps the control variables to the lightning flash rate observations. The superscript T indicates the transpose of a matrix.
10
2.2 Lightning flash rate observations
Since the actual lightning measurements are lightning strikes, while the lightning ob-servation operator is commonly related to lightning flash rates, it was necessary to transform lightning strikes into flash rates. In doing so, a subset domain containing all lightning strikes was defined and subsequently partitioned into a rectangular
horizon-15
tal grid (different from the model grid), with a spacing of 0.1◦ (∼10 km) in order to be comparable with the horizontal grid spacing of the smallest domain of our model con-figuration that will be discussed in Sect. 3.2. Lightning strikes counted in each local area surrounding a grid point during a 6 h time window coinciding with the data as-similation interval were assigned to a particular grid point, and then divided by a time
20
interval to form lightning flash rates. Therefore, the lightning flash rate observations are grid-point values that represent a cumulative count of geo-located lightning strikes over the 6 h assimilation time window (±3 h from a central time), rather than the instanta-neous measurements. Note that the observed lightning flash rates were assumed to be greater than zero, i.e., the observation grid points without any lightning strikes were
25
NPGD
1, 917–952, 2014Hybrid
variational-ensemble assimilation
K. Apodaca et al.
Title Page
Abstract Introduction
Conclusions References
Tables Figures
◭ ◮
◭ ◮
Back Close
Full Screen / Esc
Printer-friendly Version Interactive Discussion
Discussion
P
a
per
|
D
iscussion
P
a
per
|
Discussion
P
a
per
|
Discuss
ion
P
a
per
|
2.3 Lightning flash rate observation operator
The lightning flash rate observation operatorh(Eq. 1) includes two operations: a trans-formation (h1) and an interpolation (h2), i.e.,h=h1h2. In this study the forward
light-ning transformation operator (h1) was adopted by exploiting the relationship between
lightning and vertical velocity. This choice was influenced by the properties of a bulk
5
microphysics scheme used in the WRF-NMM model (e.g., Ferrier, 2005), and by the coarse assimilation time window that effectively restricts using the cloud-scale informa-tion about hydrometeors and their interacinforma-tions. A bi-linear interpolainforma-tion technique was used to interpolate lightning observations to the model grid (h2).
As seen in previous studies, lightning is related to updrafts that support a deep layer
10
of super-cooled water droplets and a mixed phase region where charge separation occurs (Black and Hallet, 1999). Based on Price and Rind (1992), an empirical rela-tionship between maximum updraft velocity (wmax) and lightning flash rate (f) given by:
h2=f =cwmaxβ (2)
15
was used, under the assumption that updrafts are positively correlated to cloud top height. Wherec=5×10⁻⁶andβ=4.5 are empirical parameters.βis a value derived from satellite data climatologies for continental clouds as in Price and Rind (1992).
The procedure to develop the lightning observation operator started with an approx-imate calculation of vertical velocity from WRF-NMM, through the use of a reduced
20
version from the nonhydrostatic continuity equation
w≈ 1
g
∂Φ
∂t +v· ∇σΦ +σ˙ ∂Φ
∂t
(3)
wherew is the vertical velocity,gis the gravity constant,Φis the geopotential,v is the horizontal wind vector, andσis the vertical velocity in a sigma coordinate (Janjić, 2005). An approximation was required because vertical velocity is not a predictive, but rather
NPGD
1, 917–952, 2014Hybrid
variational-ensemble assimilation
K. Apodaca et al.
Title Page
Abstract Introduction
Conclusions References
Tables Figures
◭ ◮
◭ ◮
Back Close
Full Screen / Esc
Printer-friendly Version Interactive Discussion
Discussion
P
a
per
|
D
iscussion
P
a
per
|
Discussion
P
a
per
|
Discuss
ion
P
a
per
|
a diagnostic variable in WRF-NMM. After an approximate value of vertical velocity was obtained, the maximum vertical velocity was calculated for horizontal points according to the following procedure: values of CWM≥10−5 were searched for at each model grid point and neighboring points along all vertical model levels. This procedure was applied to avoid taking into account values of wmax in regions without clouds. If the 5
CWM threshold was reached, the value of wmax was calculated at a grid point and
surrounding points at all vertical levels, otherwisewmaxwas set to zero. Once the value ofwmax was calculated, it was possible to calculate values of lightning flash rate from
Eq. (2). Since the calculation of w (e.g., Eq. 3) and wmax includes prognostic model
variables, all control variables can impact lightning flash rates.
10
Since both a new observation type (lightning flash rate) and an untested observation operator (Eq. 2) were introduced into the data assimilation system, statistics of innova-tion vectors (observainnova-tion minus guess) of lightning flash rates needed to be examined first. Figure 1 shows the statistics of the normalized innovation vectorsR−1/2[y−h(xf)] at several observation times. A skewed histogram of the Probability Distribution
Func-15
tion (PDF) innovation vectors (left) can be readily seen, implicitly indicating that the observed values of lightning flash rate were considerably larger than the guess. There-fore, it was necessary to perform a correction. An option could have been to increase the value of parametercin Eq. (2) to reduce the skewness. However, trial experiments indicated a large uncertainty of the parametercfrom one observation time to another,
20
in occasions ranging over two orders of magnitude. In order to deal with this error of the observation operator (Eq. 2), an adjustable multiplicative correction parameter (α >0) was included so thath2 would becomeαh2. At each observation time an optimal
pa-rameterαoptwas estimated by minimizing the following cost function:
J(α)=1
2[log(α)−log(α0)]
TW−1[log(α)−log(α 0)]
+1
2[log(y)−log(αh(x
f
))]TR−L1[log(y)−log(αh(xf
))],
(4)
NPGD
1, 917–952, 2014Hybrid
variational-ensemble assimilation
K. Apodaca et al.
Title Page
Abstract Introduction
Conclusions References
Tables Figures
◭ ◮
◭ ◮
Back Close
Full Screen / Esc
Printer-friendly Version Interactive Discussion
Discussion
P
a
per
|
D
iscussion
P
a
per
|
Discussion
P
a
per
|
Discuss
ion
P
a
per
|
whereRL is the observation error covariance associated with a logarithmic transfor-mation,α0 is a guess value, andW is the uncertainty matrix of the guess value. The
choice of a logarithmic transformation was influenced by the fact that lightning flash rate is strictly positive definite and that such procedure could better deal with the large uncertainty of the parameterα. As shown in the appendix (Sect. 7), the solution ofαopt, 5
which minimizes the cost function, i.e., Eq. (4), is given by:
αopt=exp
1 Nobs
PNobs i=1 log
y
h(x)
i
1+ r0 w0
, (5)
whereNobs is the number of observations, diag(W)=w0 and diag(RL)=r0. Therefore
the lightning observation transformation operator (Eq. 2) was substituted by
h2=f =αoptcwmaxβ . (6)
10
The flow diagram of the data assimilation system and the lightning observation operator are illustrated in Fig. 2.
2.4 Information content of lightning observations
In general terms, the impact of observations can be quantified using an uncertainty reduction after data assimilation. Since entropy measures the uncertainty, one can use
15
the formalism of Shannon information theory (Shannon and Weaver, 1949) to define information content of observations as an entropy difference before and after data as-similation. As shown in Rodgers (2000), the entropy is considerably simplified with a Gaussian probability assumption and information content can be conveniently ex-pressed in terms of degrees of freedom for signal (ds),
20
ds=trace
h
I−PaP
−1 f
i
NPGD
1, 917–952, 2014Hybrid
variational-ensemble assimilation
K. Apodaca et al.
Title Page
Abstract Introduction
Conclusions References
Tables Figures
◭ ◮
◭ ◮
Back Close
Full Screen / Esc
Printer-friendly Version Interactive Discussion
Discussion
P
a
per
|
D
iscussion
P
a
per
|
Discussion
P
a
per
|
Discuss
ion
P
a
per
|
where trace is the trace function,Iis the identity matrix, and Pa is the analysis error covariance. This can be further reduced in terms of the eigenvalues of the observation information matrix, given by:
PTf/2HTR−1HP1f/2=UΛUT (8)
whereΛand Uare the eigenvalues and eigenvectors matrices, respectively, andHis
5
the Jacobian of the observation operator. The degrees of freedom for signal are then
ds=
X
i
λ2i
1+λ2
i
(9)
whereλi are the diagonal elements of the eigenvalues matrix. Zupanski et al. (2007) showed that this formula could also be useful in reduced-rank, ensemble space cal-culations, in which the summation is performed over the number of ensembles. Since
10
an eigenvalue decomposition of the observation information matrix is a component of the MLEF algorithm, additional cost of calculatingdsis minimal. By calculating the
de-grees of freedom for signal we can quantify the impact of the lightning observations in terms of an uncertainty reduction. Note that Eq. (9) has non-negative values between 0 andNens, depending on the structure of the observation information matrix. If there 15
is a negligible impact of lightning observations the number of degrees of freedom for signal will be close to zero, i.e., much smaller than the number of ensembles.
3 Experimental design
3.1 General synoptic description of the case study
As a proof of concept case for regional lightning data assimilation over a continental
20
NPGD
1, 917–952, 2014Hybrid
variational-ensemble assimilation
K. Apodaca et al.
Title Page
Abstract Introduction
Conclusions References
Tables Figures
◭ ◮
◭ ◮
Back Close
Full Screen / Esc
Printer-friendly Version Interactive Discussion
Discussion
P
a
per
|
D
iscussion
P
a
per
|
Discussion
P
a
per
|
Discuss
ion
P
a
per
|
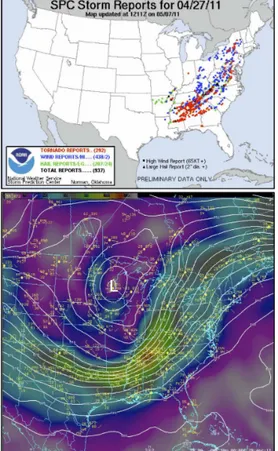
an estimated 292 tornadoes hit the southeastern, mid-west and northeast US, accord-ing to the Storm Report Center (Fig. 3, top panel). A figure of 500 hPa heights, with color contours of wind speed and surface observations from the Forecast Systems Laboratory (Fig. 3, bottom panel) shows that atmospheric conditions created a perfect scenario for severe weather development. An upper-level low centered on Minnesota
5
along with the advance of a deep trough and its associated jet streak (wind speed exceeding 80 kn) aloft led to rapid atmospheric destabilization in the afternoon of 27 April. Surface moist-warm flow arrived from the Gulf of Mexico, with dew points ex-ceeding 70◦F and wind gusts over 15 kn at the Alabama coast. Strong vertical wind shear helped create highly organized storms, which developed strong rotation at lower
10
and mid levels. These exceptionally favorable ingredients ensured a large number and long-lived super-cell thunderstorms capable of producing violent tornadoes. In the early evening of 27 April a line of severe thunderstorms exploded in central Mississippi and Alabama followed by strong activity in the early morning of 28 April (NOAA Service Assessment, Hayes, 2011).
15
3.2 Model and domain configuration
The WRF-NMM version 3 model from the Developmental Testbed Center (http:// www.dtcenter.org) was employed in this study. WRF-NMM was developed by the NOAA/National Centers for Environmental Prediction (NCEP) (Janjićet al., 2010). For simplicity, only some physics and dynamics choices are mentioned. The microphysics
20
option was Ferrier (Ferrier, 2005), which includes prognostic mixed-phase processes. The longwave and shortwave radiation options were the Geophysical Fluid Dynam-ics Laboratory (GFDL) schemes. The GFDL longwave radiation scheme includes the transmission and absorption of carbon dioxide, ozone, and water vapor in multiple spectral bands. Likewise, in the GFDL shortwave scheme, ozone and water vapor are
25
NPGD
1, 917–952, 2014Hybrid
variational-ensemble assimilation
K. Apodaca et al.
Title Page
Abstract Introduction
Conclusions References
Tables Figures
◭ ◮
◭ ◮
Back Close
Full Screen / Esc
Printer-friendly Version Interactive Discussion
Discussion
P
a
per
|
D
iscussion
P
a
per
|
Discussion
P
a
per
|
Discuss
ion
P
a
per
|
with soil temperature and moisture in four layers, fractional snow cover and frozen soil physics. For the cumulus parameterization, Betts–Miller–Janjićwas selected. This scheme adjusts deep shallow convection with a relaxation towards variable humidity and temperature profiles (BMJ – Janjić, 1994, 2000).
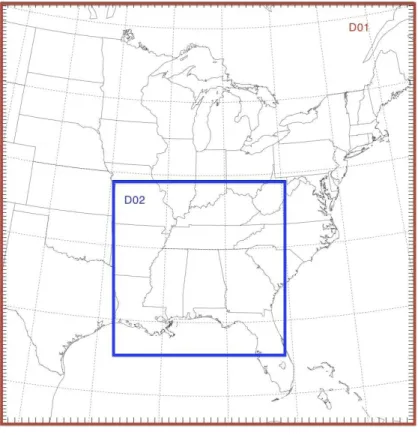
The WRF-NMM simulations in this study were configured with two domains. Domain
5
1 (D01) had a horizontal grid spacing of 27 km and a size of 1350 by 2592 km2(50×96 grid points). This domain covered parts of the mid-west, the Gulf of Mexico, the Atlantic Ocean, and the eastern US. Domain 2 (D02), centered on Alabama, had a horizontal grid spacing of 9 km and a size of 540 by 1170 km2(60×130 grid points) (Fig. 4). Both domains had a vertical extent of 27 vertical levels.
10
3.3 Data sets and data assimilation system setup
NCEP Environmental Modeling Center’s Global Forecasting System analysis files were used as input data to initialize WRF-NMM, as well as to provide lateral boundary con-ditions, but only at the beginning of data assimilation period, starting at 18:00 UTC 26 April 2011, and ending on 12:00 UTC 28 April 2011.
15
In the present study, WWLLN data was assimilated. The WWLLN is an experimen-tal lightning detection network that provides the location of cloud-to-ground (CG) and some intra-cloud lightning (IC) strikes in real-time, it has a global coverage with 10 km location accuracy and flash detection accuracy greater than 50 % (Lay, 2004). WWLLN is for the most part; a time average of geo-located CG lightning flashes that cannot
ad-20
dress the cloud-resolving characteristics of lightning. Nonetheless, for the purposes of evaluating the impact of lightning observations on the storm environment, making a dis-tinction between CG and IC lightning is beyond the scope of this study. The ensemble size was set to 32 in order to match the number of processors per node, with a data assimilation interval of 6 h to match the frequency of the Global Forecast System (GFS)
25
NPGD
1, 917–952, 2014Hybrid
variational-ensemble assimilation
K. Apodaca et al.
Title Page
Abstract Introduction
Conclusions References
Tables Figures
◭ ◮
◭ ◮
Back Close
Full Screen / Esc
Printer-friendly Version Interactive Discussion
Discussion
P
a
per
|
D
iscussion
P
a
per
|
Discussion
P
a
per
|
Discuss
ion
P
a
per
|
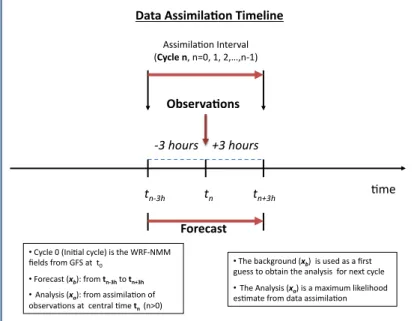
analysis solution for the next cycle. The background statexb, or prior, is an estimate
of the most likely dynamical state; it is a deterministic forecast from the previous as-similation cycle. The analysis solution was obtained as a maximum likelihood estimate from the assimilation of observations at the central timetn (Zupanski, 2005). These steps were repeated during each cycling period. Figure 5 shows the data assimilation
5
timeline. The observational error was assumed to be 0.10 hits km−2h−1.
3.4 Description of the experiments
Three simulations were performed to assess the impact of the assimilation of lightning flash rates into a mesoscale NWP:
1. The first experiment was a single observation test (1-OBS), performed to
eval-10
uate the impact of assimilating lightning flash rates at a single WWLLN location (34.5◦N, 89◦W) on the analysis increment (analysis minus background) of a sub-set of the control variables (q,T,U, andV) mentioned in Sect. 2.1 and to implicitly illustrate the complex structure of the flow-dependent forecast error covariance. The difference between the initial observation and the guess was assumed to
15
be one standard deviation of the observation error covarianceR, i.e.,y=xf+σR whereσR=1.
2. The second experiment was a control run, without the assimilation of lightning data, referred to as no-data-assimilation (NODA). Note, however, that lightning observations were still present in the simulation in order to define the optimal
20
regression parameterαopt.
3. In addition to the two simulations mentioned before, an experiment that included the assimilation of WWLLN lightning data (LIGHT) was performed. LIGHT had the same set-up as the NODA simulation; the only difference was the assimilation of lightning flash rates.
NPGD
1, 917–952, 2014Hybrid
variational-ensemble assimilation
K. Apodaca et al.
Title Page
Abstract Introduction
Conclusions References
Tables Figures
◭ ◮
◭ ◮
Back Close
Full Screen / Esc
Printer-friendly Version Interactive Discussion
Discussion
P
a
per
|
D
iscussion
P
a
per
|
Discussion
P
a
per
|
Discuss
ion
P
a
per
|
4 Results
In the following sections, we present an evaluation of the impact of the assimilation of lightning data for the 27–28 April 2011 severe weather event focusing on domain D02 (9 km resolution). First, results of the (1-OBS) experiment are shown, followed by an evaluation of the time-flow-dependent forecast error covariance through the use of
5
degrees of freedom for signal to quantify the information added to the system by the assimilation of the lightning observations. Then an evaluation of several synoptic fields from the LIGHT simulation and validation of the DA system through comparisons with some observations are presented. Thereafter, an assessment between the LIGHT and NODA simulations through the calculation of Root Mean Square (RMS) errors of the
10
lightning observations is shown.
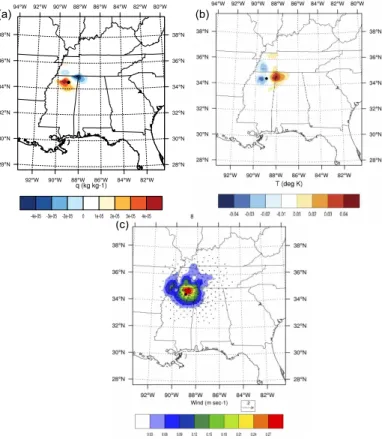
4.1 1-OBS experiment
The difference between the analysis and the 6 h forecast (background) was evaluated. Figure 6a shows the 700 hPa analysis increments of specific humidity (q) at 17:00 UTC 27 April 2011, or cycle 3 in the data assimilation period. The black dot indicates the
15
location of the single observation being assimilated (34.5◦N, 89◦W). A clear dipole of positive and negative analysis increments inq, with a magnitude of±4×10⁻⁵kg kg−1, is observed at opposite sides of the location of the single observation. The analysis increment of temperature (T) at 700 hPa (Fig. 6b) shows regions of positive and neg-ative analysis increments, with a magnitude of±4×10⁻²K, over the same regions as
20
q, but with opposite sign. The plot of wind speed at 700 hPa (Fig. 6c) shows a positive analysis increment of 2.7×10⁻¹m s−1with maximum values coinciding with the region of positive potential temperature increment.
The former Fig. 6a–c indicates that the assimilation of lightning at a single location impacted the atmospheric environment at surrounding grid points. The magnitude of
25
NPGD
1, 917–952, 2014Hybrid
variational-ensemble assimilation
K. Apodaca et al.
Title Page
Abstract Introduction
Conclusions References
Tables Figures
◭ ◮
◭ ◮
Back Close
Full Screen / Esc
Printer-friendly Version Interactive Discussion
Discussion
P
a
per
|
D
iscussion
P
a
per
|
Discussion
P
a
per
|
Discuss
ion
P
a
per
|
able to spatially spread the information of a single lightning observation and influence the initial conditions of specific humidity, temperature, the U and V components of the wind and other control variable elements. These results are a manifestation of the complex structure of the ensemble forecast error covariance matrix. This is important since it indicates that the information from lightning observations can impact the initial
5
conditions and eventually the forecast of coarse resolution models.
4.2 Evaluation of information content of the lightning observations
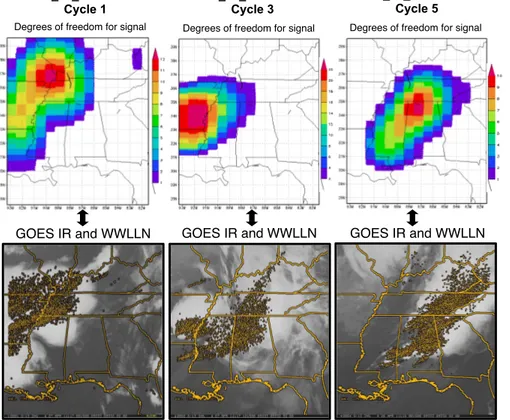
In these experiments, the degrees of freedom for signal were computed in ensemble subspace following Zupanski et al. (2007). The top-three plots in Fig. 7 show degrees of freedom for signal during three assimilation cycles (1, 2 and 3, as an example) and
10
observed GOES-IR and lightning flash rates at matching times (bottom-three plots). The areas of highest density of WWLLN lightning observations are in agreement with information content, implying that the time-flow-dependent forecast error covariance had a direct relationship to the observations throughout the assimilation period. Maxi-mum values of degrees of freedom for signal of 12, 22, and 10 for cycles 1, 3, and 5,
15
respectively can be observed in Fig. 7. These values indicate that the benefit of the observations is important, otherwise these values would be close to zero, i.e., much smaller than the number of ensembles, 32 in this case. On the other hand, if the former values were to approach the number of ensembles, this would be an indicator of the introduction of noise to the DA system by the observations and their possible benefit
20
would be nullified.
4.3 LIGHT experiment
Impacts on the environment during the severe weather event
The following results correspond to 00:00 UTC 28 April 2011. Fields of wind, abso-lute vorticity and Convective Available Potential Energy (CAPE) portray a distinctive
NPGD
1, 917–952, 2014Hybrid
variational-ensemble assimilation
K. Apodaca et al.
Title Page
Abstract Introduction
Conclusions References
Tables Figures
◭ ◮
◭ ◮
Back Close
Full Screen / Esc
Printer-friendly Version Interactive Discussion
Discussion
P
a
per
|
D
iscussion
P
a
per
|
Discussion
P
a
per
|
Discuss
ion
P
a
per
|
scenario of an environment favorable for the strengthening of deep convection. Fig-ure 8a shows background (forecast) winds at 850 hPa. A core of increased wind speed over northern Alabama can be observed, this region is co-located with an area of high density of WWLLN lightning observations (Fig. 8b). Figure 9a and b corresponds to the analysis increment of the 850 hPa winds and absolute vorticity, respectively. Regions
5
of positive increments are found near the left-hand side in both plots (6 m s−1in wind speed and 4×10⁻⁴s−1in vorticity).
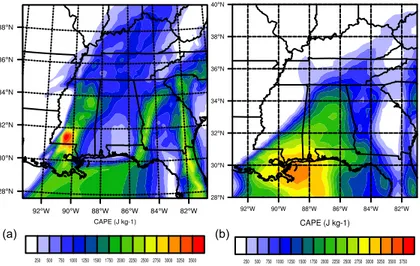
Similarly, by analyzing CAPE at the forecast step (Fig. 10a), a region of high CAPE gradient is observed on the left hand side of the domain, indicating the presence of a well-defined dry line. By assimilating lightning flash rates, the analysis increased,
10
increasing the magnitude of absolute vorticity at 850 hPa. The analysis increment of wind, suggests that absolute vorticity was advected into the region of strong CAPE gradient (dry-line). The formation of a dry line can often be a precursor for severe thunderstorm formation with tornadogenesis potential (Grazulis, 2001).
Forecast CAPE was validated by comparing the model output with observations from
15
the Storm Prediction Center’s Surface Mesoanalysis at 40 km resolution. Figure 10a and b shows the forecasted and the observed CAPE respectively. A well-defined dry-line can be readily seen in the plot of background CAPE (Fig. 10a), which coincides with the location of a strong CAPE gradient on the observations (Fig. 10b). Note however, that the model missed the location of the core of Maximum CAPE (∼3500 J kg−1) by
20
one degree, latitude and longitude. The observed maximum CAPE was located over the ocean, just offthe Mississippi coast, while in the model output; the same core was placed at the southern Mississippi–Louisiana border. On the other hand, the magnitude of modeled CAPE was in agreement with that of the observations.
4.4 Statistics: analysis and forecast Root Mean Square (RMS) errors with 25
respect to the lightning observations (LIGHT vs. NODA)
NPGD
1, 917–952, 2014Hybrid
variational-ensemble assimilation
K. Apodaca et al.
Title Page
Abstract Introduction
Conclusions References
Tables Figures
◭ ◮
◭ ◮
Back Close
Full Screen / Esc
Printer-friendly Version Interactive Discussion
Discussion
P
a
per
|
D
iscussion
P
a
per
|
Discussion
P
a
per
|
Discuss
ion
P
a
per
|
conclusions on determining which experiment outperformed the other. Statistical eval-uations on the other hand, can provide useful diagnostics when morphological diff er-ences are not obvious.
Analysis and forecast RMS errors with respect to the lightning observations were calculated from a domain containing the observed lightning flash rates at 10 km
resolu-5
tion during the 6 h assimilation time window, as described in Sect. 2.2. From Fig. 11a, the LIGHT experiment achieves a better fit in the analysis compared to the NODA experiment. This result is only partially retained during the forecast (Fig. 11b). A pos-sible reason may be that there are no other types of observations being assimilated, such as conventional and satellite observations that would additionally constrain the
10
analysis and eventually create dynamical balance, further improving the analysis and consequently the forecast.
5 Summary and future work
In this study, the preliminary development and assessment of a methodology for the as-similation of lightning observations through hybrid variational-ensemble methods is
pre-15
sented. The aim of the study was to evaluate if lightning data assimilation can be useful in mesoscale, regional, and global applications at a coarse resolution in which convec-tion cannot be explicitly resolved. The MLEF system interfaced with WRF-NMM was utilized to investigate the impacts of lightning data assimilation on a mesoscale NWP model. As a proof of concept, this methodology was tested for the 27–28 April 2011
20
severe weather event in the southeastern US. Results indicate that lightning was ca-pable of spreading new information into the WRF-NMM model. Analysis increments of 750 hPa specific humidity, temperature, and winds indicate that the assimilation of lightning flash rates could impact the initial conditions of a subset of model variables (q,T,U andV) leading to dynamical balance as shown by the output from the 1-OBS
25
NPGD
1, 917–952, 2014Hybrid
variational-ensemble assimilation
K. Apodaca et al.
Title Page
Abstract Introduction
Conclusions References
Tables Figures
◭ ◮
◭ ◮
Back Close
Full Screen / Esc
Printer-friendly Version Interactive Discussion
Discussion
P
a
per
|
D
iscussion
P
a
per
|
Discussion
P
a
per
|
Discuss
ion
P
a
per
|
rates were in agreement with information content theory indicating that the time-flow-dependent forecast error covariance was directly related to observations during the assimilation period.
Evaluation of some atmospheric fields from the LIGHT experiment indicated that the assimilation of lightning data influenced winds, absolute vorticity and CAPE. A core of
5
increased background wind speed at 850 hPa coincides with the location of the region of high density in lightning observations for the same assimilation cycle, indicating that the assimilation of lightning data had an impact on the increase of wind speed. Analysis increments of the 850 hPa wind, absolute vorticity and background CAPE indicated that vorticity was advected into the region of strong CAPE gradient where a dry-line formed.
10
All these changes suggest the development of an environment favorable for strengthen-ing of deep convection. Analyses and forecast RMS errors with respect to the lightnstrengthen-ing observations from the LIGHT and NODA experiments indicated that LIGHT achieved a better fit at the analysis step compared to the NODA experiment, but this result was only partially retained during the forecast.
15
The methodology presented in this study represents an initial step towards develop-ing a comprehensive multivariate, multi-scale, multi-sensor operational data assimila-tion system that prepares for the assimilaassimila-tion of lightning along with different types of operational observations and for multiple applications. As a first step, we intended to verify if the data assimilation techniques described here could be accomplished and
20
that lightning data could add information content to a modeling system with a coarse resolution similar to the ones used in operations. Further studies are planned where this methodology will be tested for different applications (e.g., different case studies, different models, and choice of observation operators). Operational conventional and satellite observations will be assimilated alongside lightning flash rates to further
con-25
NPGD
1, 917–952, 2014Hybrid
variational-ensemble assimilation
K. Apodaca et al.
Title Page
Abstract Introduction
Conclusions References
Tables Figures
◭ ◮
◭ ◮
Back Close
Full Screen / Esc
Printer-friendly Version Interactive Discussion
Discussion
P
a
per
|
D
iscussion
P
a
per
|
Discussion
P
a
per
|
Discuss
ion
P
a
per
|
Appendix A
Lightning flash rate observation operator correction: weak constrain
Assume a multiplicative correction to the observation operator (i.e., correction in mag-nitude, not in the direction of the vector)
h(x)→αh(x), (A1)
5
whereα >0 is the unknown multiplication parameter.
Consider a logarithmic function of vectors since all vectors (i.e., y and h(x)) are positive definite and define a cost function with the adjustable parameterα:
J(α)=1
2[log(α)−log(α0)]
TW−1[log(α)−log(α 0)]
+1
2[log(y)−log(αh(x))]
T
R−L1[log(y)−log(αh(x))]
(A2)
10
whereRL is the observation error covariance associated with a logarithmic
transfor-mation,α0 is a guess value, andW is the uncertainty matrix of the guess value. The
optimal parameter αopt>0 that minimizes the cost function (Eq. A2) is searched for.
Following a standard procedure of function minimization to solve:
∂J(α)
∂α
αopt
=0. (A3)
15
Note that in order to differentiate with respect toαit may be more convenient to redefine the cost function (Eq. A2) in the following manner:
J(α)=1
2[log(α)−log(α0)]
T
W−1[log(α)−log(α0)]
+1
2
log y
h(x)
−log(α) T
R−L1
log
y
h(x)
−log(α)
.
NPGD
1, 917–952, 2014Hybrid
variational-ensemble assimilation
K. Apodaca et al.
Title Page Abstract Introduction Conclusions References Tables Figures ◭ ◮ ◭ ◮ Back Close
Full Screen / Esc
Printer-friendly Version Interactive Discussion Discussion P a per | D iscussion P a per | Discussion P a per | Discuss ion P a per |
The Jacobian of Eq. (A4) is
∂J(α)
∂α =
1
α[1]
TW−1[log(α)−log(α 0)]−
1
α[1] TR−1
L
log
y
h(x)
−log(α)
, (A5)
where [1] is a vector with all components equal to one. After employing Eq. (A3)
1
α
(log(α))[1]TW−1[1]+logα[1]TR−1
L [1]−[1] TR−1
L
log
y
h(x)
−log(α0)[1]TW
−1[
1]
=0.
(A6)
5
After multiplying Eq. (A6) byα (whereα >0) Eq. (A6) can be rewritten as
(log(α))[1]ThR−L1+W−1i[1]−[1]TR−L1
log
y
h(x)
−log(α0)[1]TW
−1[
1]=0. (A7)
From Eq. (A7):
log(α)=
[1]TR−L1hloghy(x)i+log(α0)[1]TW−1[1]
[1]ThR−1 L +W
−1i[1]
. (A8)
Finally, the optimal multiplicative parameter is given by:
10
αopt=exp
[1]TR−L1hloghy(x)i+log(α0)[1]TW−1[1]
[1]ThR−1 L +W
−1i[1]
. (A9)
After employing a common assumption that the uncertainty matrixWand the observa-tion error matrixRLare diagonal, with diag(W)=w0and diag(RL)=r0, respectively,
[1]TW−1[1]=Nobsw−1
NPGD
1, 917–952, 2014Hybrid
variational-ensemble assimilation
K. Apodaca et al.
Title Page Abstract Introduction Conclusions References Tables Figures ◭ ◮ ◭ ◮ Back Close
Full Screen / Esc
Printer-friendly Version Interactive Discussion Discussion P a per | D iscussion P a per | Discussion P a per | Discuss ion P a per |
[1]ThR−L1+W−1i[1]=Nobsr−1 0 +w
−1 0
(A11)
[1]TR−L1
log
y
h(x)
=r−1
0
Nobs
X
i=1
log y
h(x)
i
. (A12)
whereNobsis the number of observations. By substituting Eqs. (A10)–(A12) in Eq. (A9) gives:
5
αopt=exp
1 Nobs Nobs P
i=1
logh(yx) i
+w0 r0
−1
log(α0)
1+w0 r0 −1 . (A13)
Without additional knowledge, a typical guess value isα0=1, which further simplifies
the solution Eq. (A13) to
αopt=exp
1 Nobs Nobs P
i=1
logh(yx) i
1+ r0 w0 . (A14)
The above expression can be easily calculated in the observation operator and provide
10
an adjustable correction factor.
Acknowledgements. This work was supported by the NOAA GOES-R Risk Reduction Program Grant NA17RJ1228 (Amendment 175), and the Joint Center for Satellite Data Assimilation program Grant NA10NES4400012. This work was also partially supported by the National Science Foundation Collaboration in Mathematical Geosciences Grant ATM-0930265. We
15
NPGD
1, 917–952, 2014Hybrid
variational-ensemble assimilation
K. Apodaca et al.
Title Page
Abstract Introduction
Conclusions References
Tables Figures
◭ ◮
◭ ◮
Back Close
Full Screen / Esc
Printer-friendly Version Interactive Discussion
Discussion
P
a
per
|
D
iscussion
P
a
per
|
Discussion
P
a
per
|
Discuss
ion
P
a
per
|
Foundation. Data, valuable input and some plots were provided by the following individuals: Daniel Bikos, Gregory DeMaria, Robert DeMaria, Gaël Descombes, Jack Dostalek, and Daniel Lindsey.
Disclaimer.The views, opinions, and findings contained in this article are those of the authors
5
and should not be construed as an official National Oceanic and Atmospheric Administration
(NOAA) or US Government position, policy, or decision.
References
Adamo, C., Goodman, S., Mugnai, A., and Weinman, J. A.: Lightning measurements from satellites and significance for storms in the Mediterranean, in: Lightning Principles,
Instru-10
ments and Applications: Review of Modern Lightning Research, edited by: Betz, H. D., Schu-mann, U., and Laroche, P., Springer, Dordrecht, 309–329, 2009.
Alexander, G. D., Weinman, J. A., Karyampudi, V., Olson, W. S., and Lee, A. C. L.: The ef-fect of assimilating rain rates derived from satellites and lightning on forecasts of the 1993 Superstorm, Mon. Weather Rev., 127, 1433–1457, 1999.
15
Barthe, C., Deierling, W., and Barth, M. C.: Estimation of total lightning from various storm parameters: a cloud resolving model study, J. Geophys. Res., 115, D24202, doi:10.1092/2010JD014405, 2010.
Black, R. A. and Hallett, J.: Electrification of the hurricane, J. Atmos. Sci., 56, 2004–2028, 1999. Ek, M. B., Mitchell, K. E., Lin, Y., Rogers, E., Grunmann, P., Koren, V., Gayno, G., and
Tarp-20
ley, J. D.: Implementation of Noah land surface model advances in the National Centers for Environmental Prediction operational mesoscale Eta model, J. Geophys. Res., 108, 8851, doi:10.1029/2002JD003296, 2003.
Falkovich, A., Ginis, I., and Lord, S.: Ocean data assimilation and initialization procedure for the Coupled GFDL/URI Hurricane Prediction System, J. Atmos. Ocean. Tech., 22, 1918–1932,
25
2005.
Ferrier B. S.: An efficient mixed-phase cloud and precipitation scheme for use in operational
NPGD
1, 917–952, 2014Hybrid
variational-ensemble assimilation
K. Apodaca et al.
Title Page
Abstract Introduction
Conclusions References
Tables Figures
◭ ◮
◭ ◮
Back Close
Full Screen / Esc
Printer-friendly Version Interactive Discussion
Discussion
P
a
per
|
D
iscussion
P
a
per
|
Discussion
P
a
per
|
Discuss
ion
P
a
per
|
Fierro, A. O., Mansell, E. R., Ziegler, C. L., and MacGorman, D. R.: Application of a lightning data assimilation technique in the WRF-ARW model at cloud-resolving scales for the tornado outbreak of 24 May 2011, Mon. Weather Rev., 140, 2609–2627, 2012.
Finke, U.: Optical detection of lightning from space, in: Lightning Principles, Instruments and Applications: Review of Modern Lightning Research, edited by: Betz, H. D., Schumann, U.,
5
and Laroche, P., Springer, Dordrecht, 271–286, 2009.
Grazulis, T. P.: The Tornado: Nature’s Ultimate Windstorm, University of Oklahoma Press, Nor-man, 324 pp., 2001.
Hayes, J. L.: Service Assessment: the Historic Tornadoes of April 2011, US Department of Commerce, National Oceanic and Atmospheric Administration, National Weather
Ser-10
vice, Silver Spring, Maryland, available at: http://www.nws.noaa.gov/os/assessments/pdfs/ historic_tornadoes.pdf (last access: 3 November 2012), 2011.
Janjić, Z. I.: The Step-Mountain Eta Coordinate Model: further developments of the convection,
viscous sublayer, and turbulence closure schemes, Mon. Weather Rev., 122, 927–945, 1994.
Janjić, Z. I.: Comments on “Development and evaluation of a convection scheme for use in
15
climate models”, J. Atmos. Sci., 57, 3686, 2000.
Janjić, Z. I., Black, T., Pyle, M., Rogers, E., Chuang, H. Y., and DiMego, G.: High resolution ap-plications of the WRF NMM, in: Proceedings of 21st Conf. on Weather Analysis and Forecast-ing/17th Conf. on Numerical Weather Prediction, Washington, D.C., 31 July–5 August 2005, American Meteorological Society, Boston, 2005.
20
Janjić, Z. I., Gall, R., and Pyle, M. E.: Scientific documentation for the NMM solver, Technical
Note TN-477+STR, 53, NCAR, Boulder, Colorado, USA, 125 pp., 2010.
Lay, E. H., Holzworth, R. H., Rodger, C. J., Thomas, J. N., Pinto, O., and Dowden, R. L.: WWLLN global lightning detection system: regional validation study in Brazil, Geophys. Res. Lett., 31, L03102, doi:10.1029/2003GL018882, 2004.
25
Mansell, E. R., Ziegler, C. L., and MacGorman, D. R.: A lightning data assimilation technique for mesoscale forecast models, Mon. Weather Rev., 135, 1732–1748, 2007.
Papadopoulos, A., Chronis, T. G., and Anagnostou, E. N.: Improving convective precipitation forecasting through assimilation of regional lightning measurements in a mesoscale model, Mon. Weather Rev., 133, 1961–1977, 2005.
30
NPGD
1, 917–952, 2014Hybrid
variational-ensemble assimilation
K. Apodaca et al.
Title Page
Abstract Introduction
Conclusions References
Tables Figures
◭ ◮
◭ ◮
Back Close
Full Screen / Esc
Printer-friendly Version Interactive Discussion
Discussion
P
a
per
|
D
iscussion
P
a
per
|
Discussion
P
a
per
|
Discuss
ion
P
a
per
|
Price, C. G.: Thunderstorms lightning and climate change, in: Lightning Principles, Instru-ments and Applications: Review of Modern Lightning Research, edited by: Betz, H. D., Schu-mann, U., and Laroche, P., Springer, Dordrecht, 521–535, 2009.
Price, C. G.: Lightning applications in weather and climate research, Surv. Geophys., 34, 755– 767, 2013.
5
Price, C. G. and Rind, D.: A simple lightning parameterization for calculating the global lightning distribution, J. Geophys. Res., 97, 9919–9933, 1992.
Rodgers, C. D.: Inverse Methods for Atmospheres: Theory and Practice, World Scientific, Sin-gapore, 256 pp., 2000.
Shannon, C. E. and Weaver, W.: The Mathematical Theory of Communication, University of
10
Illinois Press, Champaign, 144 pp., 1949.
bibitem26 Zupanski, D., Hou, A. Y., Zhang, S. Q., Zupanski, M., Kummerow, C. D., and Che-ung, S. H.: Applications of information theory in ensemble data assimilation, Q. J. Roy. Me-teorol. Soc., 133, 1533–1545, 2007.
Zupanski, M.: Maximum likelihood ensemble filter: theoretical aspects, Mon. Weather Rev.,
15
133, 1710–1726, 2005.
Zupanski, M., Navon, I. M., and Zupanski, D.: The maximum likelihood ensemble filter as a
NPGD
1, 917–952, 2014Hybrid
variational-ensemble assimilation
K. Apodaca et al.
Title Page
Abstract Introduction
Conclusions References
Tables Figures
◭ ◮
◭ ◮
Back Close
Full Screen / Esc
Printer-friendly Version Interactive Discussion
Discussion
P
a
per
|
D
iscussion
P
a
per
|
Discussion
P
a
per
|
Discuss
ion
P
a
per
|
699
700 701
Fig. 1.Statistics of normalized innovation vectorsR−1/2[y−h(xf)], or PDF innovations for cycles 1–5 for both domains (D01 and D02) before (left panels – blue) and after (right panels – red) correction. The skewed histograms on the left implicitly indicate that the values of observed lightning flash rate are considerably larger than the guess, a situation that required a correction.
NPGD
1, 917–952, 2014Hybrid
variational-ensemble assimilation
K. Apodaca et al.
Title Page
Abstract Introduction
Conclusions References
Tables Figures
◭ ◮
◭ ◮
Back Close
Full Screen / Esc
Printer-friendly Version Interactive Discussion
Discussion
P
a
per
|
D
iscussion
P
a
per
|
Discussion
P
a
per
|
Discuss
ion
P
a
per
|
716
717
718
Fig. 2.Flow chart of the data assimilation system, the left section is the MLEF system with all its components. The lightning observation operator algorithm is shown on the right-hand side of the flow chart.
NPGD
1, 917–952, 2014Hybrid
variational-ensemble assimilation
K. Apodaca et al.
Title Page
Abstract Introduction
Conclusions References
Tables Figures
◭ ◮
◭ ◮
Back Close
Full Screen / Esc
Printer-friendly Version Interactive Discussion
Discussion
P
a
per
|
D
iscussion
P
a
per
|
Discussion
P
a
per
|
Discuss
ion
P
a
per
|
L
NPGD
1, 917–952, 2014Hybrid
variational-ensemble assimilation
K. Apodaca et al.
Title Page
Abstract Introduction
Conclusions References
Tables Figures
◭ ◮
◭ ◮
Back Close
Full Screen / Esc
Printer-friendly Version Interactive Discussion
Discussion
P
a
per
|
D
iscussion
P
a
per
|
Discussion
P
a
per
|
Discuss
ion
P
a
per
|
754 755
Fig. 4.Domain configuration. D01 is the mother domain with a size of 1350 by 2952 km2(50×96
grid points) at 27 km resolution. D02, the inner nest has a size of 540 by 1170 km2(60×130
grid points) at 9 km resolution.
NPGD
1, 917–952, 2014Hybrid
variational-ensemble assimilation
K. Apodaca et al.
Title Page
Abstract Introduction
Conclusions References
Tables Figures
◭ ◮
◭ ◮
Back Close
Full Screen / Esc
Printer-friendly Version Interactive Discussion
Discussion
P
a
per
|
D
iscussion
P
a
per
|
Discussion
P
a
per
|
Discuss
ion
P
a
per
|
767 768
769
770
771
!"#$ !
"#$%$ !"$
!"#$%&'() *+'$#,&-".'$
!
"&$%$
#$'%()*+$ &$'%()*+$
• $%&'(#$)$*+,-!.($'&'(#/$-0$12#$3456788$ 9#(:0$;<="$>5?$.1$$1)$
• $5=<#'.01$*!
"/@$;<="$(./01)1=$(.201)
• $$A,.(&0-0$*!#/@$;<="$.00-"-(.!=,$=;$
=B0#<C.!=,0$.1$$'#,1<.($!"#$(.))*,D)/$
A00-"-(.!=,$+,1#<C.($
*34%5$).E$,F)E$GE$HEIE,6G/$
6&(&)7''8985&-".):89$58.$$
• $J2#$B.'KL<=M,:$*!"/$$-0$M0#:$.0$.$9<01$
LM#00$1=$=B1.-,$12#$.,.(&0-0$$;=<$,#N1$'&'(#)
• $$J2#$A,.(&0-0$*!
#/$-0$.$".N-"M"$(-K#(-2==:$
#0!".1#$;<="$:.1.$.00-"-(.!=,$$
Fig. 5.Data assimilation timeline, the data assimilation frequency for the lightning observation is 6 h (±3 h) from a central timetn>0. The initial cycle (Cycle 0) is simply the model (WRF-NMM) output fields from the GFS files, attn, the forecast, or background state (xb) is obtained fromtn−3 htotn+3 h. The forecast is used as a guess to obtain the analysis solution for the next cycle.
![Fig. 1. Statistics of normalized innovation vectors R −1/2 [y −h(x f )], or PDF innovations for cycles 1–5 for both domains (D01 and D02) before (left panels – blue) and after (right panels – red) correction](https://thumb-eu.123doks.com/thumbv2/123dok_br/18305377.348144/26.918.144.559.110.457/statistics-normalized-innovation-vectors-innovations-domains-panels-correction.webp)