www.nat-hazards-earth-syst-sci.net/14/1953/2014/ doi:10.5194/nhess-14-1953-2014
© Author(s) 2014. CC Attribution 3.0 License.
Statistical correlation between meteorological
and rockfall databases
A. Delonca, Y. Gunzburger, and T. Verdel
GeoRessources, Université de Lorraine, CNRS – CREGU, Ecole des Mines de Nancy, Campus Artem, CS14234, 54042 Nancy CEDEX, France
Correspondence to:A. Delonca ([email protected])
Received: 9 December 2013 – Published in Nat. Hazards Earth Syst. Sci. Discuss.: 10 February 2014 Revised: 25 June 2014 – Accepted: 26 June 2014 – Published: 4 August 2014
Abstract. Rockfalls are a major and essentially unpre-dictable sources of danger, particularly along transportation routes (roads and railways). Thus, the assessment of their probability of occurrence is a major challenge for risk man-agement. From a qualitative perspective, it is known that rockfalls occur mainly during periods of rain, snowmelt, or freeze–thaw. Nevertheless, from a quantitative perspective, these generally assumed correlations between rockfalls and their possible meteorological triggering events are often dif-ficult to identify because (i) rockfalls are too rare for the use of classical statistical analysis techniques and (ii) not all intensities of triggering factors have the same probabil-ity. In this study, we propose a new approach for investigat-ing the correlation of rockfalls with rain, freezinvestigat-ing periods, and strong temperature variations. This approach is tested on three French rockfall databases, the first of which exhibits a high frequency of rockfalls (approximately 950 events over 11 years), whereas the other two databases are more typical (approximately 140 events over 11 years). These databases come from (1) national highway RN1 on Réunion, (2) a rail-way in Burgundy, and (3) a railrail-way in Auvergne. Whereas a basic correlation analysis is only able to highlight an already obvious correlation in the case of the “rich” database, the newly suggested method appears to detect correlations even in the “poor” databases. Indeed, the use of this method con-firms the positive correlation between rainfall and rockfalls in the Réunion database. This method highlights a correlation between cumulative rainfall and rockfalls in Burgundy, and it detects a correlation between the daily minimum temperature and rockfalls in the Auvergne database. This new approach is easy to use and also serves to determine the conditional
probability of rockfall according to a given meteorological factor. The approach will help to optimize risk management in the studied areas based on their meteorological conditions.
1 Introduction
Rockfall hazard is defined as the probability that a rockfall of a given volume occurs in a given area within a specified time interval (Varnes, 1984). This definition considers three differ-ent compondiffer-ents of hazard: space, time (rockfall frequency), and the intensity (volume) of the event. Numerous studies on hazard mapping (e.g. Baillifard et al., 2003; Jaboyedoff et al., 2005) and rockfall frequency (e.g. Brunetti et al., 2009; Dussauge et al., 2003) are available in the literature, but little work has been conducted to quantify the influence of meteo-rological factors on rockfall frequency.
Rockfall inventories can be used to quantify the statistical correlation between rockfall events and their triggering fac-tors (Chau et al., 2003; Helmstetter and Garambois, 2010). However, it is generally difficult to identify such a correla-tion because (i) rockfalls are too rare for the use of classical statistical analysis techniques and (ii) all intensities of trig-gering factors do not have the same probability. More pre-cisely, as the occurrence or action of a triggering factor does not necessarily result in a rockfall, it is necessary to distin-guish the rockfall probability itself from the frequency of its potential triggering factors.
In this paper, we present a new approach for investigat-ing the correlation of rockfalls with rain, freezinvestigat-ing periods, and strong temperature variations. This approach is tested on three French rockfall databases, the first of which exhibits a high rockfall frequency (approximately 950 events over 11 years). The two other databases contain approximately 140 events over 11 years. The three databases came from the following sources: (1) national highway RN1 on Réunion (Indian Ocean), (2) a railway in Burgundy, and (3) a railway in Auvergne, France (Fig. 1 and Table 1). The spatial location and intensity of the events are not studied in this paper;only the number of rockfalls during the period of monitoring is considered. However, the volume range and the mean height of the source rock walls are given for each sector (cf. Part 2). The standard time series approach (Helmstetter and Garambois, 2010) is able to highlight an already obvious cor-relation only in the case of the “rich” database. The newly suggested method also appears to detect correlations in the “poor” databases. This approach will help to optimize risk management in the areas considered in terms of the meteoro-logical conditions.
2 Rockfall databases
There is a significant difference between the three databases: for Réunion, 13 % of the days have at least one rockfall (529 days out of 4008 days in the entire database), com-pared with 3 % for the Auvergne and Burgundy databases. The high frequency of events makes the first database par-ticularly unique. Rockfall databases typically have an event frequency of approximately 3 % (Hungr et al., 1999; Jeannin, 2001; RTM Isère, 1996; Wieczorek et al., 1992).
Figure 1. Location of the three sites, corresponding to (a) Au-vergne,(b)Burgundy, and(c)Highway RN1 on Réunion.
The daily rockfall hazard, which is the probability of a fall on a given day, regardless of the meteorological factors, is similar to these frequencies under the assumption of spatial and temporal homogeneity.
2.1 Highway RN1 on Réunion
National Road #1 (RN1) on Réunion (Indian Ocean, lati-tude: 21◦10′S, longitude: 55◦30′E) runs along the coast at the base of a 10 km long and up to 200 m high cliff com-posed of basaltic lava strata alternating with pyroclastic lay-ers. This region has a tropical climate. In the studied area, precipitation can reach 372 mm a day, and temperatures typ-ically vary from 16 to 35◦C over the year, with an average amplitude of 9.2◦C in a day.
Daily rockfall data are available due to the regular pa-trols conducted by the local public works authorities (DDE). A total of 949 rockfalls were recorded within the 11 year span between 1998 and 2009. The volumes of the rock-falls range between 2 and 27×103m3. Previous studies (Durville, 2004; Rat, 2006) that considered only a portion of the database (352 rockfalls recorded between 1998 and 2002) have shown that rockfalls are mainly correlated with intense rainfall episodes. We repeated this study with a more exhaus-tive database and also evaluated the influence of temperature on rockfalls.
2.2 Railway in Burgundy, France
frequent rainfall in every season, with a maximum in autumn (up to 89 mm daily). The semi-continental influence pro-duces cold winters (minimum temperatures down to−20◦C) and hot summers (maximum temperatures up to 36◦C). The daily temperature amplitude may be up to 24◦C.
Technicians from the French National Railway Company (SNCF), who ensure railroad safety, are in charge of the rockfall inventory. Daily data are available, and 135 rock-falls were recorded within a 13 year span (1999–2012) along 100 km of the railroad studied. The average height of the rock walls is 20 m in the cut areas and more than 20 m in the areas of natural slopes. The volumes of the rockfalls range between 8 and 80×103m3.
2.3 Railway in Auvergne, France
The altitude of the study area is between 700 and 900 m. It consists of volcanic (basalt) and plutonic (granite) magmatic rocks. Its climate is similar to that of Burgundy. Rainfall can reach 125,mm a day. Temperatures range between−18 and 36◦C, with a daily temperature amplitude of up to 23◦C.
The Auvergne database provides daily data based on a rockfall inventory maintained by technicians from SNCF. Overall, 40 km of railroads are included in this database, and the mean height of the cliffs is 15 m in the cut areas and more than 15 m in the areas of natural slopes. The database in-cludes 142 rockfalls, which were recorded over an 11 year span (2001–2012). The volumes of the rockfalls range be-tween 2 and 6×10³m3.
The following analyses were conducted for the three study sites taken separately.
3 Preliminary analysis using a standard time series approach
3.1 Possible triggering factors considered in this study Possible triggering factors include the following:
– PDN, the amount of precipitation (or rainfall) of the
considered day (D0), orN days before (DN), withN
varying from 1 to 10;
– PcN, the amount of precipitation (or rainfall)
accumulated over N days (up to 10 days):
PcN=PD0+PD1+. . .+PDN;
– the day’s temperature range, indicated by the minimum temperature (Tmin), maximum temperature (Tmax), and temperature amplitude (Tamp=Tmax−Tmin);
– the daily duration of freezing. This factor was consid-ered only for Burgundy and Auvergne because the tem-peratures on Réunion are never below 0◦C.
These meteorological parameters were provided by Météo France (the French national weather service) for each sector
on a daily basis. The weather stations selected for this pur-pose were located no more than 30 km away from the studied area. The stations used in the study of the highway on Réu-nion have a mean altitude of 100 m. Those used for Burgundy have a mean altitude of 310 m, and those used for Auvergne have a mean altitude of 700 m.
3.2 Results
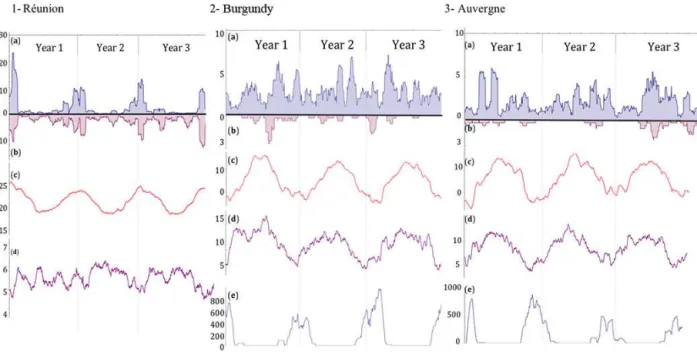
First, a qualitative analysis of the three databases was per-formed. Figure 2 shows the visual correlation between the rockfalls and meteorological factors over a 3-year period. The graphs were obtained by calculating a 30-day moving average to smooth the data and to focus on the trend. From a purely qualitative perspective, the graphs shed light on the following:
– a good correlation between rockfalls and rainfall and between rockfalls and minimum temperatures for Réunion;
– no noticeable correlation between rockfalls and meteo-rological factors in Burgundy;
– a low correlation between rainfall and rockfalls in Au-vergne but no noticeable correlation between tempera-tures and rockfalls.
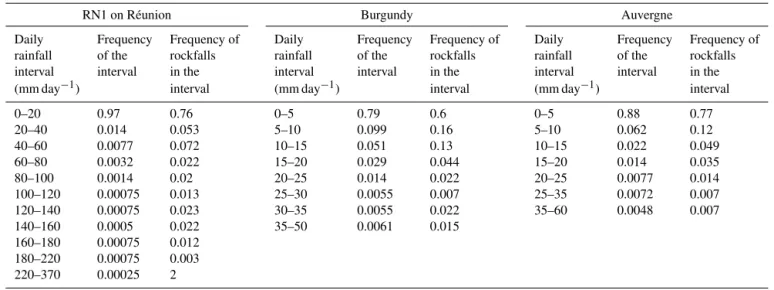
Table 2 presents the distribution of the total number of rock-falls per day as a function of the daily amount of rain for the three studied areas. The maximum frequency of rockfalls occurs for the lowest daily amount of rainfall. This lowest rainfall interval is also the most frequent. Low levels of rain are more frequent than high levels. This difference in fre-quency tends to conceal the effect of rain on triggering rock-fall events.
The cross-correlation between the daily number of rock-falls (R) and the amount of precipitation (P), both expressed as time series, was investigated by calculating
Ck(X, Y ) =
P
Xt −X Yt−k −Y
q P
Xt,−X
2qP
Yt −Y
2, (1)
with k corresponding to the time delay between the rain episode and the rockfalls that it may have triggered (Hipel and McLeod, 2005).
Figure 3 presents the cross-correlation function of Eq. (1) for Réunion by considering various delays. A maximum value of 0.563 is reached for a delay of 1 day; this value is statistically significant in terms of the significance threshold applied to the data. If the cross-correlations are larger than 1.96/√nin magnitude, withnas the number of pairs of (Rt,
Pt) available (equal to the number of days in the databases),
Figure 2.Temperature, rainfall, and rockfall for a 3-year period for the three studied sites (30-day moving average).(a)Precipitation (mm of rain).(b)Rockfall.(c)Minimum of temperature (◦C).(d)Daily temperature amplitude (◦C).(e)Duration of the freezing period (min).
Figure 3.Cross-correlation of rockfall and rainfall for(a)Réunion and(b)Burgundy. The significance threshold, equal to 0.031, is rep-resented by the dashed lines.
the daily freezing duration), but none of these yielded sat-isfactory results (maximum value of 0.07 with a significant threshold of 0.031).
3.3 Limitations of the typical approach
The preliminary analysis presented here only confirms the visual correlation between rainfall and rockfalls for Réunion. Although meteorological factors are frequently mentioned in the literature as an explanation of rockfalls there, no other correlations were identified for the two other databases.
This lack of significant results can be explained by the nature of databases: using only 3 % of the days in the database resulted in a relatively weak time series analysis.
Furthermore, these days typically contain only one event (1 % of days with rockfalls are days with several events in the railway databases). These characteristics lead to a smoothing of the results and do not permit us to draw any conclusions regarding potential correlations.
Our proposed method does not consider the delay in time, only the influence of the intensity of the parameters on rockfalls.
4 Suggested new methodology of analysis 4.1 Principle
The objective of the new methodology is to weight the num-ber of rockfalls by the probability of occurrence of the stud-ied triggering factor (rainfall, temperatures, and freezing pe-riod). To this end, three steps are required. These steps will now be detailed for the case of rainfall.
First, rainfall intervals [Pi, Pi+1] are defined, where P designates the daily or cumulated rainfall. These intervals are defined such that (i) the number of days within this rainfall interval is equal or greater to five (to avoid non-statistically significant intervals) and (ii) at least one event occurs within this rainfall interval.
Second, the following ratio is calculated for each interval:
Ei =Nri/Ndi, (2)
where Nri is the number of rockfall(s) that occurred within
Table 2.Number of rockfalls for various intervals of daily rainfall.
RN1 on Réunion Burgundy Auvergne
Daily Frequency Frequency of Daily Frequency Frequency of Daily Frequency Frequency of rainfall of the rockfalls rainfall of the rockfalls rainfall of the rockfalls interval interval in the interval interval in the interval interval in the (mm day−1) interval (mm day−1) interval (mm day−1) interval
0–20 0.97 0.76 0–5 0.79 0.6 0–5 0.88 0.77
20–40 0.014 0.053 5–10 0.099 0.16 5–10 0.062 0.12 40–60 0.0077 0.072 10–15 0.051 0.13 10–15 0.022 0.049 60–80 0.0032 0.022 15–20 0.029 0.044 15–20 0.014 0.035 80–100 0.0014 0.02 20–25 0.014 0.022 20–25 0.0077 0.014 100–120 0.00075 0.013 25–30 0.0055 0.007 25–35 0.0072 0.007 120–140 0.00075 0.023 30–35 0.0055 0.022 35–60 0.0048 0.007 140–160 0.0005 0.022 35–50 0.0061 0.015
160–180 0.00075 0.012 180–220 0.00075 0.003 220–370 0.00025 2
this interval. Thus, Ei corresponds to the daily rockfall
fre-quency for each interval.
Third, a linear regression analysis of the valuesEi is
per-formed with respect toPito search for a possible linear
rela-tionship between the magnitude of the triggering factor and the corresponding average number of rockfalls. To validate the correlation, we have considered the squared correlation coefficient R2 and the p value of the linear regression. If thepvalue was less than 0.05 (significance level), the linear model was considered satisfactory, and the R2value corre-sponds to the best correlation.
To test the relevance of the method, virtual rockfalls and rainfall databases were created. To confirm the importance of the number of events in the database, rich and poor databases were generated such that the correlation between rainfall and the number of events could be determined in advance. The method was then applied to determine the correlations for different cases.
4.2 Validation of the new methodology: case study on virtual databases
4.2.1 Generation of virtual databases
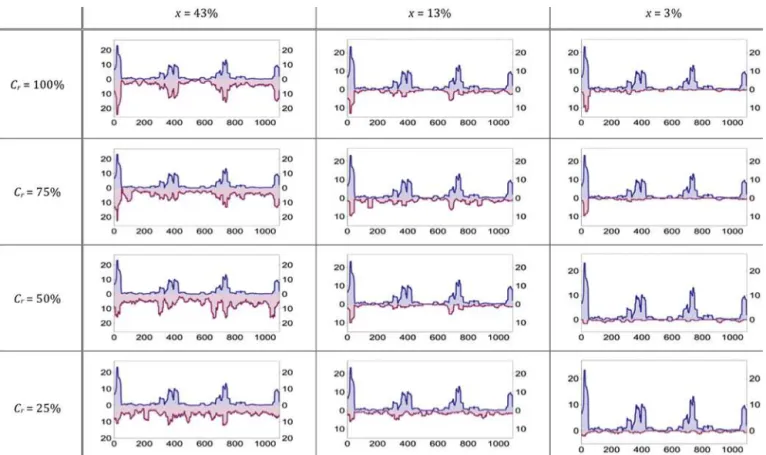
For the first case study, the virtual databases were generated using Mathematica software (V9, Wolfram Research, Cham-paign, Illinois, USA). The following parameters were used as fixed components of the databases:
– the number of days in the entire database (N).Nis con-sidered as equal to 4015 days (11 years), similar to the real databases;
– the type of triggering meteorological factor and its dis-tribution. The chosen factor is rainfall, which follows the same distribution as the measured rainfall of Réu-nion (Fig. 5). Overall, 43 % of the days were rainy;
– the ratio between rainfall and the number of events, which gives the number of rockfalls given the amount of rain for each day, is taken to be equal to 0.1 in the case of the virtual databases (a rainfall of 10 mm over 1 day is assumed to trigger one rockfall on the same day; in the case of a day without rainfall, zero rockfalls occur on this day);
– k, the time delay (in days) between a rain episode and the rockfalls that it may have triggered. k is always equal to zero in the virtual databases (because all rock-falls are assumed to occur within the same day of the rain episode).
Two other parameters will vary depending on the databases: – the “correlation rate”Cr between rainfall and number of events. For example, a perfect correlation (correla-tion rate of 100 %) indicates that all rainy days are days with rockfalls, in accordance with the fixed proportion-ality coefficient. A correlation rate of 50 % means that half of the events are perfectly correlated with rainfall, whereas the others are randomly distributed throughout the database;
– the proportionxof days with events. Three cases were tested: (1) x=43 %, corresponding to the proportion of rainy days in the Réunion database; (2)x=13 %, corresponding to the proportion of days with events in the Réunion database; and (3)x=3 %, corresponding to the proportion of days with events in the railway databases.
Figure 4.Qualitative correlation between rockfalls and rainfall (30-day moving average) for the 12 virtual databases.Crcorresponds to the “correlation rate” between rainfall and number of events, andxcorresponds to the proportion of days with events. Thexaxis shows days. Theyaxis shows daily rainfall in mm (above zero) versus the number of rockfalls (below zero).
4.2.2 Results
Figure 4 shows the different cases tested and the correla-tions from a graphical perspective. The correlation is no-ticeable regardless of the proportion x of days with events ifCr=100 %.
If this value decreases, the proportion of days with events has a stronger influence.
Table 3 presents the values of the cross-correlation func-tion for all of the databases, obtained for a time delayk=0. In the case of a high-frequency database (x=43 %), the correlation was detected forCr=50 %. However, the cross-correlation did not permit the establishment of a cross-correlation between rainfall and rockfalls forCr=25 %. The same neg-ative conclusion applies to the case of a database with 13 % of days with events whenCr=50 and 75 % for a “typical” database (x=3 %). Thus, by analogy, the value of the max-imum of the cross-correlation function (0.563) for the Réu-nion database indicated that at least 75 % of the events were correlated with rain.
Table 4 presents the results obtained with the proposed method, allowing us to identify the correlation between rain-fall and number of rockrain-falls, provided that the number of rockfalls and rainfall events are 100 % correlated.
Similar tests were also performed with the rainfall distri-bution for Burgundy (Fig. 6), and the results were found to be similar to those presented here.
5 Application of the proposed method to the three real databases
Table 5 summarizes the correlations identified using the pro-posed method. Only the maximum correlation values are pre-sented in the table. The new method confirms the existence of a positive correlation between rainfall and rockfalls on Réu-nion. This correlation exists with the daily rainfall and with the cumulative multi-day rainfall (Fig. 7) but is more signif-icant in the case of the accumulated rains. The method also detects a correlation between the minimum and maximum temperatures and the rockfalls in the same region, which is not surprising because the rainy season is characterized by both high temperatures and intense rainfall. These correla-tions are maximal for a time delay of 1 day.
Table 3.Values of the cross-correlation between rainfall and rockfalls for three virtual databases, with a time delay of zero days. This value is compared to the significance threshold, which is equal to 0.031 in all cases. The results presented in italic identify the non-significant correlations (values equal to the threshold value were also considered insignificant).
x=43 % x=13 % x=3%
Cr=100 % Maximum value of cross- Maximum value of cross- Maximum value of cross-correlation=0.65 correlation=0.42 correlation=0.23
Cr=75 % Maximum value of cross- Maximum value of cross- Maximum value of cross-correlation=0.45 correlation=0.18 correlation=0.031
Cr=50 % Maximum value of cross- Maximum value of cross- Maximum value of cross-correlation=0.23 correlation=0.031 correlation=0.031
Cr=25 % Maximum value of cross- Maximum value of cross- Maximum value of cross-correlation=0.031 correlation=0.030 correlation=0.026
Figure 5.Histogram of rainfall for Réunion.
occurrence of two successive days with intense rainfall is the most favourable meteorological factor, among those studied, for triggering rockfall events (Fig. 8).
A correlation between the daily minimum temperature and number of rockfalls was also identified for the Auvergne database. The maximal correlation occurred for the mini-mum temperature recorded two days before the event (D2) (Fig. 9). Temperatures lower than 0◦C also triggered rock-fall events after a delay of two days.
For the two databases, no correlation was detected be-tween rockfalls and the daily temperature amplitude or the freezing duration. Another marker of freeze–thaw activ-ity could be the number of freeze–thaw cycle occurrences in a day. This marker is frequently cited in the literature (Douglas, 1980; Matsuoka and Sakai, 1999) and could be used to validate or invalidate our results. Unfortunately, this marker was not available for the studied data.
Table 4.R2andpvalues of the linear regression line obtained by the proposed method for three virtual databases.Cr corresponds to the correlation rate between rainfall and number of events, and
xcorresponds to the proportion of days with events. The results shown in italic identify non-significant correlations.
x=43 % x=13 % x=3 %
Cr=100 % R2=0.98; R2=0.93; R2=0.73;
pvalue∼10−36 pvalue
∼10−18 pvalue
∼10−6
Cr=75 % R2=0.88; R2=0.81; R2=0.57;
pvalue∼10−20 pvalue
∼10−12 pvalue
∼10−4
Cr=50 % R2=0.72; R2=0.71; R2=0.50;
pvalue∼10−11 pvalue
∼10−7 pvalue
∼10−3
Cr=25 % R2=0.54; R2=0.41; R2=0.47;
pvalue∼10−6 pvalue
∼10−4 pvalue>0.05
pvalue=0.06
Cr=10 % R2=0.25; R2=0.18; –
pvalue∼10−3 pvalue>0.05
pvalue=0.13
6 Discussion
6.1 Physical processes involved in each study sites The method presented in this paper highlights several statis-tical correlations between rockfalls and meteorological fac-tors, depending on geology and the climate of the stud-ied sites. Below are several physical interpretations of these correlations.
Figure 6. (a)Histogram of rainfall for Burgundy;(b)application of the method to a virtual database with 56 % of days with events and rain that fits the empirical distribution of Burgundy rainfall. For these days, the rockfall and rainfall magnitudes are 100 % correlated.
Figure 7.Réunion;(a)application of the method to cumulative rainfall over two days (D0+D1);(b)R2of rockfall vs. rain accumulated over several days.
Figure 8.Same as Fig. 7 for Burgundy. Cumulative rainfall over three days (D0+D1+D2)(a).(b)R2of rockfall vs. rain accumulated over several days.
Table 5.Correlations between the chosen meteorological factors and the daily number of rockfalls; results obtained with the proposed method on the real databases. Only the maximum correlations are presented here.
Réunion Burgundy Auvergne
Daily precipitation (P) ForD1−R2=0.70 No correlation No correlation
pvalue=10−9
Correlation coefficient=0.12
Cumulative daily ForD1−R2=0.74 ForD2−R2=0.54 No correlation precipitation (Pc) pvalue=10−13 pvalue
=10−5
Correlation coefficient=0.10 Correlation coefficient=0.012
Daily minimum ForD1−R2=0.69 No correlation ForD2−R2=0.34
temperature (Tmin) pvalue=10−6 pvalue=10−5
Correlation coefficient=0.5 Correlation coefficient=0.05
Daily maximum ForD1−R2=0.60 No correlation No correlation
temperature (Tmax) pvalue=10−5
Correlation coefficient=0.8
Daily temperature No correlation No correlation No correlation
amplitude (Tamp)
Daily freezing No correlation No correlation No correlation
duration
D0is the day of the event(s) studied, and (Dn) identifies thendays before, with n varying from 1 to 10.
Geologically, the steep slopes in Burgundy are mainly characterized by alternating layers of limestone and marl. The marls are capable of absorbing rainwater that infiltrates and causes creeping of the clay minerals contained within the substrate (Peck and Terzaghi, 1948). This process is rela-tively slow and is primarily related to low-intensity rainfall episodes lasting several days. Repeated water infiltrations cause the rupture of the overlying pre-fractured limestone layers via a fatigue effect (Pariseau and Voight, 1979).
Auvergne differs significantly from Burgundy in that the rupture processes leading to block detachments are associ-ated with different geological settings and triggering factors. Auvergne is located in a region of volcanic and plutonic mag-matic rocks, and the main meteorological factor observed to correlate well with rockfalls in this region is a strong negative temperature gradient occurring 2 days before the rockfalls. This correlation can be explained by the freeze–thaw process, inducing progressive expansion and loosening of rock frac-tures by repeated diurnal freezing and thawing of water-filled cavities (Coutard and Francou, 1989; Matsuoka and Sakai, 1999; Matsuoka, 1994, 2008).
6.2 Conditional probabilities used for risk management The new approach also allows the estimation of the condi-tional probability of rockfall given the interval of rain ([Pi,
Pi+1]), to be determined as follows:
P (rockfall given the interval)= Nrd Nd
, (3)
where Nrd is the number of days with at least one event within the considered interval andNdis the total number of days within the considered interval.
Daily rockfall probability Daily rockfall probability: Daily rockfall probability:
0.13 0.02 0.029
0–5 0.09 0–5 0.013 −20;−10 0.1
5–10 0.16 5–10 0.026 −10;−5 0.052
10–15 0.25 10–15 0.036 −5; 0 0.039
15–20 0.32 15–20 0.041 0–5 0.024
20–30 0.39 20–30 0.032 5–10 0.023
30–40 0.45 30–40 0.03 10–15 0.029
40–50 0.55 40–50 0.043 15–22 0.027
50–70 0.54 50–70 0.053
70–90 0.64 70–136 0.111
90–120 0.64
120–150 1
150–200 1
200–516 0.73
6.3 Advantages and drawbacks of the proposed approach
The correlation between rockfalls and meteorological factors is a typical observation. However, the correlations are diffi-cult to detect (cf. Part 3) for databases with fewer rockfalls (such as the Burgundy and Auvergne databases) (Frayssines and Hantz, 2006). By testing the proposed method on a vir-tual database (cf. Table 4), it was confirmed that with a cor-relation rate (Cr) of 100 %, a correlation could be detected even within databases containing very few events (x=3 %). By reducing the correlation rate, a correlation can still be de-tected for only 50 % of days with events completely corre-lated (Cr=50 %). In terms of the size of the intervals used in the correlation analysis, we conducted several tests using either the smallest or largest possible interval size when at least one event and 5 days were observed. The results, ex-pressed in terms of thepvalue, did not change significantly. However, theR2 values increased slightly in the largest in-tervals. Our evaluation of the cross-correlation method using the virtual databases (cf. Table 3) demonstrated that no cross-correlation is detected if there are fewer than 3 % of days with events. Moreover, the cross-correlation analysis appears un-suitable if only one event occurs per day (given that the cross-correlation is calculated as a function of the daily number of rockfalls).
For the proposed method to be applicable, the database must be as complete as possible and re-established on a daily
basis, as is the case when patrolling is performed daily. The study of the correlations between the events of the day (D0) and the meteorological factors of the days before (Dn) is not
possible if these conditions are not met. Furthermore, the studied site should present homogeneous geological condi-tions to allow the statistical analyses to be relevant to the entire database. Indeed, differences in geological conditions may lead to differences in the failure mechanisms (Douglas, 1980; Fityus et al., 2013; Luckman, 1976); in such an event, it is probable that both the triggering factors and statistical conclusions will differ. To be more precise in the analysis, the Burgundy and Auvergne databases could be divided into dif-ferent parts according to the geology. However, the databases are not sufficiently rich to allow this partitioning.
Moreover, the assessment of the conditional probability of rockfall given the interval of the meteorological factor allows us to compare each of the conditional probabilities with the daily rockfall hazard, which corresponds to the proportion of days with events in the entire database.
7 Conclusions
The objective of this study was to identify any possible cor-relation between meteorological factors and rockfalls, even in the case of databases containing very few events. Prelim-inary statistical analyses helped to identify several tions in the case of a “rich” database. However, no correla-tion was detected in the more typical “poor” databases due to the sparse representation of days with several rockfalls. The proposed method uses the probability of occurrence of the chosen triggering factor to assess the influence of this factor on the rockfalls. This approach serves to highlight the correlation between a small number of events and a meteo-rological factor. For a database containing only 3 % of days with events, the method used to detect a correlation assessed whether approximately 50 % of the events were perfectly cor-related with the meteorological factor chosen. The use of this method confirms the positive correlation between rainfall and rockfalls in the Réunion database. It highlights a correlation between the cumulative rainfall and rockfalls in Burgundy, and it detects a correlation between the daily minimum tem-perature and rockfalls in the Auvergne database. The pro-posed method allowed the probability of events to be esti-mated given the value of the meteorological factor studied. These probabilities should be helpful in terms of risk man-agement, for example, for optimizing the patrolling services for each site according to the susceptibility of that site to the meteorological factors.
Acknowledgements. The authors acknowledge Jean-Louis Durville, from the Ministère de l’Ecologie, du Développe-ment durable, des Transports et du LogeDéveloppe-ment, for providing the Réunion database. We also thank him, as well as Nicolas Pollet and Florence Belut from the SNCF, for useful discussions. More generally, we acknowledge the SNCF for providing the Burgundy and Auvergne databases and METEO FRANCE for providing the meteorological data. Finally, we would like to thank the Region of Lorraine for financial support.
Edited by: P. Bartelt
Reviewed by: three anonymous referees
References
André, M.-F.: Holocene rockwall retreat in Svalbard: a triple-rate evolution, Earth Surf. Proc. Land., 22, 423–440, 1997.
Baillifard, F., Jaboyedoff, M., and Sartori, M.: Rockfall hazard map-ping along a mountainous road in Switzerland using a GIS-based parameter rating approach, Nat. Hazards Earth Syst. Sci., 3, 435– 442, doi:10.5194/nhess-3-435-2003, 2003.
Berti, M., Martina, M. L. V., Franceschini, S., Pignone, S., Simoni, A., and Pizziolo, M.: Probabilistic rainfall thresholds for land-slide occurrence using a Bayesian approach, J. Geophys. Res., 117, F04006, doi:10.1029/2012JF002367, 2012.
Brunetti, M. T., Guzzetti, F., and Rossi, M.: Probability distributions of landslide volumes, Nonlin. Processes Geophys., 16, 179–188, doi:10.5194/npg-16-179-2009, 2009.
Bull, W. B., King, J., Kong, F., Moutoux, T., and Phillips, W. M.: Lichen dating of coseismic landslide hazards in alpine moun-tains, Geomorphology, 10, 253–264, 1994.
Chau, K. T., Wong, R. H. C., Liu, J., and Lee, C. F.: Rockfall hazard analysis for Hong Kong based on rockfall inventory, Rock Mech. Rock Eng., 36, 383–408, 2003.
Coutard, J.-P. and Francou, B.: Rock Temperature Measurements in Two Alpine Environments: Implications for Frost Shattering, Arct. Alp. Res., 21, 399–416, doi:10.2307/1551649, 1989. Douglas, G. R.: Magnitude frequency study of rockfall in
Co. Antrim, N. Ireland, Earth Surf. Proc., 5, 123–129, 1980. Durville, J. L.: Remarks on the use of probability techniques in the
field of natural hazards: The cas of landslides, Bulletin des labo-ratoires des Ponts et Chaussées, 249, 3–17, 2004.
Dussauge, C., Grasso, J. R., and Helmstetter, A.: Statis-tical analysis of rockfall volume distributions: Implica-tions for rockfall dynamics, J. Geophys. Res., 108, 2286, doi:10.1029/2001JB000650, 2003.
Fityus, S. G., Giacomini, A., and Buzzi, O.: The significance of geology for the morphology of potentially unstable rocks, Eng. Geology, 162, 43–52, doi:10.1016/j.enggeo.2013.05.007, 2013. Frayssines, M. and Hantz, D.: Failure mechanisms and
triggering factors in calcareous cliffs of the Subalpine Ranges (French Alps), Eng. Geology, 86, 256–270, doi:10.1016/j.enggeo.2006.05.009, 2006.
Gunzburger, Y., Merrien-Soukatchoff, V., and Guglielmi, Y.: Influ-ence of daily surface temperature fluctuations on rock slope sta-bility: case study of the-Rochers de Valabres-slope (France), Int. J. Rock Mech. Mining Sci., 42, 331–349, 2005.
Helmstetter, A. and Garambois, S.: Seismic monitoring of Séchili-enne Rockslide (French Alps): analysis of seismic signals and their correlation with rainfalls, J. Geophys. Res., 115, F03016, doi:10.1029/2009JF001532, 2010.
Hipel, K. W. and McLeod, A. I.: Time Series Mod-elling of Water Resources and Environmental Sys-tems, European Environment Agency – EEA, available from: http://www.eea.europa.eu/data-and-maps/indicators/ chlorophyll-in-transitional-coastal-and/methodologyreference. 2012-07-08.9058722654 (last access: 7 November 2013), 2005. Hoek, E.: Practical rock engineering, http://www.rocscience.com/
education/hoekscorner (last access: 2013), 2007.
Hungr, O., Evans, S. G., and Hazzard, J.: Magnitude and frequency of rock falls and rock slides along the main transportation cor-ridors of southwestern British Columbia, Can. Geotech. J., 36, 224–238, doi:10.1139/t98-106, 1999.
Ilinca, V.: Rockfall Hazard Assessment. Case study: Lotru Valley and Olt Gorge, in: Revista de geomorfologie, vol. 11, Paper pre-sented at the “IAG Regional Conference on Geomorphology: Landslides, Floods and Global Environmental Change in Moun-tain Regions”, 15–25 September 2008, Bra¸sov, Romania, 101– 108, 2008.
doi:10.1016/j.geomorph.2007.11.013, 2008.
Matsuoka, N. and Sakai, H.: Rockfall activity from an alpine cliff during thawing periods, Geomorphology, 28, 309–328, 1999. Pariseau, W. G. and Voight, B.: Rockslides and avalanches:
Ba-sic principles and perspectives in the realm of civil and mining operations, in: Rockslides and Avalanches, 2. Engineering sites, edited by: Voight, B., Elsevier, Amsterdam, 1–92, 1979. Peck, R. B. and Terzaghi, K.: Soil mechanics in engineering
prac-tice, John, available from: http://sypdf.yombabook.com/ralph_ soilmechanicsin_pdf8828310.pdf (last access: 22 May 2014), 1948.
on rocks during the 12 April 1998 upper Soˇca Territory earth-quake (NW Slovenia), Tectonophysics, 330, 153–175, 2001. Wieczorek, G. F., Snyder, J. B., Alger, C. S., and Isaacson, K. A.:
Yosemite historical rockfall inventory, US Geol. Surv. Open File Report 92-387, US Geological Survey, 38 pp., 1992.