784
Hydrological and meteorological aspects of floods in the Alps: an
overview
Baldassare Bacchi and Roberto Ranzi
Università di Brescia, Dipartimento di Ingegneria Civile, Via Branze, 38, I-25123 Brescia, Italy
E-mail for corresponding author:[email protected]
Abstract
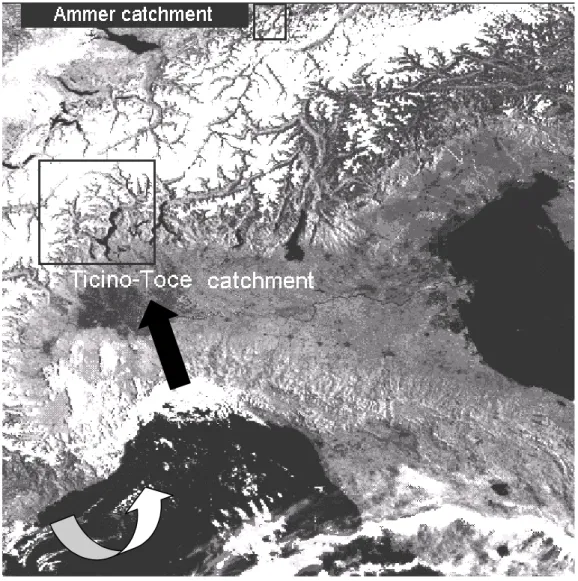
This introductory paper presents and summarises recent research on meteorological and hydrological aspects of floods in the Alps. The research activities were part of the international research project RAPHAEL (Runoff and Atmospheric Processes for flood HAzard forEcasting and controL) together with experiments within the Special Observing Period-SOP conducted in autumn 1999 for the Mesoscale Alpine Programme MAP. The investigations were based on both field experiments and numerical simulations, using meteorological and hydrological models, of ten major floods that occurred in the past decade in the European Alps. The two basins investigated were the Ticino (6599 km²) at the Lago Maggiore outlet on the southern side of the Alps and the Ammer catchment (709 km²) in the Bavarian Alps. These catchments and their sub-catchments cover an appropriate range of spatial scales with which to investigate and test in an operational context the potential of both mesoscale meteorological and distributed hydrological models for flood forecasting. From the data analyses and model simulations described in this Special Issue, the major sources of uncertainties for flood forecasts in mid-size mountain basins are outlined and the accuracy of flood forecasts is assessed.
Keywords: floods, mountain hydrology, meteorological models, Alps
Introduction
Many of the floods which caused major damage and loss of life in Europe in recent years occurred in the Alps. This was due to several reasons, some because of the heavy anthropic load, much higher than in other mountain chains of the Earth, others because of the peculiar geomorphology of the Alps and their geographical position with respect to the winds and sources of moisture feeding frontal meteorological systems. From a scientific point of view, these conditions are such that the Alps provide an appropriate natural laboratory to investigate the mechanism of flood formation in mountain areas. Since the end of the 19th century, the observational network has been extended
to high altitudes. In some areas it is very dense, enabling extended climatological studies. Extreme events are frequent, occurring somewhere in the Alps almost every year. From a meteorological point of view, the Alps are a natural barrier, forcing the southerly moist winds, with high equivalent potential temperatures, to rise to altitudes where forced convection and the release of their potential instability
785 (Frei and Schaer, 1998) and gives rise to some of the most
severe flood events in Europe, with a mean annual specific peak flow of about 1 m³ s1km² for basins larger than 1000
km² and dangerous debris flow hazards. The flood over Lago Maggiore in October 1868, when the level of the lake reached a depth of 6.94 m above the zero of the Sesto Calende gauge, was a particularly memorable event. But also in more recent years, severe flood episodes, with damage and loss of lives, occurred in the Rhone and Ticino catchments and tributaries, for instance in September and October 1993, in November 1994 and in October 2000. These are the key reasons why the Alps were selected as one of the target areas for an international research project, named RAPHAEL (Runoff and Atmospheric Processes for flood Hazard forEcasting and controL) and for the intense hydrological measurement campaigns of the Special
Observing Period-SOP of the Mesoscale Alpine Programme-MAP, in the autumn of 1999. Because severe floods, with different generating mechanisms, occur on the northern side of the Alps as well, a basin in the Bavarian Alps, the Ammer catchment, was selected to study its flood-forecasting problems. During the research programme, it experienced the highest flood ever recorded since the beginning of the last century.
The first six papers in this Special Issue deal mainly with the investigations conducted within the RAPHAEL project; the last five describe the numerical and field experiments conducted during the MAP-SOP. Because mountain hydrology and meteorology is, in general, a challenging scientific issue (see Burlando et al., 2002), the conclusions presented here are of some relevance.
Fig. 1. The two study areas of the project, on the southern and northern side of the Alps. The large dark arrow indicates the preferred direction of southerly winds, with high equivalent potential temperature, q
e, originating over the Mediterranean and producing high floods over the
786
The RAPHAEL Project
The basic objective of the RAPHAEL project (Bacchi and Ranzi, 2000) was to develop, implement and demonstrate the use of coupled meteorological and hydrological models at the regional scale to improve flood forecasting and management in complex mountain catchments. To achieve this objective, meteorologists, hydrologists and radar experts in 11 research partners from Italy, France, Switzerland, Germany and Canada, with different experience and scientific backgrounds, contributed to several specific project tasks; several partners offered multidisciplinary expertise.
Two specific target areas were identified: the Ammer catchment (709 km² at the Fischen gauge) in the Bavarian Alps which experienced a major flood in May 1999, and the (6599 km²) Lago Maggiore catchment upstream of the Miorina dam, betweenSwitzerland and Italy (see Fig. 1). The latter basin is drained by the rivers Ticino, Maggia and Verzasca (located in Switzerland) and the Toce (mainly in Italy) and other minor tributaries and is at the centre of one of the most rainy areas in Europe.
Eight major flood events that have occurred in recent years were investigated, on the basis of detailed hydro-meteorological data (Table 1).Using five hydrological models forced by four mesoscale meteorological models, raingauge and radar data, numerical simulations assessed the accuracy that can be achieved, on average, in predicting floods 24 hours in advance in medium-size basins, i.e. with an area of about 1000 km².
PHYSIOGRAPHIC DATA
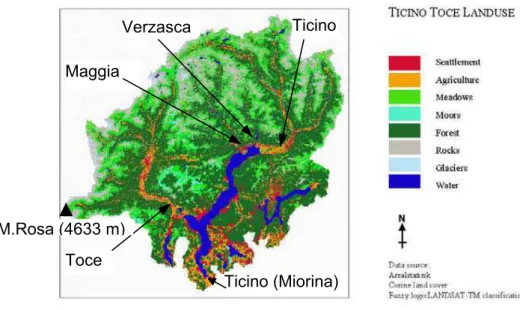
In the Ticino basin at the outlet of Lake Maggiore, the altitude ranges from 190 m a.s.l. at the Miorina dam, to 4633 m of the Monte Rosa peak. The estimated mean annual precipitation is 1695 mm and the runoff is 1395 mm. To improve the coarse resolution of the Corine data-set land cover, a fuzzy logic LANDSAT-TM classification for the Toce catchment was performed (see Bach et al., 2003). The method used and the comparison of this classification method with a more traditional one is described in detail. The same paper shows how data on vegetation and albedo derived from remote sensing can provide useful information to compute evapotranspiration using a water balance model. For the definition of the soil characteristics in the Ticino-Toce area, the water permeability map of the Swiss data base (E.F.L.P., 1980) was used, based on saturated permeability measurements in the laboratory. Field surveys showed a relationship between precipitation, permeability and morphological characteristics and, to produce the map of surface saturated conductivity in the Swiss part of the basin, the values of the less permeable soil layers of the upper 0.5 m were used.
For the Toce catchment in Italy, the map was based on several field campaigns at 146 sites and different soil depths in the upper half-metre. The data collected for 60 soils and 40 rock samples in a first survey were later complemented by additional 86 soil samples (Clerici and Cantoni, 2000). For the samples collected at the first 60 sites, soil retentivity curves were estimated using Richards extractors; field
Fig. 2. Main land-use categories in the Ticino-Toce catchment (6599 km²), closed at the Miorina dam. The arrows indicate the outlet of the major sub-basins: Ticino at Bellinzona (1515 km²), Verzasca at Lavertezzo (186 km²), Maggia at Locarno (926 km²), Toce at Candoglia (1532 km²).
Ticino Verzasca
Maggia
M.Rosa (4633 m) Toce
787
Table 1. The flood events selected in the Ticino (1 to 4) and Toce (1 to 6) basins and for the Ammer catchment (7 to 10). The eight in italics were investigated in the RAPHAEL project. Observed flood peak values for the Toce at Candoglia and the Ammer at Fischen are reported.
No. Code Start date (time) End date (time) Year Name Peak (m³ s1)
1. TT1 22.09 (04 UTC +01) 25.09 (04 UTC +01) 1993 Brig 2535
2. TT2 11.10 (22 UTC +01) 14.10 (22 UTC +01) 1993 Locarno 941
3. TT3 03.11 (15 UTC +01) 06.11 (15 UTC +01) 1994 Piedmont 978
4. TT4 27.06 (06 UTC +01) 30.06 (06 UTC +01) 1997 Snowmelt 928
5. IOP2b 19.09 (12 UTC) 22.09 (00 UTC) 1999 IOP2b 1462 6. TT5 12.10 (00 UTC) 17.10 (12 UTC) 2000 Po-Rhone 2536
7. A1 16.07(20 UTC +01) 20.07(21 UTC +01) 1993 175
8. A2 27.08 (21 UTC +01) 30.08 (21 UTC +01) 1995 158
9. A3 17.07(14 UTC +01) 20.07(14 UTC +01) 1997 147
10. A4 20.05(00 UTC +01) 24.05 (00 UTC +01) 1999 Whitsun 469
Fig. 3. Ticino and Toce basins: major permeability classes (map compiled by Mauser et al., in Bacchi and Ranzi, 2000).
measurements of infiltration rates were used to estimate saturated conductivity using the Reynolds and Elrick (1990) method based on single ring infiltrometer data (Barontini et al., 2004). These data were compared with those retrieved from laboratory measurements with a falling head permeameter, a method similar to that used to determine conductivities in the Swiss portion of the basin.
The comparison showed a systematic bias in field data with values up to one order of magnitude higher than
788
significantly. It can also be expected that hydrological simulations are influenced by the way data were collected. The dominant textures of the soils were loams and sandy loams, with the pore size distribution index and the bubbling pressure highly dependent on the organic content of soils. As a consequence, the derivation of soil parameters using pedotransfer functions, as often occurs in hydrological practice, may be quite difficult.
The altitude of the Ammer catchment ranges from 533 m a.s.l. to 2180 m a.s.l.. The mean annual precipitation is 1200 mm and the mean annual streamflow at the outlet is 738 mm.
To generate the land-use layer for the Ammer catchment, two LANDSAT-TM images (dating from May 28th 1992 and
July 8th 1995) were classified with the help of fuzzy logic.
The basin is mainly forested, with pasture and crops: loams and mountain rendzina soils predominate. Information about the distribution of soil parameters in the Ammer catchment and their use in flood simulations for that basin can be found in Ludwig et al. (2003), where the possibility of using hydrometeorological models for flood forecasting is investigated also. During the present research the basin experienced the most severe flood ever recorded, the Whitsun flood (see Table 1) and one of the meteorological models used in the project provided operational precipitation forecasts of reasonable quality. This event was also strongly influenced by snowmelt, as also occurred, with minor relevance, for the TT4 event in the Ticino area.
PRECIPITATION, RUNOFF AND RADAR DATA
For the Ticino-Toce area, a detailed data set of precipitation was required from raingauges operated by national, regional and private data providers in Italy and Switzerland as well as the Monte Lema radar operated by the Swiss Meteorological Service. Data from more than 100 raingauges (see Fig. 4) were available, on average, for the precipitation events investigated, thus resulting in an average homogeneous station density, of one per 100 km2, a relatively
high value for such a wide mountain area. The events selected are presented in Table 1. The meteorological aspects of some of these events were also investigated in detail in previous research programmes (see, for instance, Volkert, 2000). The first four were simulated within the RAPHAEL project and the capability of different meteorological and hydrological models to simulate precipitation and runoff was investigated. Data from 21 streamgauges and the 25 major reservoirs distributed in the Ticino basin were used to verify the timing and the magnitude of the simulated runoff and to assess the effect of reservoirs in storing part of the runoff.
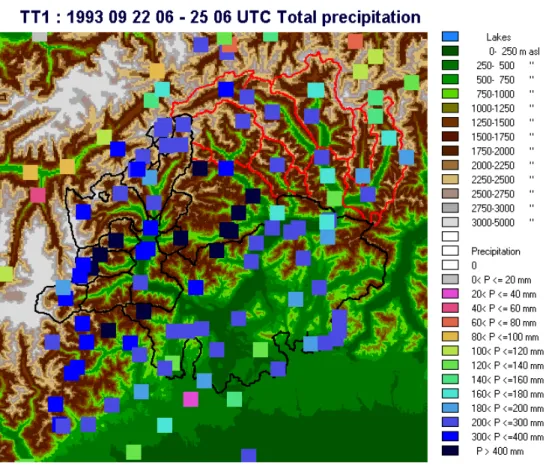
In the Ammer catchment, streamgauge data were collected at eight stations. Compared with the Ticino basin, the effect of reservoirs is negligible. Radar data for some of the selected events, such as the TT1 Brig flood represented in Fig. 5, were of relatively good quality, after calibration using raingauge measurements, but for some events, e.g. the October 1993 TT2, Locarno flood and for three of the Ammer episodes, they were not very accurate. Radar data from the DWD radar in Fuerholzen, after correction for beam blockage using raingauge data, provided a realistic pattern of precipitation for the May 1999 flood, which compared well with observations, and a rainfall volume consistent with the observed runoff hydrograph.
The Monte Lema radar was being installed during the TT1 episode and, thus, it was necessary to adjust the different calibration levels to achieve consistency over time. A comparison with the precipitation volumes observed by gauges showed that further corrections to the pre-processed data were necessary. The radar tends to overestimate precipitation close to the radar and then underestimate it further away. Also, most of the stations outside the catchment have a much higher scatter. As described by Gabella et al. (2000) the correction (or assessment factor) is a function of the distance from the radar, the minimum height of the radar beam above the gauge (visibility) and the height of the gauge. The high scatter for stations with a range more than 45 km is caused by restricted visibility (part of the beam being blocked by the mountains, only part of the total reflectivity is measured). For the TT3 and TT4 events also, radar data, estimated with a standard conversion Z=315 R1.5
of reflectivity Z (dbZ) into rainfall rate R (mm h1), were
corrected using a multiplicative correction factor for the estimated rainfall rate, ratio = 0.5 + 0.016 d (TT3) and ratio = 3.5 + 0.008 d (TT4), with distance d expressed in km (Hagen and Meischner, in Bacchi and Ranzi, 2000). With the above calibration procedure, radar data for two events were used to investigate the statistical structure of precipitation at different spatial scales. Recent progress with the Z(R) conversion for the Monte Lema radar are reported by Hagen and Yuter (2003) on the basis of detailed data collected during the MAP-SOP.
PRECIPITATION FORECASTS USING MESOSCALE
METEOROLOGICAL MODELS
Fig. 5. The total precipitation during the Brig event from 1993 September 24 at 06 UTC to 25 06 UTC in the Ticino-Toce catchment, observed from raingauge stations and the Monte Lema radar (after Hagen and Meischner, in Bacchi and Ranzi, 2000).
forecasting possibility given the available exact information about the initial and boundary conditions of the atmosphere. This depends on the accuracy of the meteorological monitoring and of the data assimilation procedures in the large scale Global Circulation Models (such as the German EM-Europa Model or the ECMWF) used in the project. The forecast mode, operationally more interesting, is representative of situations similar to reality, when high resolution Limited Area Model simulations might be requested and the initial and boundary domain conditions are driven from the operational forecasts of GCMs. Sensitivity with respect to the lateral boundary conditions used, to the spatial resolution and to the schemes to represent microphysics are reported in the same paper and by Kaufmann et al. (2003).
HYDROLOGICAL MODELLING
Five hydrological models were implemented, calibrated and tested in the different basins investigated, as listed in Table 2 where appropriate references are reported. Their parameters are either distributed (Models 2, 4, 5) or semi-distributed in space, and include a snowmelt and a rain snow precipitation partitioning. Flood routing schemes are
based on linear or conceptual methods (1, 2, 3), or on more detailed distributed Muskingum-Cunge schemes. Models 4 and 5, basically based on a conceptual scheme for rainfall partitioning in runoff and infiltration, differ in the way the soil parameters are set, on the basis of pedotransfer functions (4) or field measurments (5). Soil moisture dynamics are accounted for in the interstorm period for the models 1, 2, 3, while models 4 and 5 are event-based, with initial conditions based on an antecedent precipitation index. Because the raingauge density was about 1/100 km2 in all
the basins investigated and the precipitation data were of good quality, the set-up and verification of the models was conducted on the basis of hourly raingauge data alone. Soil parameters of model 1 were derived, without any significant change, on the basis of the land-use data available and the experience gained in the simulation of floods in the Rocky Mountains. The parameters of model 5 were set on the basis of the same land-use data but also on the field and laboratory measurements of saturated conductivity and surveys on the river network. No parameter was changed when the precipitation input was provided either by the meteorological fields simulated by the meteorological models or radar data. Runoff hydrographs were simulated with these three sources of precipitation data. Because of the way the respective
Table 2. List of hydrological models tested in the research presented in this issue. Precipitation forcing was provided by raingauge, meteorological fields and/or radar data.
HYDROLOGICAL MODEL BASIN
Toce (I) Ticino- Ammer (D)
Verzasca-Maggia (CH)
1. Watflood
Infiltration excess, semi-distributed, continuous time, conceptual routing (Kouwen at al., 1993)
X X X
2. Wa-Sim
Infiltration excess, distributed, continuous time, conceptual routing (Jasper et al., 2002)
X
3. PROMET-TOPMODEL
Saturation excess, semi-distributed, continuous time, conceptual routing
(Ludwig et al., 2003) X
4. FEST98RS
Saturation excess, distributed, event-based, hydraulic routing
(Montaldo et al., 2002) X
5. DIMOSOP
Saturation excess, distributed, event-based, hydraulic routing
mesoscale models are initialised and run when
meteorological fields were used, the precipitation intensity would be known 24 hours in advance, on average, if they were run in an operational context. This happened, for instance, for the SM model in predicting the Whitsun flood on the Ammer catchment, and the MC2 and BOLAM during the IOP2b event during the MAP-SOP, both in 1999.
Also, the hydrological models 1 and 5 were tested in real time during the MAP-SOP experiment to simulate the floods in some basins (Toce at Candoglia and Ticino at Bellinzona, for instance) and so their simulations have the value and the limitations of an actual 1-day in advance flood forecast. Details of this forecast demonstration experiment can be found in Ranzi et al. (2002, 2003) and in Kouwen and Innes(2001).
Sensitivity investigations on the models results to the precipitation input used (Ludwig et al., 2003), to the spatial localisation of storms (Kouwen and Innes, 2001; Jasper et al., 2002), and to the numerical scheme adopted to represent cloud mycrophysics (Benoit et al., 2003) are discussed in detail in the respective papers.
All the models simulations are consistent in showing how raingauge networks, in the configuration adopted, are still the most reliable source of precipitation input to simulate floods, when compared with radar data or NWPs. It has to be recognised, however, that this comparison is unfair because raingauge data were also used to set-up and, in some cases, to calibrate the hydrological models.
In an operational context, it was also verified how it is more difficult to use raingauge data in real time, than precipitation fields forecasted by meteorological models, whose output does not depend on ground-based measurement and transmission systems, often troublesome during floods. In this sense mesoscale models can also represent a useful source of meteorological data in case surface data transmission fails.
Hydrological measurements and flood
simulations during the MAP-SOP
experiment
In the autmn of 1999, an experiment prepared over a previous five-year period was conducted in the Alps, aiming to improve understanding of the dynamics of flow, the mechanisms of precipitation (Medina and Houze, 2003; Rotunno and Ferretti, 2003) and flood production in mountain areas, specifically in the Alps (Bougeault et al., 2001). The Special Observing Period (SOP) experiment was conducted from September 7 to November 15, and concerning hydrological aspects, it was focused on three
key research subjects.
Firstly, from a hydrological point of view, it was planned to test and demonstrate in real time or near real time the forecast capabilities of hydrological flood models, forced by advanced mesoscale atmospheric models, like those available during the SOP. A dense network of precipitation and river level gauges provided data for detailed analyses of the hydrological processes during the (not very severe, however) flood events that occurred during the MAP-SOP experiment.
Using two models, it was indeed possible to issue runoff forecasts in advance of the major flood events: one, DimoSOP (DIstributed hydrological MOdel for the Special Observing Period), was tested for a real-time flood-forecast (Ranzi et al., 2003) forced by the BOLAM meteorological forecasts on a hourly time basis and a 7 km resolution, and a second, WATFLOOD, forced by the MC2 models output (Benoit et al., 2003).
In the DimoSOP model:
l rainfall is partitioned into runoff and infiltration according to a distributed Soil Conservation Service scheme, with soil classes determined on the basis of the permeability map derived from field and laboratory measurements;
l precipitation is partitioned into rain and snow as a function of air temperature;
l snowmelt is computed by a degree-day method; l reservoirs have a neutral effect, i.e. during floods their
level is assumed constant;
l runoff is routed with a dynamic Muskingum-Cunge scheme (Ranzi et al., 2002) discriminating overland flow and channel flow over a regular grid with 100 m (or 250 m) spacing.
The overall performance of this model was quite satisfactory in reproducing the timing and the volume of the IOP2b flood but the peak was overestimated, partly because of an over-estimation of the precipitation forecast by the meteorological model initialised 24 hours before the flood occurred. The same model was also used to simulate the Po and Rhone flood of October 2000 and the four events investigated in the RAPHAEL project (Bacchi et al., 2002).
catchments, in basins with an area up to 94 322 km². No flood events were missed in a wide area, including a large portion of the Alps. Runoff data were useful, together with raingauge observations, to detect a systematic underestimation of precipitation in the MC2 version during the SOP, as pointed out by Benoit et al. (2003).
The second aspect that was addressed during the SOP was the role of some human-influenced initial conditions of the surface water system, in particular the water storage in reservoirs, on the runoff generation during floods. In the Alps, complex hydropower systems and reservoirs have been built since the end of the 19th and the beginning of the 20th centuries. The Toce basin was almost completely exploited and today a total reservoir volume of 151 Mm³ is available, corresponding to 100 mm of storage. During the SOP, hydropower companies in this basin transmitted, on a regular basis, data on the water level at some major reservoirs, thus giving useful indications of the residual storage capacities of reservoirs and their potential effect on the reduction of runoff volumes downstream of the dams. During the IOP2b event, reservoir storage of about 10% of the total flood volume was observed. A minor effect was observed in the September 1993 Brig flood when reservoirs collected 6% of the flood volume. During the October 1993 event (TT2), reservoirs were already filled after the September flood period and stored only 5% of the flood volume, as happened also in the TT3 event. On the contrary, for the TT4 event, reservoirs stored 25% of the flood volume: this event occurred in June, a period when reservoirs, in the Italian Alps, are almost empty after the winter and spring and ready to store snowmelt runoff.
The third objective was to study the role of soil moisture prior to flood events in determining the production of runoff and evapotranspiration processes. The soil moisture was sampled continuously at five sites in the Toce (Menziani et al.; Montaldo et al., 2003) and Ticino basins (Zappa and Gurtz, 2003), and in greater spatial detail (Falappi et al., 2001), during the four missions of a helicopter-borne microwave radiometer in the C-X and L band and different polarisations (Macelloni et al., 2003).
The sensitivity of the radiometer to different surface types was confirmed although electromagnetic interferences prevented a completely successful use of the microwave antennae for soil moisture monitoring in the areas investigated. Ground and laboratory measurements confirmed a relatively high variability of soil moisture (from 30% to 60% in terms of volumetric content) during the Special Observing Period, indicating how in wet areas and wet seasons the soil moisture can control processes of mass and energy flux at the soil-atmosphere interface. In consequence, evapotraspiration fluxes measured with
different instruments and simulated by different models (Grossi and Falappi, 2003) exhibit large fluctuations: average values are close to 1 mm day1, during the
September to November SOP period, in the sites selected for the field experiments.
Sources of uncertainty in the flood
simulations and downscaling of
precipitation forecasts
OTHER SOURCES OF UNCERTAINTY
Several sources of uncertainty in using mesoscale meteorological models fields as input to hydrological models for an accurate flood forecast are reviewed here. Some of them pertain mainly to the meteorological component of the forecasting chain tested and discussed in more detail by Richard et al. (2003). Others relate to inappropriate knowledge of the hydrological system or to the limits of the mathematical models adopted to represent it.
l The meteorological fields can be predicted wrongly due to inaccurate definition of the initial and boundary lateral conditions provided by large scale models (e.g. the ECMWF or the Europa Model used in present investigations) necessary to run the mesoscale models. When running the mesoscale model in the analysis (hindcast) or in the forecast mode, little difference in the timing and location of the precipitation fields simulated 24 to 36 hours in advance.
l Concerning the detail of the mathematical treatment of the atmospheric dynamic, the use of non-hydrostatic models (MESO-NH, MC2) seems not to improve on, in terms of forecast skill, the simpler and less computationally-demanding hydrostatic models (BOLAM, SM), at least for the type of events simulated: these deal mainly with precipitation systems organised at the synoptic scale and forced by steep orography. This is true at least for basins larger than, or close to, 1000 km².
l Also, despite improving the detailed representation of the cloud mycrophysics, the improvements in the model are not very evident.
l Even more important is the effect of the spatial resolution of the computational grid, resulting in an increase of up to 50% in precipitation, mainly because of the higher vertical gradients of the topography and the resulting vertical velocity of the air masses.
hours ahead, with differences of the order of 50%100%
but without significant systematic biases, and timing errors of up to 612 hours in the prediction of the highest precipitation peaks.
From a hydrological point of view, it was possible to compare some of the five hydrological models mentioned above for the Toce, Ticino and Ammer catchments, using the same meteorological input. The comparison was possible for three hydrological models in the Toce basin at Candoglia (DimoSOP, FEST98RS and WATFLOOD) and the results of the simulation of the six floods in Table 1 are summarised in Fig. 6. It shows how the three conceptual hydrological models produce a sufficiently accurate simulation of the peak flow using the raingauge precipitation input: average errors are below 20% of the observed peak discharge for the three models. No major inconsistencies between the three models can be observed. Figure 6 also shows how a multi-model ensemble obtained by the four meteorological multi-models, either in analysis or in the forecast mode, forcing the three hydrological models, results in a wide spread in the simulated flood peaks. This spread is of the order of 100% of the observed peak for floods around 1000 m³ s1, close to
the mean annual flood, but is smaller for the two higher floods, above 2000 m³ s1, with differences of about 50%.
No systematic differences can be observed when adopting the meteorological fields obtained in the analysis and forecast mode. The standard deviation of the multi-model peak simulation is, on average, 68% of the observed peak flows. Similar results were obtained by Ludwig et al. (2003)
for the Ammer catchment and by Jasper et al. (2002) for the Ticino, Verzasca and Maggia basins. In terms of runoff volumes, Bacchi et al. (2002) found an underestimation of 10%, on average, of the runoff volumes observed at different gauging stations in the Toce river when the meteorological fields predicted by the BOLAM model were used as input; this value was even better than that (15%) obtained using raingauge data.
In summary, the major source of uncertainty in flood simulation is, firstly. the choice of meteorological model adopted and then its spatial resolution.
PRECIPITATION DOWNSCALING
The problem of downscaling precipitation fields simulated by mesoscale models at coarse resolution to a scale more compatible with lateral slopes of small basins is addressed, in the scientific literature, using different methods. Examples are combined Markov schemes and random sampling of rainfall intensities from a given probability distribution function (Mackay et al., 2001), multifractal generators (Deidda, 2000) or geostatistical methods (Fiorucci et al., 2001). Lanza et al. (2001) review recent advances in this topic.
A downscaling technique based on an inverse wavelet transform has been applied here. In the early 1990s, the wavelet transform became a popular tool to investigate at different scales the structure of fields with localised fluctuations, such as that of rainfall. This mathematical
Fig. 6. An ensemble of the simulations of six floods in the Toce river at Candoglia using three different hydrological models: DimoSOP(D), FEST98RS(F) and Watflood(W). They were forced by observed precipitation (gauges), and four meteorological models run in analysis mode (AN) and in forecast mode (FC), as described in the paper. Simulations with radar data for two events are represented also.
Toce at Candoglia (1532 km²)
0 1000 2000 3000 4000
0 1000 2000 3000 4000
Observed peak (m³/s)
Simulat
ed peak (
m
³/
s)
D-gauges
D-BOLAM-FC
F-gauges
F-AN
F-FC
F- radar
W- raingauge
W-AN
W-FC
method is based on the projection of the original field onto a new space of functions with an orthogonal basis that is constructed by dilation and translation of a function, called mother, wavelet or ondulette. The use of a localised orthogonal basis for projecting functions from a multi-dimensional space to another is not recent but its application to the analysis of geophysical fields such as turbulence or rainfall (Kumar and Foufoula Georgiou, 1993; Marazzi et al., 1996) is quite recent. Ranzi (1994) showed how using Daubechies-4 wavelets, some rainfall fields in Northern Italy monitored by radar (Bacchi et al., 1996) were synthesised more precisely than by using a Fourier transform, by keeping just 5% of the coefficients of both transformations with a major amplitude. Perica and Foufoula Georgiou (1996), after having observed that some statistics of the wavelet spectra were linked to the Convective Available Potential Energy of midlatitude mesoscale convective systems, used the wavelet transform to test the possibility of downscaling a 2-D rainfall field observed by radars in the PRE-STORM experiment. As a development of the idea presented at that time, and in the framework of the study of orographic precipitation, the possibility of using the Monte Lema radar images for downscaling contemporary precipitation forecasts of the Swiss Model is investigated here. Without going into its mathematical details, the algorithm applied is based on the following steps:
1. 10-min radar images are corrected for systematic beam-blockage errors;
2. the precipitation fields simulated by the SM model on a 8 × 8 grid with a side length of about 14 km, covering the Ticino-Toce area, are wavelet-transformed using a two-dimensional Haar basis;
3. the standard deviation, s
l, of the fluctuations of the field
at different spatial resolutions l and in the eastwest, northsouth and diagonal directions i (i=1,2,3) are estimated by means of anisotropic scaling laws s
l,i=s0,il
Hi;
4. it was observed that fluctuations were distributed approximately according to a Gaussian function, with zero mean and standard deviation s
l,i = s0,il
Hi;
5. the amplitude of rainfall fluctuations at smaller scales, down to about a 0.9 km, are generated randomly according to a Gaussian probability distribution with zero-mean and a scale-dependent standard deviation, s
l,i;
6. the resulting field of wavelet coefficients is inverse-transformed to produce the disaggregated rainfall field; 7. because negative values may occur, the corresponding pixels are set to zero and the respective pixel at the original SM resolution is re-normalised to keep the original average rainfall volume.
This downscaling procedure can be randomised by generating different samples of the Gaussian wavelet coefficients.
It is worth noting that the disaggregation scheme preserves the average rainfall intensities exactly at all scales, thus respecting the law of conservation of the mass of water that is preserved by the meteorological models. Another valuable property is that the resulting field an example is given in Fig. 7 keeps the second order statistics of the fluctuations at all the spatial resolutions and in the three directions.
To test the influence of this downscaling scheme on the resulting flood hydrographs, the TT1 and the TT3 events were simulated using, as the hydrological model component, the DimoSOP model. The meteorological forcing was given by the SM precipitation forecasts (Kaufmann et al., 2003) at the original scale (14 km) and at finer resolution (0.9 km), after the spatial disaggregation. The resulting flood peaks, Q14 and Q0.9 respectively, were computed at 19 gauging stations corresponding to 8 automatic river level gauges and 11 reservoirs in the Toce basin. The respective areas range from 2.6 km² of the Busin reservoir to the 1536 km² of the catchment upstream of the Candoglia streamgauge, thus spanning four orders of magnitude in size. The results are summarised in Fig. 8, where the percentage peak errors, defined as 100(Q0.9 Q14)/Q14, are represented as a function of the basin area, for each of ten randomised downscaling cascades. It is quite interesting, but not surprising, to observe how at the smaller basin areas, less than 100 km², the influence of the disaggregation scheme is not completely negligible, resulting in average changes to the peak of about 5% and larger than 30% in one case. This is a result of the non-linearity of the soil model adopted. For larger basin areas, for instance at the outlet of the Toce river at Candoglia, the hydrological response seems to be insensitive to the downscaling of the precipitation field at finer spatial scales. It has to be stressed, however, that the disaggregation scheme preserves only some statistical properties of the radar-observed field and not, for instance, the spatial correlation.
Conclusions
Sensitivity to the SM precipitation resolution - TT3 : ensemble
-50% -40% -30% -20% -10% 0% 10% 20% 30% 40% 50%
1 10 100 1000 10000
Basin area [km²]
% Peak dif
fe
rence
Fig. 8. The percentage difference 100 (Q0.9Q14)/Q14 in the simulated flood peaks using the 14 × 14 km resolution SM precipitation forecasts, Q14, and the 0.9 × 0.9 km ones, Q0.9, after the Wavelet-disaggregation. 19 gauging sites in the Toce river basin are selected. Circles represent the result of each of ten downscaling realisations. Error bars represent the standard deviation and the line is the linear fit in the semi-logarithmic chart.
Fig. 7 - The original 8 ×8 cells field with 14 km resolution of the precipitation forecast for the hour before 6 November 1993 at 0:00 by the Swiss Model (left) during the Piedmont case and the same field downscaled over 128 ×128 cells with side length of 0.9 km (right).
0 25 50 75 100 125
0
25
50
75
100
125
W-E
N-S
0 5 10 15 20 25
[mm/h]
SM 1994 11 06 00:00 Disaggregated rainfall field
0 25 50 75 100 125 0
25
50
75
100
125
W-E
N-S
0 5 10 15 20 25 30
[mm/h]
SM 1994 11 06 00:00 rainfall field
1 At the scale of small catchments (some hundreds of square kilometres or less) the present day hydro-meteorological forecasting systems are not very reliable. At this scale, uncertainties in the precise location in space and time of the storms are still too high for realistic flood forecasts some hours in advance. Physically-sound
796
2 At the scale of medium-sized catchments (from 1000 to 10 000 km²), the one-way forcing of hydrological models with mesoscale meteorological models can become a useful short-term support for flood forecasting. The analyses illustrated in this Special Issue give some indications, and many of them are positive:
l spatial and temporal scales of NWP models and hydrological models are now sufficiently close for most needs;
l the spatial variability and the intermittency of the simulated precipitation fields look realistic and are in agreement with the raingauge and radar observations. The rainfall volumes predicted, on average, 24 hours ahead and integrated over 2448 hours do not show, in the models ensemble, systematic biases, although inter-model variability of up to 100% can sometimes be observed; for shorter time scales of interest for some hydrological applications, the timing of the simulations was not completely successful and showed quite a high sensitivity to the resolution and, of less relevance, to the initial and boundary condition used and to the parameterisation of physical processes;
l sensitivity analyses experiments and the application of wavelet-based downscaling schemes which preserve the water mass, showed that the hydrological response is affected, up to 510% on average, by the meteorological resolution only at scales smaller than the resolution of the mesoscale models: increasing the spatial resolution of the models does not necessarily improve significantly the forecasts in basins larger than the mesh size.
3 Concerning, more specifically, hydrological and surface modelling, the conclusions are:
l reservoirs can influence the flood volumes and flood peaks up to 10% approximately, in the larger catchments of the Ticino-Toce basin at least, depending on the season and the regulation rules adopted. Dam regulations can benefit from the use of flood warning systems but significant economic losses could be produced if weather forecasts are wrong;
l both in terms of the scale of representation and the degree of conceptualisation, there are no dramatic differences between models. Different models forced by the same input can lead to differences in peaks and volumes of about 30%, on average. Increasing the degree of detail, the specific knowledge of the catchment characteristics and the extended use of the physiographic data collected, results generally in a
slightly more accurate simulation of the hydrological response of the basins during floods;
l the intercomparison of high resolution hydrological surface schemes based on detailed surface descriptions and the surface fluxes of heat and moisture of mesoscale models show quite a satisfactory agreement, both in terms of the average fluxes and the spatial variability at the event scale and at the annual scale; it can be expected that the assimilation of more detailed surface data into meteorological models will improve the estimated surface fluxes.
l Soil moisture exhibited large variability, from 30% to 60% in terms of volumetric content, also in a relatively wet area and season. Evapotranspiration fluxes, measured and simulated with different techniques in sites mainly located at the valley bottoms, were about 1 mm d1 during the MAP-SOP.
In summary, it can be observed how the major source of uncertainty in the flood simulation is the meteorological model adopted, followed by its spatial resolution, because of the resulting different vertical velocity of the airflow.
Radar data confirm their importance in describing the fine spacetemporal structure of rainfall fields. In the complex mountain areas investigated, their use for hydrological purposes would benefit significantly from the use of real-time raingauge data in their calibration.
After several years of research activity, a rich data-set of hydrological, meteorological and physiographic observations and model simulations for two areas of the Alps that are affected by heavy precipitation and severe floods, is available for scientists and end-users to improve knowledge of atmospheric and hydrological processes in mountain areas.
Acknowledgments
The partners who contributed to the RAPHAEL project and to the MAP-SOP experiments are thanked for having shared their experience and knowledge. Consorzio del Ticino, Regione Piemonte, the former Italian Hydrographic Service, ENEL, Map Data Center, Meteo Swiss, Swiss National Hydrological and Geological Survey, Deutsches Wetter Dienst and Bayerisches Landesamt fuer Wasserwirtschaft are thanked for their help in providing the data. Giovanna Grossi, together with Lucia Falappi, Fabio Gagni and Stefano Barontini, participated with enthusiasm, skill and competence in the field, laboratory and computer activities summarised here.
the web site of the Map Data Center (now at
www.map.ethz.ch). A request for the RAPHAEL-CD can be sent to the authors. The research was funded by the European Commission through contract ENV4-CT97-0552 for the RAPHAEL Project and the CNR-GNDCI grant n. 03.0009.GN42.
References
Bach, H., Braun, M., Lampart, G. and W. Mauser,W., 2003. Use of remote sensing for hydrological parameterisation of Alpine watersheds. Hydrol. Earth Syst. Sci., 7, 862876.
Bacchi, B. and Ranzi, R. (Eds.), 2000. Runoff and Atmospheric Processes for Flood Hazard Forecasting and Control. Contract ENV4-CT97-0552, Final Report, Brescia, Italy.
Bacchi, B., Ranzi, R. and Borga, M., 1996. Recognition of the statistical character of spatial patterns of rainfall cells. J. Geophys. Res.,101, 2627726286.
Bacchi, B., Grossi, G., Ranzi, R. and Buzzi, A., 2002. On the use of coupled mesoscale meteorological and hydrological models for flood forecasting in midsize mountain catchments: operational experience and verification. Proc. 2nd Int. Symp. on
Flood Defence, Beijing, China, 10-13 September 2002 Wu et al. (Eds.). Science Press, New York Ltd., Vol II, 965972. Barontini, S., Clerici, A., Ranzi, R. and Bacchi, B., 2004. Saturated
Hydraulic Conductivity and Water Retention Relationships for Alpine Mountain Soils, In: Climatology and Hydrology of Mountain Areas, C. DeJong, D. Collins and R. Ranzi, (Eds.). Wiley, Chichester, UK. in press.
Benoit, R., Kouwen, N., Yu, W., Chamberland, S. and Pellerin, P., 2003. Hydrometeorological aspects of the real-time ultrafine forecast support during the Special Observing Period of the MAP. Hydrol. Earth Syst. Sci., 7. 877889.
Beven, K.J., 1983. Introducing spatial variability into
TOPMODEL: Theory and preliminary results. Report,
Department of Environmental Sciences, University of Virginia, USA.
Bougeault, P., Binder, P., Buzzi, A., Dirks, R., Houze, R., Kuettner, J., Smith, R.B., Steinacker, R. and Volkert, H., 2001. The MAP Special Observing Period. Bull. Amer. Meteorol. Soc., 82, 433 462.
Burlando, P., Pellicciotti, F. and Strasser, U., 2002. Modelling mountainous water systems between learning and speculating, looking for challenges. Nordic Hydrol., 33, 4774.
Buzzi, A. and Speranza, A., 1986. A theory of deep cyclogenesis in the lee of the Alps. Part II: Effect of finite topographic slope and height. J. Atmos. Sci., 43, 28262837.
Clerici, A. and Cantoni. A., 2000. Misure in situ ed in laboratorio della velocità di infiltrazione e della permeabilità dei terreni superficiali nel bacino del fiume Toce. Tech.Rept., Department of Civil Engineering, University of Brescia, Italy.
Deidda, R., 2000. Rainfall downscaling in a space-time multifractal framework. Water Resour. Res., 36., 17791784.
Eidg. Forschungsanstalt für Landwirtschaftlichen Pflanzenbau, 1980. Bodeneignungskarte der Schweiz, Eidg. Drucksachen-und Materialienzentrale, Bern, Switzerland.
Falappi, L., Barontini, S., Clerici, A., Grossi, G., Savoldi, E. and Ranzi, R., 2001. Field and laboratory soil measurements in the Toce Valley (Italy) during the MAP-SOP 1999 TOCEX experiment. In: Hydrological aspects in the Mesoscale Alpine
Programme-SOP experiment, R. Ranzi and B. Bacchi (Eds.),
TR Dept. Civil Engineering Univ. of Brescia, Italy. Vol. 2000, 10.III, 61pp.
Fiorucci, P., La Barbera, P., Lanza, L.G. and Minciardi, R., 2001. A geostatistical approach to multisensor rain field reconstruction and downscaling. Hydrol. Earth Syst. Sci., 5, 201213. Frei, C. and Schaer, C., 1998. A precipitation climatology of the
Alps from high resolution raingauge observations. Int. J. Climatol., 18, 873900.
Gabella, M., Joss, J. and Perona, P., 2000. Optimizing quantitative precipitation estimates using a non-coherent and coherent radar operating on the same area. J. Geophys. Res. Atmos., 105, 2237 2245.
Grossi, G. and Falappi, L., 2003. Comparison of energy fluxes at the land surface-atmosphere surface in an Alpine valley as simulated with different models. Hydrol. Earth Syst. Sci.7, 920 936.
Hagen, M. and Yuter, S.E., 2003. Relationship between radar reflectivity, liquid water content and rainfall rate during the MAP-SOP. Quart. J. Royal Meteorol. Soc., 129 Part B, 477 494.
Jasper, K., Gurtz, J. and Lang, H., 2002. Advanced flood forecasting in Alpine watersheds by coupling meteorological observations and forecasts with a distributed hydrological model. J. Hydrol., 267, 4052.
Kaufmann, P., Schubiger, F. and Binder, P., 2003. Precipitation forecasting by a mesoscale numerical weather prediction (NWP) model: eight years of experience. Hydrol. Earth Syst. Sci.,7, 812832.
Kouwen, N. and Innes, J., 2001. Coupled MC2-Watflood flood forecasting. In: Hydrological aspects in the Mesoscale Alpine Programme-SOP experiment, R. Ranzi and B. Bacchi (Eds.), TR Dept. Civil Engineering, Univ. of Brescia, Italy. Vol. 2000, 10.IX, 15pp.
Kouwen, N., Soulis, E.D., Pietroniro, A., Donald, J. and Harrinton, R.A., 1993. Grouping response unit for distributed hydrologic modelling. ASCE J. Water Res. Manage. Planning, 119, 289 305.
Kumar, P. and Foufoula-Georgiou, E., 1993. A multicomponent decomposition of spatial rainfall fields. 1. Segregation of large-and small-scale features using wavelet transforms. Water Resour. Res., 29, 25152532.
Lanza, L.G., Ramirez, J.A. and Todini, E., 2001. Stochastic rainfall interpolation and downscaling. Hydrol. Earth Syst. Sci., 5, 139 143.
Ludwig, R., Taschner, S. and Mauser,W., 2003. Modelling floods in the Ammer catchment: limitations and challenges with a coupled meteo-hydrological model approach. Hydrol. Earth System Sci.,7, 833847.
Macelloni, M., Paloscia, S., Pampaloni, P., Santi, E. and Tedesco, M., 2003. Microwave radiometric measurements of soil moisture in Italy, Hydrol. Earth System Sci.,7, 937948.
Mackay, N.G., Chandler, R.E., Onof, C. and Wheater, H.S., 2001. Disaggregation of spatial rainfall fields for hydrological modelling. Hydrol. Earth Syst. Sci., 5, 165173.
Marazzi, A., Gamba, P. and Ranzi, R., 1996. Rain pattern detection by means of packet wavelets. Proc. 1996 IEEE Int. Geosci. Remote Sensing Symp., Vol. IV, IEEE, Lincoln, Nebraska, USA, 20712073.
Medina, S. and Houze, R.A., 2003. Air motions and precipitation growth in Alpine storms. Quart. J.Royal Meteorol. Soc., 129
Part B, 345371.
Menziani, M., Pugnaghi, S., Vincenzi, S. and Santangelo, R., 2004. Soil moisture monitoring in the Toce Valley (Italy), Hydrol. Earth System Sci.,7, 890902.
Montaldo, N., Toninelli, V., Albertson, J.D., Mancini, M. and Troch, P.A., 2003. The effect of background hydro-meteorological conditions on the sensitivity of evapotranspiration to model parameters, Hydrol. Earth System Sci.,7, 848861.
Perica, S. and Foufoula-Georgiou, E., 1996. Linkage of scaling and thermodynamic parameters of rainfall: Results from mid-latitude mesoscale convective systems. J. Geophys. Res., 101, 74317448.
Ranzi, R., 1994. The wavelet transform as a new technique for analysing spatial scales of rainfall fields. Proc. Int. Meeting Atmospheric Physics and Dynamics in the Analysis and Prognosis of Precipitation Fields, Rome, Italy. 15-18 Nov. 1994. 211214.
Ranzi, R., Bochicchio, M. and Bacchi, B., 2002. Effects on floods of recent afforestation and urbanisation in the Mella River (Italian Alps), Hydrol. Earth System Sci., 6, 239265. Ranzi, R., Bacchi, B. and Grossi, G., 2003. Runoff measurements
and hydrological modelling for the estimation of rainfall volumes in an alpine basin. Quart. J.Royal Meteorol. Soc., 129
Part B, 653672.
Reynolds, W.D. and Elrick, D.E., 1990. Ponded infiltration from a single ring: I Analysis of steady state flow. J. Soil Sci.,54, 12331241.
Richard, E., Cosma, S., Benoit, R., Binder, P., Buzzi, A. and Kaufmann, P., 2003. Intercomparison of mesoscale meteorological models for precipitation forecasting. Hydrol. Earth System Sci., 7, 799811.
Rotunno, R. and Ferretti, R., 2001. Mechanisms of intense alpine rainfall. J. Atmos. Sci., 58, 17321749.
Rotunno, R. and Ferretti, R., 2003. Mechanisms of intense alpine rainfall. Quart. J.Royal Meteorol. Soc., 129 Part B, 373390. Volkert, H., 2000. Heavy precipitation in the Alpine Region
(HERA), 2000. Areal rainfall determination for flood warnings through in-situ measurements, remote sensing and atmospheric modelling. Meteorol. Atmos. Phys., 72, 7385.