www.ann-geophys.net/25/341/2007/ © European Geosciences Union 2007
Annales
Geophysicae
The role of atmospheric boundary layer-surface interactions on the
development of coastal fronts
D. Malda1,2, J. Vil`a-Guerau de Arellano1, W. D. van den Berg2, and I. W. Zuurendonk2
1Wageningen University, Meteorology and Air Quality Section, P.O. Box 47, 6700 AA Wageningen, The Netherlands 2Meteo Consult B.V., Agro Business Park 99–101, 6700 AP Wageningen, The Netherlands
Received: 28 June 2006 – Revised: 9 January 2007 – Accepted: 30 January 2007 – Published: 8 March 2007
Abstract.Frictional convergence and thermal difference be-tween land and sea surface are the two surface conditions that govern the intensity and evolution of a coastal front. By means of the mesoscale model MM5, we investigate the influence of these two processes on wind patterns, temper-ature and precipitation amounts, associated with a coastal front, observed on the west coast of The Netherlands in the night between 12 and 13 August 2004. The mesoscale model MM5 is further compared with available observations and the results of two operational models (ECMWF and HIRLAM). HIRLAM is not capable to reproduce the coastal front, whereas ECMWF and MM5 both calculate precipita-tion for the coastal region. The precipitaprecipita-tion pattern, cal-culated by MM5, agrees satisfactorily with the accumulated radar image. The failure of HIRLAM is mainly due to a dif-ferent stream pattern at the surface and consequently, a differ-ent behaviour of the frictional convergence at the coastline.
The sensitivity analysis of frictional convergence is carried out with the MM5 model, by varying land surface rough-ness length (z0). For the sensitivity analysis of thermal dif-ference between sea and land surface, we changed the sea surface temperature (SST). Increasing surface roughness im-plies stronger convergence near the surface and consequently stronger upward motions and intensification of the develop-ment of the coastal front. Setting land surface roughness equal to the sea surface roughness means an elimination of frictional convergence and results in a diminishing coastal front structure of the precipitation pattern. The simulation with a high SST produces much precipitation above the sea, but less precipitation in the coastal area above land. A small increment of the SST results in larger precipitation amounts above the sea; above land increments are calculated for areas near the coast. A decrease of the SST shifts the precipitation maxima inland, although the precipitation amounts diminish.
Correspondence to:J. Vil`a-Guerau de Arellano ([email protected])
In the situation under study, frictional convergence is the key process that enhances the coastal front intensity. A thermal difference between land and sea equal to zero still yields the development of the coastal front. A lower SST than land sur-face temperature generates a reversed coastal front.
This study emphasizes the importance of accurate pre-scription of surface conditions as input of the numerical weather prediction model to improve coastal front pre-dictability.
Keywords. Meteorology and atmospheric dynamics (Con-vective processes; Mesoscale meteorology; Precipitation)
1 Introduction
Coastal fronts can give large amounts of precipitation in the vicinity of coastlines and are usually associated to the pres-ence of a land breeze circulation in late summer and fall, especially during the night. Because of interaction of spa-tial and temporal scales, coastal fronts are very difficult to forecast with operational numerical weather prediction mod-els. Therefore high resolution models are needed, in order to reproduce accurately all relevant processes. Coastal fronts occur on a time scale of 12 h and their characteristic length scale is around 100 km (Bosart et al., 1972). Low resolu-tion models very often do not detect these mesoscale systems or underestimate their development. The coastal front phe-nomenon is largely dependent on boundary layer physics and atmosphere-land interactions.
(a)
(b)
Fig. 1. Sketch of the physical processes responsible of the forma-tion of coastal fronts:(a)thermal difference and(b)frictional con-vergence.
of coastal fronts on precipitation amounts in coastal regions is very large, only limited attention has been paid to deter-mine its driving mechanisms.
The opposite phenomenon, the sea breeze circulation that is driven by an inverse thermal difference between the sea and land surface, has been largely studied. Closely related to the objectives of our study, Telisman Prtenjak and Grisogono (2002) investigated the influence of land surface roughness length on the strength of the sea breeze circulation. They found that very rough surfaces weaken the sea breeze circu-lation during the day, causing a slower inland penetration. In turn, the enhanced turbulent fluxes generate onset of the sea breeze circulation earlier.
Previous studies have shown that thermal difference is re-quired for the development of coastal fronts. Bosart (1975) found with individual and climatological case studies that without a thermal difference between sea and land, coastal frontogenesis cannot be triggered. Ballentine (1980) per-formed a study of coastal frontogenesis by means of a numer-ical three-dimensional, primitive equation boundary layer model. He stated that thermal difference is necessary for the development of coastal fronts, although frictional difference contributes to the development.
However, Roeloffzen et al. (1986) demonstrated with a three-dimensional numerical model that thermal difference between sea and land is not strictly necessary for triggering coastal frontogenesis. Differential friction between sea and land, causing convergence at the coastline, can be sufficient for the development of a coastal front. They also found that the influence of differential friction strongly depends on the angle between wind direction and coastline. Zhong and Takle (1992) recognized frontogenesis in a case without any differ-ence between sea surface temperature and land surface tem-perature. The development was triggered by frictional forces, Coriolis force, advection and large and mesoscale pressure gradient forces.
The aim of this study is to analyze the relationship between the driving mechanisms and their feedbacks to quantify and qualify the role of different parameters in the development of coastal fronts. More specifically, to analyze the influ-ence of surface conditions and boundary layer development in such mesoscale systems. By doing sensitivity analyses, the influences of surface roughness, sea surface temperature and land-surface of England on the development of a coastal front are investigated. This is done by means of simulations with the Pennsylvania State University – National Center for Atmospheric Research non-hydrostatic fifth-generation Mesoscale Model (MM5; Dudhia, 1993; Grell et al., 1995) for the case of a coastal front in the night from 12 to 13 Au-gust 2004 on the west coast of The Netherlands. MM5 is a state-of-the-art model, which takes into account feedbacks between different physical processes.
Furthermore, we evaluate the performance of two opera-tional models (ECMWF and HIRLAM) to determine the ca-pabilities of these models in reproducing coastal fronts.
Fig. 2. The sea level pressure (hPa) and wind vectors at 640 hPa with drawn fronts, during the coastal front situation on 13 August 2004 at 03:00 UTC.
2 The meteorological situation
This research is based on a case study of a coastal front in The Netherlands. Below, the details of the coastal front evo-lution and the meteorological situation are described.
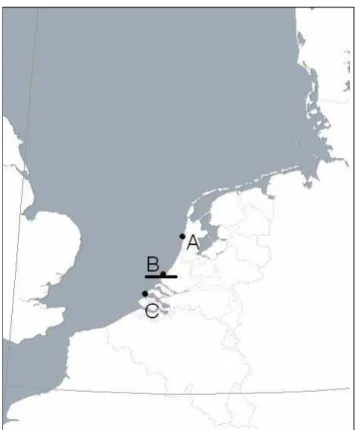
Along the west coast of The Netherlands, a coastal front with severe showers developed in the evening of 12 August 2004. Figure 2 shows the synoptic scale flow, where the dark line segments highlight the coastal location being studied. The development of the front started between 21:00 UTC on 12 August and 00:00 UTC on 13 August. The high-est intensity of the front was reached between 06:00 UTC and 09:00 UTC on 13 August. Afterwards, the front pen-etrated inland and disappeared. Before the start of the in-land penetration around 10:00 UTC, the front had been quasi-stationary since 02:00 UTC. Near point A (Fig. 3), the front penetrated about 25 km inland and became quasi-stationary near the coast of Lake IJssel, east of point A. The southerly part of the front, near point C, was quasi-stationary off shore and in the area of point B the front stagnated few kilometers inland.
The local meteorological conditions showed a large spa-tial variability. The precipitation amounts as a result of the coastal front varied from 2 mm at locations where the front passed by with a relatively high speed, to almost 50 mm in 12 h at places where the front became quasi-stationary. The accumulated radar image (Fig. 4, De Rooy et al., 2004) shows the quasi-stationary location of the coastal front.
Frictional difference between sea and land surface con-tributed largely to development of the coastal front. Just be-fore the development of the coastal front, the off shore winds
F3
Fig. 3.Map of domain 1 and the inner domain. Domain 1 covers the area between Scotland (northwest part of the map), southern Swe-den (northeast part of the map) and northern France (southern part of the map). The inner domain covers The Netherlands, Belgium, Luxemburg, a large part of the North Sea and small part of eastern England, northern France and Germany.
were south-westerly. According to Roeloffzen et al. (1986) and Van den Berg (1987) this is the direction with the high-est frictional enhanced convergence, because of the small angle (20–40◦) with the coastline. In advance of the pas-sage of the coastal front, winds at coastal stations typically were from directions between south and southwest, a result of the frictional difference. Backing onshore winds over land are mainly due to a decreased Coriolis-effect, as a result of higher friction force over land than over sea (Roeloffzen et al., 1986). After passage of the front, the wind at those sta-tions eventually veered to the west. Just offshore, the wind speed in advance of the front passage was typically between 8 and 10 m/s; just onshore, the wind speed was around 6 m/s. After passage of the front, wind speed typically increased with 2 m/s.
Fig. 4.Radar image of The Netherlands, accumulated precipitation (mm) over the time period between 12 August 2004 08:00 UTC and 13 August 2004 08:00 UTC.
long-term thermal difference between sea and land over the whole period was only 3◦C. The weak decrease of temper-ature at coastal stations is due to cloudiness and remaining onshore winds.
The coastal front in the described situation is, according to classification of Van den Berg (1987), a type 2 coastal front. This type – the south-west type – is “frictionally enhanced” and contains winds over sea between 10–18 m/s, “almost par-allel to the coastline”. It can generate “30 mm or more of precipitation and prolonged thunderstorms along the coast”.
At larger scales, the synoptic situation also contributed to the formation and evolution of the coastal front. The situ-ation of 12 and 13 August 2004 over The Netherlands was very complex. In the upper air (500 hPa), a trough was sit-uated with the centre above the Irish Sea (not shown). The atmospheric sounding from De Bilt, The Netherlands of 13 August 00:00 UTC (Fig. 5) shows that between 500 and 300 hPa wind was backing with height from 215 to 90 de-grees. At the surface a low pressure area was situated with three centres: above Ireland, England and eastern Germany (Fig. 2). At 12 August an occluded front, connected to the low pressure area, passed The Netherlands from the south to the north and became stationary north of the Wadden Islands around 21:00 UTC. This was caused by a flow pattern be-tween 500 and 700 hPa that was almost parallel to the frontal zone. The activity of the front increased while moving to the north, because of the high surface temperatures at the warm side of the front (around 26◦C) in the north and east of the country. In some regions almost 100 mm of precipitation was measured, as a result of the passage of the occluded front.
F5
Fig. 5.Skew-T diagram, related to the atmospheric sounding from De Bilt, The Netherlands of 13 August 2004 00:00 UTC. The figure is provided by the University of Wyoming.
The winds behind that occluded front veered to south-west. In the unstable air behind the occluded front many showers arose. In combination with the south-westerly winds and the temperature difference between the sea surface and the land surface, these conditions favour the full development of the coastal front phenomenon.
3 Methodology
3.1 Operational models
In this section we provide a brief description of the models ECMWF and HIRLAM. Results of these operational mod-els are used to analyze their capability to resolve the coastal front situation. The large scale numerical weather predic-tion model from ECMWF (European Center for Medium-range Weather Forecast) is compared with the High Reso-lution Limited Area Model (HIRLAM; Sass et al., 1999), and the Penn State-NCAR fifth generation non-hydrostatic Mesoscale Model (MM5; Dudhia, 1993; Grell et al., 1995). A short description of the ECMWF model and HIRLAM is given below. In Sect. 3.2, we describe more elaborately the setup of the numerical experiment done with MM5.
(∼22 km). HIRLAM is a hydrostatic model. The model runs every 6 h starting from the analysis of ECMWF from 6 h ear-lier. For example, the ECMWF-run of 00:00 UTC uses the analysis of 00:00 UTC; the HIRLAM-run of 00:00 UTC uses the ECMWF-analysis of 18:00 UTC from the day before.
The analyzed 36-h simulation of the operational numer-ical weather prediction model ECMWF is from 12 August 00:00 UTC. The discussed HIRLAM-run starts the same time, but uses the initial ECMWF analysis data from 6 h ear-lier.
3.2 Research model and selected parameterizations The mesoscale model MM5 is used to study the coastal front situation and its driving mechanisms. MM5 uses the same initial data and begins the simulation at the same time as ECMWF, and as boundary conditions it uses ECMWF data every 6 h.
For the simulation of the coastal front with MM5, two domains are defined. The coarse domain contains 52×52 grid points with a grid spacing of 27 km. The inner domain (Fig. 3) consists of 70×91 grid points in x, y with a grid spacing of 9 km. The central point of the coarse domain is 52.3◦N; 4.78◦E, near Amsterdam, capital of The Nether-lands. The lower left point of the second domain is coor-dinate (15,15) of the coarse domain. A one-way interactive nest is used between the coarse domain and the inner domain. In the vertical, 27 half σ-levels are defined (σ=(p–
ptop)/(psfc–ptop)), wherepis the actual pressure, psfc is the pressure at the surface and ptopis the pressure at the top of the model (100 hPa). Higher vertical resolution is defined in the PBL, in order to describe more adequately the interaction between the PBL and the surface. The five lowest model lev-els are approximately at 0, 80, 160, 240 and 300 m above the model terrain.
Two different configurations of the MM5 model are used. The combined options of MM5 parameterization schemes are based on comparisons between observations and MM5-model output. The first configuration is the Kain-Fritsch (KF) convection scheme (Kain and Fritsch, 1993; Kain, 2004) with the Blackadar boundary layer scheme (Black-adar, 1976, 1979; Zhang and Anthes, 1982; Oncley and Dudhia, 1995). The second configuration is the KF con-vective scheme coupled with the Burk-Thompson bound-ary layer scheme (Burk and Thompson, 1989). By doing so, one can compare a scheme that calculates the flux as a function of the exchange coefficients and the adjacent lev-els (BT is a local scheme) with one that allows mixing be-tween non-neighbouring layers (non-local). Based on com-parisons with observations, these combinations are expected to give the best prediction of precipitation amounts and its spatial distribution during coastal front events. Another con-vection scheme is the scheme of Grell (Grell, 1993; Grell et al., 1995). However, the KF scheme uses a more detailed cloud mixing scheme than the scheme of Grell. In
partic-ular, the KF parameterization has the possibility to include variations of the vertical velocity field that can be induced by surface frictional convergence.
In short, the important aspect included on the KF param-eterization is the inclusion of a “triggering function” depen-dent on a mean vertical velocity, resolved explicitly by MM5. This function is satisfied if TLCL+dT>Tenv, where TLCL is the parcel temperature at the lifting condensation level, Tenv is the environmental temperature and dT is the perturbation of the temperature added to the parcel. The formulation of dT includes a vertical velocity that is grid-resolved by MM5 and therefore is able to account for modifications of the surface conditions.
An important difference between the boundary layer schemes of Burk-Thompson (BT) and Blackadar is the cal-culation of the drag coefficients for heat and moisture (Cθ andCq). These parameters are included in the calculation of the surface heat flux and the latent heat flux, which reads:
Hs =ρacpCθVa(θg−θa) (1)
Es =ρaLvMCqVa[qvs(Tg)−qva] (2) whereρa,cp,Va,Lv,Mandqvaare the air density, specific heat, wind speed, latent heat of vaporization, moisture avail-ability at the surface and vapour mixing ratio at the lowest half-σ level. qvs is the saturation water vapour mixing ratio at the surface, as a function of the surface temperature (Tg).
θgandθaare the potential temperature at the surface and the lowest half-σlevel.
The calculations of the exchange coefficients for heat and moisture by the Blackadar scheme use Cθ6=Cq. The BT scheme surface flux calculations are based on Louis (1979) and Louis et al. (1981), withCθ=Cq.
Not only the surface flux calculations by the Blackadar scheme are different from BT, also the turbulent mixing at higher levels is defined in a different way. Like the surface fluxes, here also the difference is another way of calculating the exchange of heat and moisture.
(a)
(b)
Fig. 6. Accumulated precipitation amounts (mm), calculated by the Kain-Fritsch-Blackadar combination(a)and the Kain-Fritsch-Burk-Thompson combination(b), over the time period between 12 August 2004 12:00 UTC and 13 August 2004 12:00 UTC.
The difference between the PBL schemes of Blackadar and BT in the calculation of surface fluxes and turbulent mixing is a plausible explanation for the differences in the predicted precipitation amounts and its distribution in the coastal front case. These results agree very well with Wisse and Vil`a-Guerau de Arellano’s (2004) findings. They com-pared the precipitation prediction of boundary layer
param-eterization schemes for a severe convective storm in Spain. Among other schemes, they compared Blackadar and ETA (Janjic, 1994). ETA scheme, similar to BT scheme, uses a TKE-1 scheme to calculate the exchange coefficients for heat and moisture. They found for the Blackadar scheme more widespread precipitation and lower maximum amounts than the ETA scheme.
3.3 Numerical experiments for sensitivity analyses The last part of the study focuses on sensitivity analyses of roughness length and sea surface temperature to the devel-opment of the coastal front. In the control simulation the average land surface roughness length is 15 cm; the rough-ness length of the sea is set to a constant level of 0.01 cm. Lange et al. (2004) found that even for modelling wind re-source assessment over sea, an assumption of constant sea surface roughness was accurate enough. In order to study the effects of frictional convergence, we set up five simula-tions. In the first alternative simulation (simulation 3; Ta-ble 1), land surface roughness of domain 2 is made homo-geneous to 100 cm. The next simulations (4 and 5) contain a land surface roughness length of respectively 0.1 cm and 0.01 cm; (almost) equal to the sea surface roughness. Also, two simulations (6 and 7) are carried out with an increased roughness length only at the coastline. The first simulation (6) prescribes a very narrow coastline with a width of only one grid box (∼9 km); the second (7) a somewhat broader coastline, consisting of two grid boxes (∼18 km). The rest of the land surface was kept with its original roughness length.
In simulations 8, 9, 10 and 11 sensitivity of coastal fronts to the thermal difference is tested by varying and increasing the SST from−5 to 5 degrees. In order to study simultane-ously the effects of both frictional convergence and thermal difference on the development of the coastal front, a simu-lation (12) with the land surface roughness equal to the sea surface roughness and with the SST 2 degrees lower is per-formed.
Finally, the last simulations (13 and 14) are performed to investigate the role of the British Channel in the formation of the coastal front. In order to eliminate the British Channel, the land surface of England is changed into water body in simulation 13. In simulation 14, also the SST has been de-creased with 2 degrees and the roughness length is set equal to the sea surface roughness (0.01 cm).
4 Coastal front modelling: model comparison
Table 1.Summary of the numerical experiments, carried out in order to determine the best combination of parameterizations (simulation 1 and 2), the comparison with operational models (simulation 2) and the sensitivity analyses on land and sea surface conditions on coastal front development.
Simulation Convection PBL Roughness length Sea surface Other changes
scheme* scheme** land surface temperature
1 KF BL original original
2 KF BT original original
3 KF BT 100 cm original
4 KF BT 0.1 cm original
5 KF BT 0.01 cm original
6 KF BT coast line (1 grid line of∼9 km) 100 cm original
7 KF BT coast line (2 grid lines of∼9 km) 100 original
8 KF BT original +2◦
9 KF BT original +5◦
10 KF BT original −2◦
11 KF BT original −5◦
12 KF BT 0.01 cm −2◦
13 KF BT original original England changed into water
14 KF BT 0.01 cm −2◦ England changed into water
* KF = Kain-Fritsch ** BL = Blackadar; BT = Burk-Thompson
calculated by ECMWF, HIRLAM and MM5, respectively. In order to compare the observed spatial patterns, Fig. 4 shows the precipitation radar image accumulated over the time period between 12 August 08:00 UTC and 13 August 08:00 UTC. We focus first on precipitation, related to the large scale front, and afterwards on the mesoscale coastal front, which was affected by the large scale front. Details of the large scale frontal passage were described in Sect. 2.
4.1 Synoptic scales
The ECMWF model simulates the large scale frontal pre-cipitation in the northern part of The Netherlands very well. Both the spatial distribution of the precipitation and the pre-cipitation maxima are well estimated compared to the ac-cumulated 24-h radar image. Although the radar image is not from the same time period as the model values, it gives a representative idea of the spatial distribution of precipi-tation amounts. Sprecipi-tation observations show that the precip-itation in the coastal region did not exceed 0.5 mm on 12 August between 06:00 and 12:00 UTC. On 13 August, be-tween 06:00 and 12:00 UTC, precipitation amounts of 10 mm were observed in the northern part of The Netherlands, lated to the large scale front. According to the weather re-ports, the largest part of that precipitation amount fell in the first hours of that period, so an underestimation by the radar image of the total precipitation amount is about 5 mm at maximum. According to the radar image, the maxima were around 90 mm in 24 h in the north-western part of The Netherlands, whereas ECMWF calculates maxima of more than 75 mm for the same region.
HIRLAM also reproduces the large scale frontal precip-itation very accurately (Fig. 7b). The model results show very high and also realistic precipitation values; the loca-tion of the maximum is also very well calculated. The maximum produced precipitation amounts by HIRLAM are around 115 mm. The spatial pattern of the precipitation, re-lated to the large scale front, agrees very well with the accu-mulated radar image.
The mesoscale model MM5 underestimates the precip-itation amounts (Fig. 7c), related to the large scale front. The calculated maximum precipitation amount, related to the large scale front, is only around 55 mm. According to MM5, the precipitation maxima are located in the north-eastern part of The Netherlands instead of the north-western part, as showed by the radar image, by ECMWF and by HIRLAM calculations.
4.2 Mesoscales
(a) (b)
(c)
Fig. 7. Accumulated precipitation amounts (mm), calculated by the operational numerical weather prediction models ECMWF(a)and HIRLAM(b)and the non-hydrostatic mesoscale model MM5(c), over the time period between 12 August 2004 12:00 UTC and 13 August 2004 12:00 UTC.
of precipitation, according to MM5, is also different from distribution showed by the radar image. The radar im-age shows that the northerly part of the front has moved around 30 km inland. The MM5 model output shows also the northerly part above the coastal region.
Despite the differences between the MM5 output and the radar images in activity of the coastal front and spatial distri-bution of the precipitation, the coastal front is well simulated by MM5. Therefore, we are confident that MM5 is an ad-equate tool to investigate how surface parameters can affect the development of this mesoscale phenomenon.
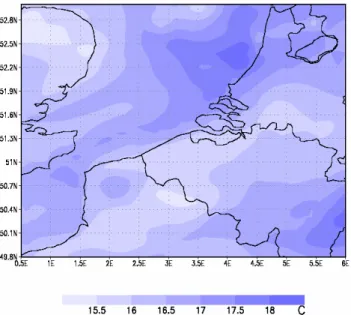
Fig. 8.Potential temperature (◦C) above the southern North Sea at 40 m on 13 August 2004 03:00 UTC, as calculated by MM5.
4.3 Analysis of scale interactions
According to our analysis, whereas HIRLAM reproduces the large scale front, it is unable to model the coastal front, due to incorrect timing of the large scale frontal passage. HIRLAM reproduces a slower motion of the large scale frontal system to the north with respect to ECMWF and MM5. Also the quasi-stationary location of the front is re-produced more southerly by HIRLAM. This cannot be con-cluded from the accumulated precipitation image, but from the wind pattern (not shown). The southerly location of the front results, among other things, in a westerly to north-westerly wind pattern over the North Sea (not shown), in contrast with the south-westerly surface flows, reproduced by ECMWF and MM5. The south-westerly winds in ECMWF and MM5 cause a long flow pattern of air parcels over water (the British Channel). The temperatures, according to MM5, above southern England and north-western France at half-σ
level 0.995 (80 m above surface level) both are lower than the temperatures on the same level above the British Channel (Fig. 8). The combination of the south-westerly flows and the relatively high temperatures above the British Channel results in upward motions over an outstretched area along the French, Belgian and Dutch coast (not shown). These condi-tions, together with the atmospheric conditions (Sect. 2) have triggered the origination of the coastal front.
Two other reasons, related to the driving mechanisms of the coastal front (thermal differences and frictional conver-gence) cause HIRLAM to fail in its modelling. In the next paragraphs, these reasons are described.
Table 2.Average thermal error (◦C) over the time period between 12 August 2004 12:00 UTC and 13 August 2004 12:00 UTC for several synoptic stations. Inland stations are represented by [L], coastal stations by [C] and sea stations by [S]. Valkenburg, situated at 3 km from the coast, is counted as coastal station.
Average thermal error
Station ECMWF MM5 HIRLAM
Berkhout [L] 0.20 −0.46 1.86
Europlatform [S] 0.15 −0.57 1.05
Hoek van Holland [C] −0.04 0.08 1.87
Koksijde [C] 0.61 0.42 1.64
Lichteiland Goeree [S] −0.20 −0.58 0.94
Meetpost Noordwijk [S] −0.59 −0.96 0.98
Oostende [C] 0.32 0.11 1.51
Valkenburg [L] −0.09 −0.01 1.95
Vlissingen [C] −0.84 −0.57 1.51
Wilhelminadorp [L] −0.06 −0.77 1.24
Wijk aan Zee [C] −0.68 −0.18 1.88
Zestienhoven [L] −0.36 −0.11 1.92
Total average −0.13 −0.30 1.53
4.4 Analysis of the boundary layer-surface interaction In addition to the previous explanation, an important differ-ence between the HIRLAM results and the two other models is related to the thermal differences between sea and land, one of the driving mechanisms behind the development of coastal fronts. The temperature, calculated by HIRLAM, differs notably from the other models. HIRLAM calculates higher surface temperatures than ECMWF and MM5, above land as well as above sea. In the simulation of HIRLAM, the cold air behind the frontal zone arrives later because of the low speed of the front, which probably causes the higher temperatures in the considered time period.
Table 2 shows for all used models the average deviation of the calculated temperature, with respect to the observed temperature at several meteorological stations in the period between 12 August 12:00 UTC and 13 August 12:00 UTC. The value of a station is averaged over nine grid points in time, with a time interval of three hours. The average overes-timation of temperature by HIRLAM is more than +1.5◦C. It strikes us that the temperature at the three sea stations (Meet-post Noordwijk, Europlatform and Lichteiland Goeree) is less overestimated (∼+1◦C) than the average. This yields a smaller thermal difference between sea and land than the other two models.
(a) (b)
(c)
Fig. 9.Time evolution of the observed wind direction (◦) for a sea station (Europlatform), a coastal station (Hoek van Holland) and an inland station (Zestienhoven) together with the model values of the closest grid points to the station. Panel(a)represents the results of ECMWF,
(b)of HIRLAM and(c)of MM5.
weaker in the HIRLAM results than in the other two mod-els. This is caused by the onshore wind pattern in HIRLAM, which is perpendicular to the coast. As a result, it leads to less convergence than a wind pattern by which the angle be-tween the wind direction and the coastline counts only 20 to 30 degrees (Roeloffzen et al., 1986). Therefore, the frictional convergence, modeled by HIRLAM, contributes much less to the development of a coastal front. In order to understand better the consequences of different surface flow patterns for the development of the coastal front, observations and model output are compared and the results are described below.
During the occurrence of the coastal front, observations showed an enlarged disturbance in the wind direction be-tween different stations. The wind disturbance is defined as a relatively large change in wind direction (of about 20 or more degrees) over a small area, which interacting with the
south-westerly flow results in a convergence zone along the coast (Roeloffzen et al., 1986).
The observed wind disturbance on a line perpendicular to the coast is compared to the wind reproduction of ECMWF, HIRLAM and MM5. Figures 9a, b and c show the time evolution of the observed wind direction for three meteo-rological stations together with the reproduced wind direc-tion from the three different numerical models. Europlat-form (52.00 N; 3.28 E) is an off shore station, Hoek van Hol-land (51.98 N; 4.10 E) is a coastal station and Zestienhoven (51.95 N; 4.45 E) is an airport station, located 25 km inland. The line in Fig. 3, almost perpendicular to the coastline, is between Europlatform and Zestienhoven. The coastal station Hoek van Holland is situated at the same line.
because the station is roughly in the middle between two grid points: for HIRLAM Europlatform and Hoek van Holland and for MM5 Zestienhoven. For HIRLAM and Hoek van Holland we have taken the value of the most westerly of the two nearest grid points to the stations. For Zestienhoven we have taken the most easterly grid point. This is done in order to be able to show the wind disturbance more clearly.
The observations show that the disturbance developed be-tween 12 August 21:00 UTC and 13 August 00:00 UTC and disappeared between 13 August 09:00 and 12:00 UTC. ECMWF also shows a wind disturbance, but underestimates it. According to ECMWF, the development of the dis-turbance starts between 13 August 00:00 and 03:00 UTC. HIRLAM does not show any disturbance in the wind direc-tion. This is good evidence that HIRLAM does not repro-duce the coastal front. On the other hand MM5 is able to reproduce the disturbance much better. The timing of devel-opment and dissipation is very similar to the observations. The agreement of the observed intensity of the disturbance with the model output of MM5 varied from time to time. At some points in time (t=+27 and +30), the intensity of the disturbance is underestimated by MM5; at other times (t=+24 and +33) the intensity of the disturbance is calcu-lated very well. Maximum observed difference in wind di-rection between Europlatform and Hoek van Holland is 40 degrees and between Europlatform and Zestienhoven also 40 degrees. The maximum difference calculated by MM5 is 15 degrees between Europlatform and Hoek van Holland and 35 degrees between Europlatform and Zestienhoven.
Together with the different wind pattern and temperature, this factor has led to absence of coastal front development in the output of HIRLAM and a more correct reproduction by MM5.
5 Sensitivity analyses of land and sea surface conditions on coastal front development
To understand the evolution of coastal fronts, it is fundamen-tal to determine the dependence of coasfundamen-tal front development on the surface conditions of land and sea. In order to in-vestigate the influence of surface roughness and sea surface temperature, these parameters are varied inside the inner do-main in several simulations (Table 1). This table provides a summary of all simulations, carried out during the research. Further, a simulation is made with the land surface of Eng-land changed into water surface, in order to investigate the influence of the relatively narrow British Channel (between south-eastern England and north-western France) on the de-velopment of the coastal front in the situation of the night from 12 to 13 August 2004. The roughness length of the sea is assumed to be constant (Lange et al, 2004) at 0.01 cm.
5.1 Dependence of coastal front development on roughness length
The control simulation (simulation 2, Table 1) of the coastal front situation, which is previously used in the comparison with ECMWF and HIRLAM results, is performed with an average land surface roughness length of 15 cm. Simula-tions 3–7 are related to the sensitivity analysis on the sur-face roughness length to coastal front development. This subsection describes some results of these simulations. In the first simulation of the sensitivity analysis (simulation 3), the land surface roughness length over the whole land sur-face of the inner domain is set to 100 cm. The roughness length in simulations 4 and 5 is set to 0.1 cm and 0.01 cm (equal to the sea surface roughness length), respectively. The other surface parameters are the same. In simulation 6 and 7, the roughness length is changed only in the westerly coastal region of The Netherlands, in order to analyze the effects of less extreme changes in roughness length. The changes in precipitation amounts, spatial distribution of precipitation, wind, divergence of the wind, surface fluxes and vertical mo-tions, as a result of the changes in roughness length, are de-scribed below. Figures 10a, b, c and d show the 24-h pre-cipitation amounts (12 August 2004 12:00 UTC–13 August 2004 12:00 UTC), as calculated in simulations 2–5.
As expected, the larger roughness length causes a lower wind speed over land on the lowest model level (not shown). However, more important in the coastal front development is the change in wind direction near the coastline due to the change of land surface roughness. Figures 11a, b, and c show the wind direction near the stations Europlatform (EP), Hoek van Holland (HH) and Zestienhoven (ZH), derived in the same way as described in Sect. 4 for simulations 3–5, respec-tively. Figure 11d shows the same, but for the control simu-lation. Simulation 3 (Fig. 11a) calculates a larger wind dis-turbance (change in wind direction) between Europlatform and Zestienhoven than the control simulation, as a result of the increased land surface roughness length. The larger step in roughness between sea and land yields a larger difference in wind speed between sea and land. The large horizontal gradient in wind speed causes differential behaviour of the Coriolis force between sea and land and consequently, back-ing onshore winds over land. This effect can be explained by the conservation equation of the horizontal wind compo-nent (Ng and Spalding, 1972), with the assumption that the velocity field is independent ofy. The equation reads:
u∂u ∂x+w
∂u
∂z =f (v−vg)+ ∂ ∂z Km ∂u ∂z (3) and the equation for the calculation of divergence of the hor-izontal wind:
∇ ·V = ∂u
∂x+ ∂v
∂y (4)
(a)
F10A
F10B
(b)
F10B
(c) (d)
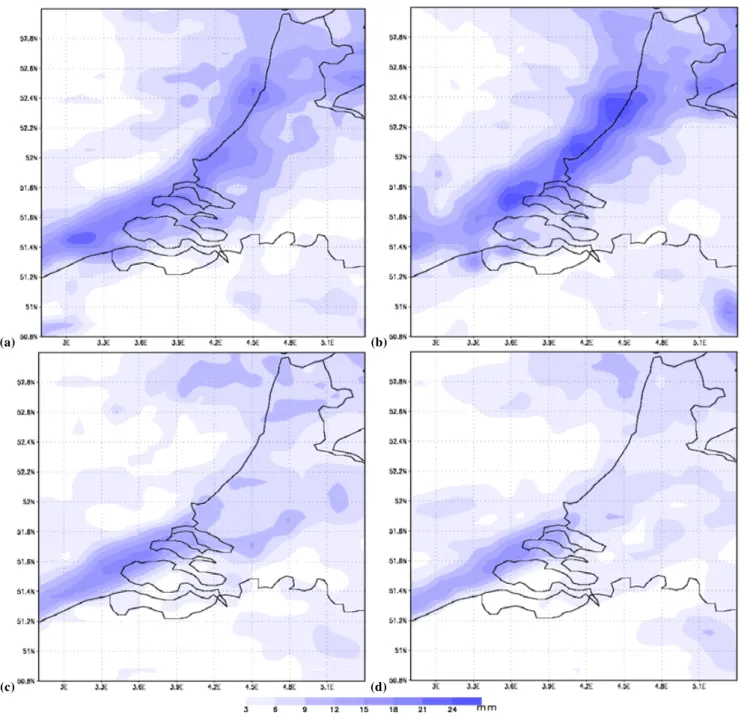
Fig. 10. Accumulated precipitation amounts (mm), produced by simulation 2(a), 3(b), 4(c)and 5(d)over the time period between 12 August 2004 12:00 UTC and 13 August 2004 12:00 UTC. Specifications of the simulations are written in Table 1.
y-direction. The Coriolis parameter is denoted byf andKm is the exchange coefficient for momentum. The first term on the right hand of the equation is the Coriolis term and corresponds to the divergence of the turbulent flux.
The explanation of the backing winds over land is as fol-lows. When the south-westerly wind reaches the land, its ve-locity decreases in thex direction as well as the y-direction. According to Eq. (3), the value of∂u∂x becomes more negative as a result of the negative Coriolis term (v<vg). The
ex-tra decrease ofuin the x-direction implies the ageostrophic backing winds over land in the southwest-northeast oriented west coast of The Netherlands. According to Eq. (4), the negative value of∂u∂x results also in convergence (negative di-vergence) of the horizontal wind.
(a)
(b)
(c)
(d)
Fig. 11. Time evolution of the calculated wind direction (◦) for a sea station (Europlatform), a coastal station (Hoek van Holland) and an inland station (Zestienhoven). Simulation 3(a), 4(b)and 5(c)are compared with the control simulation(d). Specifications of the simulations are written in Table 1.
(lowest z0)this is 50◦. For the same time, the results of the simulations with decreased roughness show a disturbance of only 15◦and 25◦, respectively (Figs. 11b and c). At t=+27 and +36, these simulations show no wind disturbance. How-ever, at t=+24, a remarkable event is noticed. The simula-tions with roughness length of 0.1 and 0.01 cm show a rela-tively large disturbance at that time. The most likely expla-nation for this unexpected disturbance is a developing front in this region, which is independent of the horizontal gra-dient of roughness. This is stated before in Sect. 4 about the long trajectories of the air parcels over relatively warm sea water of the British Channel, before reaching the Dutch coast. However, after t=+27 the wind disturbance disappears
in these simulations, because there is no frictional conver-gence to enhance or continue the frontal development.
(a)
F12A
F12B
(b)
F12B
(c)
F12C
Fig. 12.Vertical wind speed (cm/s) atσ=0.9, derived from simulations 2(a), 3(b)and 5(c). Specifications of the simulations are written in Table 1.
In simulation 5 (Fig. 12c), decreased land surface roughness length results in strongly decreased upward motions near the coastline. These results confirm the hypothesis that the com-bination of frictional difference between sea and land with the condition of an onshore flow, almost parallel to the coast-line, enhances convergence and consequently upward mo-tions, which can trigger or intensify the formation of clouds and precipitation. It is important to notice that the selected parameterization of deep convection (KF) is sensitive to this induced vertical motions by roughness length variations, as explained in Sect. 3.3.
As a result of stronger convergence at the surface level, together with higher surface fluxes (see above), the 24-h ac-cumulated precipitation amounts in the coastal region are larger in simulation 3 (Fig. 10b) with respect to simula-tion 2 (Fig. 10a). The maximum amounts are increased by 4 mm, from 21 to 25 mm. Not only the maximum precipita-tion amounts are higher; also in a large coastal area between point A and C (Fig. 3) an average increase of precipitation amounts is found. We can conclude that the overall effect of an increasing roughness length at the land surface generates larger precipitation amounts in the coastal area. However, southwest of point C, a relatively small area with decreased precipitation amounts is situated. Further, the precipitation amounts 40–50 km inland decrease in simulation 3; the band of maximum precipitation amounts is shifted roughly 15 km westward. This is a result of a stronger friction force at the surface, which slacks and eventually obstructs further inland motion of the front. Simulations 6 and 7 also cal-culate lower precipitation amounts inland (not shown), but no increase near the coastline, with respect to the control simulation. However, the maximum precipitation amounts tend to be concentrated in the coastal region between point B and C (Fig. 3). This means that even a small line of higher roughness length at the coast can diminish the penetration of a coastal front.
The simulation with a land surface roughness length of 0.1 cm (simulation 4, Fig. 10c) calculates for the northerly part of the west-coastal region between point A and C much less precipitation than the control run. Near point A, pre-cipitation amounts decrease by almost 14 mm; from 21 to 7 mm. In the area of point C, the precipitation amounts de-crease less than in the other regions. With the south-westerly flow, the precipitation area is driven more inland than in sim-ulation 2, although the intensity of the precipitation area de-creased while moving inland.
The accumulated precipitation amounts in the simulation with the land surface roughness equal to the sea (simula-tion 5, Fig. 10c) are even lower than in simula(simula-tion 4. The structure of the rain band is split up. Only in the area of point C (Fig. 3) precipitation maxima are still found.
It can be concluded that an increase in land surface rough-ness length results in a larger convergence at the coastal line, while opposite is true for the decreased value of the land sur-face roughness. The increased convergence leads to stronger upward motions and higher precipitation maxima near the coastline. The increased land surface roughness length also causes a decreased inland penetration of the coastal front. A decreased land surface roughness length to (almost) equal to the sea surface roughness length results in lower precipita-tion maxima, foremost in the northern part of the Dutch west coast.
5.2 Dependence of coastal front development on thermal difference between sea and land
The other surface condition that plays a role in the devel-opment of a coastal front is thermal difference. The ob-served surface thermal difference between sea and land in the coastal area of Hoek van Holland in the night between 12 and 13 August 2004 is about 2 degrees. Simulations 10 and 12 are based on this observation. To study its dependence, we vary the sea surface temperature (SST) by increasing and decreasing 2 and 5 degrees, with respect to the observed and prescribed SST of +18◦C. The reduction of SST with 2 de-grees in simulation 8 eliminates the thermal difference be-tween sea and land. In simulation 12, both thermal difference and frictional differences are eliminated, in order to analyze the combined effects of frictional convergence and thermal difference. In order to extend the analysis of the effects of thermal differences between sea and land on the development of a coastal front, the simulations 8, 9 and 11 (Table 1) are carried out.
A modificated SST implies enormous changes in surface fluxes above sea, foremost the latent heat flux. Simulation 8 and 9, containing a higher SST, both calculate higher latent and sensible heat fluxes (not shown). The surface fluxes do not increase above land, except for a slight increase in the coastal region. The combination of large increments in surface fluxes above sea and (almost) no variation in fluxes above land results in a large horizontal surface flux gradient in the coastal region. Near point C (Fig. 3), a gradient of
±25 W/m2per kilometer is calculated, whereas the gradient in the control simulation for the same place is only±1 W/m2 per kilometer. The increment of surface fluxes above sea re-sults in intensification and concentration of upward motions above sea (not shown), accompanied by concentration of in-tensive precipitation activity above sea.
The lowering of the SST in simulation 10 and 11 results in decreased surface fluxes above sea. Above land, no changes in surface fluxes are calculated in these simulations. Lower surface fluxes above sea are the most important cause of the weakening of the coastal front in these simulations. The higher precipitation amounts above land in these simulations are the result of a more homogeneous distribution of surface fluxes, by which the concentration of upward motions in the coastal region disappears and the area of precipitation max-ima spreads over land.
along the coast, like the control simulation. However, sim-ulation 9 produces a large area above sea with precipitation maxima and not a clear line anymore. Besides the increase of precipitation maxima, the area of the maxima shifts west-ward in both simulations with increased SST. The conse-quence of this shift is that the precipitation amounts over land do not increase, except at the peninsula near 52◦N and 4◦E. Above inland regions, the calculated precipitation amounts even decrease.
In simulation 10 (Fig. 13c), in which the original SST is decreased by 2◦C, decreased precipitation amounts with re-spect to the control simulation are calculated for the coastal region. However, at the Belgian coast more precipitation is calculated than in the control simulation. As well in the Bel-gian as in the Dutch coastal region, the band with maxima is shifted inland, as a result of the decreased SST. For the Belgian coastal region, this means that the band with max-ima moves from the sea to the coast; for The Netherlands it means that the band moves from the coast to further in-land. Despite the inland movement of the precipitation max-ima, the precipitation amounts do not increase in the inland region of The Netherlands, the maximum amounts stay al-most equal (12–15 mm). This means that the intensity of the coastal front has been slightly decreased as a result of the decreased SST.
Simulation 11 (SST-5◦C) in fact represents a reversed coastal front, because the SST is lower than the land surface, like in spring and early summer. That is why the precipita-tion amounts are almost equal to the result of simulaprecipita-tion 10 (SST-2◦C). Only in the coastal region near point C (Fig. 3) is a noticeable change, where the precipitation amounts reduce to almost zero. This is because the inland water mass in that region also contains a decreased temperature. Furthermore, the precipitation maxima do not move further inland, with respect to simulation 10.
Simulation 12, which eliminates both frictional and ther-mal difference between sea and land surface, gives results with many differences with respect to the control simulation. One of the main results of eliminating the driving mecha-nisms for the development of the coastal front is a straight movement of the precipitation area into land instead of a changed direction to the north as result of surface differences. In all earlier simulations, the spatial distribution of precipita-tion patterns is more or less parallel to the coastline.
Based on the calculated precipitation patterns, we can con-clude the following. In the studied situation, a higher SST enhances the development of a coastal front and causes a seaward shift of the front. A large increase of the SST leads to a precipitation area above sea and a disappearance of the line structure of the coastal front. A reduction of the SST splits the coastal front, causes lower precipitation amounts and makes that the (reversed) front penetrates further inland. Furthermore, both frictional convergence and thermal dif-ference are necessary for the development of the coastal front. Ballentine (1980) stated that thermal difference is
strictly necessary for the development of a coastal front. However, the elimination of frictional convergence at the coastline has more influence on the frontal precipitation pat-tern than the elimination of thermal difference for the south-westerly type of coastal fronts studied here. Without thermal difference (simulation 10) it is even possible for MM5 to cal-culate a precipitation distribution in a more or less coastal structure, although the front becomes discontinuous. 5.3 Topographical effects
A topographical effect is investigated by making the British Channel wider. The British Channel is the narrow sea be-tween England and France.
In order to understand the effect of the British Channel on the development of the coastal front under study, two extra simulations (13 and 14, Table 1) are carried out. In simula-tion 13 the land surface of England is modified in the inner domain (Fig. 3) into water body. In other words, all physical surface properties of that area are changed to those of the sea. Simulation 14 is a combination of simulation 12 and 13, with the land surface of England changed into water, together with an SST of 2 degrees lower with respect to the control simu-lation and the land surface roughness length equal to the sea (0.01 cm). All these variations are performed only within the inner domain.
Figures 14a and b show the 24-h accumulated precipita-tion distribuprecipita-tion between 12 August 12:00 UTC and 13 Au-gust 12:00 UTC, reproduced by simulation 13 and 14, re-spectively. A remarkable difference in distribution of pre-cipitation between the control simulation (simulation 2) and simulation 13 is the wider spread of precipitation related to the coastal front, in simulation 13. In the coastal region of point B and C (Fig. 3) the area with precipitation of more than 6 mm in 24 h is extended into both the direction of sea and land. However, in the region of point C, the precipitation maximum is decreased from 21 to 16 mm. In the neighbour-hood of point B, the maximum is not clearly changed, but the area with precipitation of 18 mm and more is increased. Near point A, the maximum amounts of precipitation, calcu-lated by simulation 13, are more or less equal to the control simulation.
The elimination of the land surface of England leads to a more outstretched area with precipitation over land and sea, but also to a smaller area with precipitation maxima above 18 mm, related to the coastal front. This is a likely result of the wider water surface between southern England and northern France. Since England is changed to a water mass, the flow toward the west coast of the Netherlands has a larger trajec-tory over the warm sea water. This results, as we have seen, in a larger area with precipitation.
(a)
F13A
(b)
F13B
(c)
F13C
F13D
(d)
F13D
F13E
(a)
F14A
F14B
(b)
F14B
Fig. 14. Accumulated precipitation amounts (mm), produced by simulation 13(a)and 14(b)over the time period between 12 August 2004 12:00 UTC and 13 August 2004 12:00 UTC. Specifications of the simulations are written in Table 1.
increased by 2 mm at maximum, caused by a longer flow of air parcels over water.
6 Conclusions
A coastal front in The Netherlands that occurred in the night between 12 and 13 August 2004 is studied by means of the mesoscale model MM5. The model results are com-pared to the results of two operational models (ECMWF and HIRLAM) and to available observations. Particular emphasis
is put on the driving mechanisms behind the development of the coastal front to understand their role. These mechanisms are frictional convergence, thermal difference between land and sea surface, and topography.
The three models under study are characterized by differ-ent resolution and physical parameterizations. ECMWF and MM5 are able to reproduce the coastal front, whereas the High Resolution Limited Area Model (HIRLAM) is not able to reproduce the coastal front for this situation. The non-hydrostatic mesoscale research model MM5 reproduces the coastal front satisfactorily compared to the accumulated pre-cipitation observed by the radar.
The main reason for the failure of HIRLAM in the repro-duction of the coastal front is the different wind pattern of HIRLAM, with respect to observations and the other two models. According to HIRLAM, the stream pattern in the west coastal area of The Netherlands was west to north-west, whereas ECMWF and MM5 both calculate a south-westerly stream pattern with also higher wind speeds. According to Roeloffzen (1986), a south-westerly flow is optimal for an enhancement of frictional convergence and consequently, in-creased upward motions, because of the optimal angle be-tween the wind direction and the coastline. The stream pat-tern of HIRLAM was roughly perpendicular to the coast, which is, according to Roeloffzen (1986), not favourable for a strong development of frictional convergence.
Thermal difference does not play an important role in all three models. The average thermal difference between sea and land surface over the three models is only 2–3◦C. In HIRLAM, the thermal difference is 0.5◦C lower, whereas the horizontal averaged absolute temperature is 1.5◦C higher than the observations and the model results of ECMWF and MM5. The exact effects of the deviating temperatures in the HIRLAM results are not known, but these results confirm that the surface conditions in HIRLAM versus ECMWF and MM5 contained large differences.
The precipitation pattern, measured by the radar is com-pared to the model results of ECMWF, HIRLAM and MM5. The radar image shows a line structure in the precipitation maxima, which follows the west coastal area of The Nether-lands. The mesoscale model MM5 calculates this pattern in the precipitation distribution. ECMWF also calculates an area with precipitation in the west coastal region. However, the maximum precipitation amount of ECMWF in that re-gion is much lower than that of MM5. HIRLAM calculates precipitation only for the northern part of the west coastal area. However, this is related to a large scale frontal system, situated above the northern part of The Netherlands.
lead to stronger convergence and consequently, an enhance-ment of upward motions. The larger value of the roughness length over land also influences the surface fluxes and in par-ticular, the latent heat flux becomes larger at day time. As a consequence of all these changes, implied by a larger land surface roughness length, the precipitation amounts near the coastline increase. However, the spatial precipitation pat-terns, obtained by MM5, show that the precipitation area penetrates less far inland than in the original situation, be-cause the coastline is acting as a sort of wall. The simulation with the land surface roughness length set equal to the value of the sea surface roughness length, produces the opposite ef-fect. Under these surface conditions, the surface convergence in the coastal area decreases and the line shape of the area with maximum precipitation amounts along the coast is not found anymore. In consequence, the precipitation maxima become lower, due to the decreased frictional convergence.
The simulations with a higher SST yield larger surface la-tent and sensible heat fluxes above sea. A small increment of the SST (+2◦C) produces larger precipitation amounts than the original situation. A large increment of the SST (+5◦C) also leads to higher precipitation amounts. Another conse-quence is a change of the line structure of the precipitation area into a larger precipitation area above sea without any line structure. A higher SST yields less penetration inland of the coastal front than in the original situation, whereas a lower SST leads to further inland penetration of the front. The precipitation amounts decrease as a result of the lower SST. The decrease of the sea surface temperature by 5◦C im-plies a higher land surface temperature than SST and con-sequently, a reversed coastal front with the same values of precipitation maxima as in the simulation without thermal difference between sea and land.
In the coastal front situation under study, frictional con-vergence is a more determining process than thermal differ-ence. The output of the simulation with diminished frictional convergence does not show a coastal front pattern anymore, whereas in the simulation with diminished thermal difference the precipitation pattern still follows the coastline, although it has moved inland. Without thermal difference between sea and land a coastal front is still developed. Therefore, in this situation and according to the model results of MM5, ther-mal difference was not strictly necessary for the formation of a coastal front.
Finally, the influence of topographic factors is also ana-lyzed and in particular, the effect of England on the flow in the British Channel. This is done by changing the land use of England into water body. This change results in lower pre-cipitation amounts in the southern part of the coastal front area. However, this is only found in the simulation that con-tains the original SST and land surface roughness length. It is not found in the simulation that contains an SST of 2◦C lower than the original temperature and that has a land sur-face roughness length set equal to the sea sursur-face roughness length.
We can therefore conclude that surface conditions have a critical effect on the development of coastal fronts. A differ-ence in flow pattern at the surface can have the consequdiffer-ence that a coastal front could not be formed and further develop. The prescribed values of land surface roughness length, SST and land use can have therefore large consequences for the coastal front evolution. Also the choice of the boundary layer scheme is very important, because it can have a large in-fluence on variables like land surface temperature. For the predictability of the weather, using numerical weather pre-diction models, it is very important to have reliable surface conditions as input to the model.
Acknowledgements. The authors would like to thank L. Kroon and A. Moene from Wageningen University for the help with the display program GrADS. K. van den Dries, also from Wageningen Univer-sity is also acknowledged for all technical help.
Topical Editor F. D’Andrea thanks I. Jankov, R. Stull, and an-other referee for their help in evaluating this paper.
References
Ballentine, R. J.: A numerical investigation of New England coastal frontogenesis, Mon. Wea. Rev., 108, 1479–1497, 1980. Blackadar, A. K.: Modelling the nocturnal boundary layer,
preprints, third symp. on atmospheric turbulence, diffusion, and air quality, Raleigh, NC, Amer. Meteorol. Soc., 1, 46–49, 1976. Blackadar, A. K.: High resolution model of the planetary
bound-ary layer. Advances in environmental science and engineering, edited by: Pfaffin, J. and Ziegler, E., vol. 1, No. 1, Gordon and Breach, 50–85, 1979.
Bosart, L. F., Vaudo, C. J., and Helsdon Jr., J. H.: Coastal frontoge-nesis, J. Appl. Meteorol., 11, 1236–1258, 1972.
Bosart, L. F.: New England coastal frontogenesis, Quart. J. Roy. Meteorol. Soc., 101, 957–978, 1975.
Braun, S. A. and Tao, W. K.: Sensitivity of high-resolution simu-lations of hurricane Bob (1991) to planetary boundary layer pa-rameterizations, Mon. Wea. Rev., 128, 3941–3961, 2000. Burk, S. D. and Thompson, W. T.: A vertically nested regional
numerical weather prediction model with second-order closure physics, Mon. Wea. Rev., 117, 2305–2324, 1989.
de Rooy, W., Kok, K., Tijm, S., and Vogelezang, D.: Een ontspoord Hirlam model?, Meteorologica, 13–4, 7–10, 2004.
Dudhia, J.: A nonhydrostatic version of the Penn State – NCAR mesoscale model: Validation tests and simulation of an Atlantic cyclone and cold front, Mon. Wea. Rev., 121, 1493–1513, 1993. Grell, G. A.: Prognostic evaluation of assumptions used by cumulus
parameterizations, Mon. Wea. Rev., 121, 764–787, 1993. Grell, G. A., Dudhia, J., and Stauffer, D. R.: A description of
the fifth-generation Penn State/NCAR Mesoscale Model (MM5), NCAR Tech. Note, NCAR/TN-398 + STR, 122 p., 1995. Gustavsson, T., Lindqvist, S., Borne, K., and Bogren, J.: A study
of sea and land breezes in an archipelago on the west-coast of Sweden, Int. J. Climatol., 15, 785–800, 1995.
Kain, J. S. and Fritsch, J. M.: The Kain-Fritsch scheme. The repre-sentation of Cumulus convection in numerical models, Meteorol. Monogr., No. 46, edited by: Emmanuel, K. A. and Raymond, D. J., Amer. Meteorol. Soc., 165–170, 1993.
Kain, J. S.: The Kain-Fritsch convective parameterization: an up-date, J. Appl. Meteorol., 43, 170–181, 2004.
Lange, B., Larsen, S., Hojstrup, J., and Barthelmie, R.: Importance of thermal effects and sea surface roughness for offshore wind resource assessment, J. Wind Eng. and Ind. Aer. 92, 959–988, 2004.
Louis, J. F.: A parametric model of vertical eddy fluxes in the atmo-sphere, Bound.-Layer Meteorol., 17, 187–202, 1979.
Louis, J. F., Tiedtke, M. M., and Geleyn, J. F.: Planetary bound-ary layer parameterization, ECMWRF Workshop Proc., 59–79, 1981.
Melas, D., Lavagnini, A., and Sempreviva, A. M.: An investigation of the boundary layer dynamics of Sardinia Island under sea-breeze conditions, J. Appl. Meteorol., 39, 516–524, 2000. Ng, K. H. and Spalding, D. B.: Turbulence model for boundary
layer near walls, Phys. Fluids, 15, 20–30, 1972.
Oncley, S. P. and Dudhia, J.: Evaluation of surface fluxes from MM5 using observations, Mon. Wea. Rev., 123, 3344–3357, 1995.
Roeloffzen, J. C., van den Berg, W. D., and Oerlemans, J.: Fric-tional convergence at coastlines, Tellus, 38A, 397–411, 1986. Sass, B. H., Nielsen, N. W., Jørgensen, J. U., and Amstrup, B.: The
operational DMI-HIRLAM System, 2nd rev. edn., DMI Techni-cal Report, 99–21, available from http://www.dmi.dk, 1999. Telisman Prtenjak, M. and Grisogono, B.: Idealised numerical
sim-ulations of diurnal sea breeze characteristics over a step change in roughness, Meteorol. Zeitschr., 11, 345–360, 2002.
van den Berg, W. D.: Coastal frontogenesis in The Netherlands: observations and modelling, University of Utrecht, Utrecht, The Netherlands, 239 p, 1987.
Wisse, J. S. P. and Vil`a-Guerau, J. de Arellano: Analysis of the role of the planetary boundary layer schemes during a severe convec-tive storm, Ann. Geophys., 22, 1861–1874, 2004,
http://www.ann-geophys.net/22/1861/2004/.
Zhang, D. L. and Anthes, R. A.: A high-resolution model of the planetary boundary layer – sensitivity tests and comparisons with SESAME-79 data, J. Appl. Meteorol., 21, 1594–1609, 1982. Zhong, S. Y. and Takle, E. S.: An observational study of sea-breeze