The Biochemical Properties of the
Arabidopsis Ecto-Nucleoside Triphosphate
Diphosphohydrolase AtAPY1 Contradict a
Direct Role in Purinergic Signaling
Carolin Massalski1, Jeannine Bloch1, Matthias Zebisch2, Iris Steinebrunner1*
1Department of Biology, Technische Universität Dresden, Dresden, Germany,2Division of Structural Biology, University of Oxford, Oxford, United Kingdom
Abstract
The Arabidopsis E-NTPDase (ecto-nucleoside triphosphate diphosphohydrolase) AtAPY1 was previously shown to be involved in growth and development, pollen germination and stress responses. It was proposed to perform these functions through regulation of extracel-lular ATP signals. However, a GFP-tagged version was localized exclusively in the Golgi and did not hydrolyze ATP. In this study, AtAPY1 without the bulky GFP-tag was biochemi-cally characterized with regard to its suggested role in purinergic signaling. Both the full-length protein and a soluble form without the transmembrane domain near the N-terminus were produced in HEK293 cells. Of the twelve nucleotide substrates tested, only three–
GDP, IDP and UDP–were hydrolyzed, confirming that ATP was not a substrate of AtAPY1. In addition, the effects of pH, divalent metal ions, known E-NTPDase inhibitors and calmod-ulin on AtAPY1 activity were analyzed. AtAPY1-GFP extracted from transgenic Arabidopsis seedlings was included in the analyses. All three AtAPY1 versions exhibited very similar biochemical properties. Activity was detectable in a broad pH range, and Ca2+, Mg2+and Mn2+were the three most efficient cofactors. Of the inhibitors tested, vanadate was the most potent one. Surprisingly, sulfonamide-based inhibitors shown to inhibit other E-NTPDases and presumed to inhibit AtAPY1 as well were not effective. Calmodulin stimulat-ed the activity of the GFP-tagless membranous and soluble AtAPY1 forms about five-fold, but did not alter their substrate specificities. The apparent Kmvalues obtained with
AtAPY1-GFP indicate that AtAPY1 is primarily a GDPase. A putative three-dimensional structural model of the ecto-domain is presented, explaining the potent inhibitory potential of vanadate and predicting the binding mode of GDP. The found substrate specificity classifies AtAPY1 as a nucleoside diphosphatase typical of N-terminally anchored Golgi E-NTPDases and ne-gates a direct function in purinergic signaling.
OPEN ACCESS
Citation:Massalski C, Bloch J, Zebisch M, Steinebrunner I (2015) The Biochemical Properties of the Arabidopsis Ecto-Nucleoside Triphosphate Diphosphohydrolase AtAPY1 Contradict a Direct Role in Purinergic Signaling. PLoS ONE 10(3): e0115832. doi:10.1371/journal.pone.0115832
Academic Editor:Frederik Börnke, Leibniz-Institute for Vegetable and Ornamental Crops, GERMANY
Received:October 1, 2014
Accepted:December 2, 2014
Published:March 30, 2015
Copyright:© 2015 Massalski et al. This is an open access article distributed under the terms of the Creative Commons Attribution License, which permits unrestricted use, distribution, and reproduction in any medium, provided the original author and source are credited.
Data Availability Statement:All relevant data are within the paper and its Supporting Information files. The DNA clones described in the paper have been deposited at the Arabidopsis Biological Resource Center in Ohio, USA. Their stock numbers are CD3-1921 for AtAPY1, CD3-1922 for AtAPY1-dTM and CD3-1923 for AtCaM2.
Introduction
Ecto-nucleoside triphosphate diphosphohydrolases (E-NTPDases) break down nucleoside tri-and diphosphates (NTPs/NDPs) to nucleoside monophosphates (NMPs) tri-and inorganic
phos-phate (Pi) [1]. E-NTPDases can be stimulated by a variety of divalent ions. A more salient
char-acteristic of E-NTPDases, however, is the presence of five conserved domains called“apyrase
conserved regions”(ACRs) [2–4]. E-NTPDases occur predominantly in eukaryotes where they
function extracellularly as well as within the cell.“Ecto”refers to the outside orientation of the
catalytic domain facing the extracellular space or the lumen of an organelle [5]. It was proposed
to reserve their historical name“apyrase”for intracellular E-NTPDases [5]. However, in the
plant literature, the term“apyrases”is often used for extracellular E-NTPDases as well.
E-NTPDases perform a wide range of functions and therefore differ greatly in their
enzy-matic properties (reviewed in [4]). Extracellular E-NTPDases are considered to be involved in
purinergic signaling in animals [6] and plants [7]. As regulators of purinergic signaling
mole-cules such as ATP (adenosine triphosphate) and ADP (adenosine diphosphate), their catalytic
efficiencies are reflected in low Kmvalues and high turnover numbers for these substrates [1].
The functions of intracellular E-NTPDases/apyrases vary for different localization sites. The
ly-sosomal apyrase LALP70 is thought to facilitate the salvage of nucleotides [8], while the
apy-rases in the endoplasmic reticulum (ER) are believed to be involved in reglycosylation
reactions [9,10] and the unfolded protein response [11]. Another proposed function is the
con-trol of the ATP concentration in the ER and Golgi lumen to regulate ATP-dependent processes
[12]. A subset of Golgi apyrases, which do not hydrolyze ATP, but GDP (guanosine
diphos-phate) and UDP (uridine diphosdiphos-phate), has functionally been characterized best. Deletion of their corresponding genes diminished the glycosylation of proteins in various yeast models
[13–17] and in the nematodeCaenorhabditis elegans[18]. The effect on glycosylation is based
on the apyrase action of converting UDP and GDP to the corresponding NMP. This conver-sion is critical to sustain the activity of Golgi glycosyltransferases because of their inhibition by
their by-products UDP and GDP [19].
InArabidopsis thaliana, seven different candidate genes for E-NTPDases exist, but only
four of the encoded proteins, AtAPY1 and 2 [20] and AtAPY6 and 7 [21], have been analyzed.
AtAPY1 and 2 have a molecular weight of 51 kDa each and their hydropathy plots suggest that they are single-pass type II membrane proteins. Indeed, AtAPY1 was experimentally confirmed
to be an integral membrane protein [22].
Their physiological roles have been studied in great detail. Overexpression of eitherAtAPY1
orAtAPY2promoted growth as quantified in hypocotyl and pollen tube growth assays [23]. Re-duced expression, on the other hand, e. g. by knocking out one of the two genes slowed down root
hair growth compared with the wild type (WT) [24]. Knocking out both apyrase genes blocked
pollen germination [25] and growth at the seedling stage [26]. Both blocks were abrogated by
complementation with eitherAtAPY1orAtAPY2[25,26], suggesting a high level of functional
re-dundancy between the two very homologous proteins which share 87% sequence identity. The model to explain the impact of AtAPY1 and 2 on pollen germination and growth was
based on the idea that these processes were governed by extracellular ATP (eATP) signals [25,
27]. AtAPY1 and 2 would serve as the enzymes regulating the concentration of these signals,
analogous to the situation established in animals. This idea was validated by the discovery of
an ATP receptor in plants [28].
One of the key experiments that connected the growth promotions with AtAPY1 and 2
ac-tivities was an in-vitro pollen-tube-growth assay [23]. Adding polyclonal antibodies raised
against AtAPY1 to growing pollen tubes inhibited extracellular soluble ATP hydrolysis activity and the growth rates of the pollen tubes. Simultaneously, the concentration of eATP rose.
The hypothesis of AtAPY1 and 2 limiting the concentration of eATP was further
corrobo-rated in studies on stomatal opening and closing [29]. All these findings also implied that the
two apyrases were active outside of the cell.
In a direct approach to localize AtAPY1, it was tagged with green fluorescent protein (GFP) for detection in transgenic plants by confocal laser scanning microscopy and transmission elec-tron microscopy. In contrast to the localization conclusions drawn from the pollen tube growth and stomata movement experiments, AtAPY1 was detected in the Golgi apparatus instead of
the extracellular space [22]. The Golgi localization was confirmed independently by similar
mi-croscopy approaches using fluorescent-protein tagged AtAPY1 (and AtAPY2) [30,31] and by
identifying AtAPY1 in the Golgi proteome [31,32].
Enzyme activity assays using isolated microsomes from mutant Arabidopsis lines indicated
that AtAPY1-GFP and AtAPY2-GFP hydrolyze UDP and GDP, but not ADP or CDP [30]. A
more comprehensive substrate specificity analysis with partially purified AtAPY1-GFP, testing twelve different nucleotides, revealed that only UDP, GDP and IDP (inosine diphosphate)
served as substrates [22]. This substrate specificity suggested that AtAPY1 is more likely
in-volved in glycosylation than in purinergic signaling.
In this study, AtAPY1 was analyzed in more detail, with a focus on its substrate specificity.
Two GFP-tagless variants—one with and one without the transmembrane domain (TM)—
were included to examine if the inability to break down ATP was caused by the fusion of AtAPY1 with the GFP-tag. Furthermore, the effect of calmodulin (CaM), which had been
pre-viously shown to bind to AtAPY1 [20], was investigated as a possible modifier of substrate
specificity.
Our analysis provides a broad biochemical characterization of AtAPY1 and further evidence questioning its role in purinergic signaling.
Materials and Methods
Reagents
The nucleotide substrates, bovine calcineurin, NaF, NaN3and Na3VO4were purchased from
Sigma and dissolved in water. Cellulase fromTrichoderma viridewas bought from Calbiochem.
The inhibitor #1 (N-(3-methylphenyl)-4-biphenylsulfonamide) (seeS1 Fig.) and inhibitor #4
(N’-(2-hydroxy-5-methylbenzylidene)-2-(1-naphthyl)acetohydrazide) (seeS2 Fig.) were kindly
provided by Gregory Clark and dissolved in dimethylformamide (DMF) at a final concentra-tion of 5 mg/mL. Recombinant GFP (rGFP; 26.9 kDa) was purchased from ProSpec. The
puri-fied proteins hemagglutinin-enhanced GFP (HA-eGFP; 29.2 kDa), pea apyrase [33] and
LpNTPDase1 (His6-tagged; [34]) were obtained from the group of Gerhard Rödel, Stanley
Roux and Norbert Sträter, respectively.
Plant culture
Arabidopsis thalianawild-type (ecotype Wassilewskija) and transgenic35S:AtAPY1-GFP
seed-lings [22] were grown in liquid culture on a gyrotary shaker (100 rpm) in a 16-h light /8-h dark
Extraction, immobilization and quantitation of AtAPY1-GFP
First, a crude protein extract was prepared from drained seedlings as described elsewhere in
de-tail [22]. Then, for the extraction of AtAPY1-GFP (for its sequence seeS3 Fig.), 100–200μL of
protein extract (= 40–350μg of protein depending on the yield) were added to microtiter plates
coated with antibodies against GFP (GFP-multiTrap plates, ChromoTek, Planegg-Martinsried,
Germany). After a minimum incubation of 2 h, the wells were washed three times with 300μL
of Tris-MES buffer (10 mM Tris, 2 mM MgCl2, 30 mM KCl, pH 6.5, adjusted with 1 M MES pH 3) for 2 min each at 500 rpm, so that only proteins immobilized by anti-GFP remained. The amount of bound protein was determined by measuring the GFP fluorescence. Each well
to be analyzed was filled with 200μL of Tris-MES buffer. The fluorescence (488 nm excitation/
525 nm emission) was measured with the multimode plate reader TECAN infinite M200
(Tecan, Germany) at four different sites in each well (=“square filled 2 x 2”setting). The
fluo-rescence was converted into protein amounts by using HA-eGFP as a reference. For the stan-dard curve, the fluorescence of ten different amounts of HA-eGFP ranging from 0 to 810 ng of input protein per well was measured in duplicates.
Cloning of AtAPY1 and AtAPY1-δTM
For production of C-terminally His-tagged AtAPY1 in HEK293 cells, the corresponding
se-quenceAtAPY1(The Arabidopsis information resource: At3g04080) was cloned into the ApaI
restriction site of the vector pcDNA3.1(-) (Life Technologies). The ApaI restriction sites, a Kozak consensus sequence and the sequence encoding the His-tag and the linker between
AtAPY1 and its His-tag were added to theAtAPY1cDNA by PCR using the primers 5’
-aagggcccattatgacggcgaagcgagcg-3’and 5’
-aagggccctcaatgatgatgatgatgatgtccacttcctggtgagga-tactgcttctat-3’. For production of the C-terminally His-tagged soluble form of AtAPY1 in
HEK293 cells, a shorter sequence encoding AtAPY1 without the TM was cloned into the AgeI and Acc65I restriction sites of the vector pHLsec. This vector contains sequences for a Kozak
consensus, a secretion signal and a His6-tag [35]. The compatible restriction sites AgeI and
BsiWI were introduced into theAtAPY1sequence by PCR using the primers 5’
-ataaccggtccgaa-gaattacgctgtga-3’and 5’-taacgtacgtgaggatactgcttctattg-3’. The encoded two AtAPY1 protein
se-quence versions are listed inS3 Fig.
Transfection of HEK293 cells
HEK293 cells (1 x 10⁸) were resuspended in 50 mL of FreeStyle 293 expression medium (Life
Technologies) without antibiotics. The expression plasmid (50μg) was diluted in 5 mL of
150 mM NaCl containing 400μg polyethylenimine (linear 25 kDa; Polysciences). The mixture
was incubated for 10 min and then added to the cells. Four hours later, the cells were pelleted and resuspended in 100 mL of fresh FreeStyle 293 expression medium plus the antibiotics penicillin and streptomycin, and the culture incubation temperature was lowered from 37°C to
31°C. Cells were shaken at 100 rpm in an 8% CO2in air atmosphere. Protein production levels
were checked after 2, 3 and 4 d. For production analysis of AtAPY1, a culture sample of 1 x 10⁶
cells was taken each time point. The cells were pelleted, resuspended in 125μL PBS containing
1 x Laemmli buffer and incubated at 80°C for 5 min. Nucleic acids were degraded with 20 U of
benzonase at 37°C for 10 min. To check production levels of AtAPY1-δTM, 60μL of cell
Purification of His-tagged AtAPY1 and AtAPY1-δTM
Four days after transfection, the HEK293 cells were harvested. For purification of AtAPY1,
about 1.5 x 10⁸cells were resuspended in 2 mL of binding buffer (20 mM Tris, 500 mM NaCl,
10 mM imidazole, pH 7.5; 1 x EDTA-free protease inhibitor cocktail“cOmplete”(Roche)).
After an ultrasonic treatment (75% power, 0.9 cycle, 5 x 1 s), 800μL DNase I (1 mg/mL) were
added, and the protein extract was incubated for 10 min on ice. Ni-NTA agarose (Qiagen) was equilibrated in binding buffer and incubated with the protein extract with an end-over-end ro-tation at 4°C for 1 h. The resin was pelleted, and a sample of the supernatant (= FT) was taken for further analysis. The pellet was washed with 1 mL of binding buffer (= W1). Three more
washes (= W2–4) with 1 mL wash buffer each (20 mM Tris, 500 mM NaCl, 20 mM imidazole,
pH 7.5; 1 x EDTA-free protease inhibitor cocktail“cOmplete”(Roche)) followed. Bound
pro-teins were eluted with 1 mL elution buffer (20 mM Tris, 500 mM NaCl, 250 mM imidazole, pH 7.5) and dialyzed against Tris-MES buffer (10 mM Tris, 30 mM KCl, pH 6.5, adjusted with 1 M MES pH 3). The dialyzed proteins were diluted 1:1 in 100% (v/v) glycerol. The same purifica-tion procedure was followed for mock transfecpurifica-tions, and the activity in the elupurifica-tion fracpurifica-tion was subtracted from the AtAPY1 activity values.
For purification of AtAPY1-δTM, the supernatant (40 mL) of a HEK293 culture 4 d post
transfection was incubated with Ni-NTA resin (Qiagen) equilibrated in binding buffer (20 mM Tris, 500 mM NaCl, pH 8.0) with an end-over-end rotation at 4°C for 3 h. The culture
superna-tant (= S) contained 20% (v/v) glycerol and 1 x EDTA-free protease inhibitor cocktail“
cOm-plete”(Roche). The resin protein mix was transferred to a column and a sample of the flow
through (= FT) was collected. Four washes (= W1–4) followed, each with 2 mL of binding
buff-er. Two more washes (= W5–6) ensued, each with 2 mL of wash buffer (20 mM Tris, 500 mM
NaCl, 10 mM imidazole, pH 8.0). Bound proteins were eluted twice (= E1–2) with 0.5 mL of
elution buffer each (20 mM Tris, 500 mM NaCl, 250 mM imidazole, pH 8.0). Dialysis and dilu-tion in glycerol were performed as described above.
Expression and purification of CaM
For purification of CaM, theAtCaM2cDNA (GenBank accession number AY065179)
con-tained in the DNA clone U17248 (The Arabidopsis Information Resource database; [36]) was
recombined into the pDEST17 vector (Life Technologies) by the Gateway technology (Life Technologies). This vector allowed N-terminal His6-tagging of AtCaM2. For gene expression,
E.coliBL21 cells transformed with the vector were grown under antibiotic selection to an
opti-cal density) of 0.6 at 600 nm. Induction with 0.5 mM isopropyl-β-D-thiogalactopyranosid
fol-lowed and cells were harvested 4 h later. For cell lysis, the pellet was resuspended in extraction
buffer (20 mM Tris, 500 mM NaCl, pH 8.0; 1 x EDTA-free protease inhibitor cocktail“
cOm-plete”(Roche), 2 mM DTT, lysozyme (1 mg/mL)). After a 30-min incubation on ice, an
ultra-sonic treatment (75% power, 0.9 cycle, 6 x 10 s) was performed. The suspension was incubated with RNase A (1 mg/mL) on ice for 10 min. Cell debris was pelleted by centrifugation and the supernatant was filtered through a 0.22-μm mesh. The filtrate was adjusted with imidazole to a
final concentration of 10 mM and subjected to Ni2+-affinity chromatography. Washes and
elu-tions were performed with 20 mM and 250 mM imidazole, respectively. For NTPDase activity assays, the eluted protein was dialyzed against Tris-MES buffer (pH 6.5). For subsequent bioti-nylation, the dialysis was performed against 1 x PBS (pH 7.5).
Biotinylation of CaM and SNAP-tag protein
concentrators; Sartorius) to a concentration of 6 mg/mL and then biotinylated according to the
manufacturer’s instructions with a 20-fold molar excess of biotin reagent at 4°C overnight.
Non-reacted Sulfo-NHS-SS-Biotin was removed by dialysis against 1 x PBS. Successful biotiny-lation was confirmed by dot or Western blotting and streptavidin-based detection described
under“CaM overlay”.
The N-terminally His12-tagged SNAP-tag protein (New England Biolabs) was Ni2+-affinity
purified and covalently labeled with biotin according to New England Biolabs’instructions.
Protein quantitation
Protein quantitation was performed in duplicates using the microplate procedure of a bicinch-oninic acid (BCA) protein assay kit (Pierce).
Silver and Coomassie staining
For staining of protein gels, the 1-step Coomassie staining solution from Generon was used or
the silver staining procedure described in [37] was followed.
Immunoblotting
Protein samples were separated by SDS-PAGE and transferred to BioTrace NT nitrocellulose or 0.45-μm PVDF membranes (both from PALL Life Sciences). The membranes were blocked
in 1–5% (w/v) skim milk for 1 h and then incubated with primary antibodies for 1 h at room
temperature or overnight at 4°C. The concentrations used were 1:1,000 for anti-GFP (mixture of two monoclonal mouse antibodies against recombinant GFP; Roche, catalog no.
11814460001), 1:50 for anti-AtAPY1 (polyclonal guinea pig antibody“gp19”against
recombi-nant AtAPY1 [23], purified via CM Affi-Gel Blue (BioRad)) and 1:5,000 for anti-His
(mono-clonal mouse antibody against Penta-His; Qiagen, catalog no. 34660). Three washes for 10 min each followed before the horseradish peroxidase-coupled polyclonal secondary antibodies were added at the following concentrations: 1:5,000 for anti-mouse IgG from sheep (GE Healthcare, catalog no. NA9310V) and 1:10,000 for anti-guinea pig IgG from goat (Sigma, catalog no. A7289). After three more washes for 10 min each, the immunocomplexes were detected by chemiluminescence with the ECL Prime reagents (GE Healthcare). The primary and secondary antibodies were diluted in 1% (w/v) skim milk except for anti-His which was diluted in 3% (w/v) BSA. PBS- or TBS-based buffers were used for blocking, antibody dilutions and washes. Band intensities were quantified by densitometry using the TotalLab TL100 version 2006 soft-ware (Nonlinear Dynamics, UK).
CaM overlay
diluted 1:100, pH 9.5). As a control for the specificity of the CaM binding, another membrane
was handled in parallel with the only difference that Ca2+was replaced with 5 mM EGTA in all
pertinent solutions.
AtAPY1 activity assay
Apyrase activity was determined by the quantitation of Pirelease per min by continuous and
discontinuous methods. As controls, 5 mU of recombinant potato apyrase (New England Bio-labs) were incubated in the presence of 3 mM ATP (positive control) or 3 mM AMP (negative
control) in a total volume of 60μL. The data analysis was performed with the Prism 5.0
soft-ware (GraphPad).
For the continuous AtAPY1 activity assay, the release of Piwas measured in the presence of
1 mM MgCl2using the EnzChek phosphate assay kit (Molecular Probes). The kit is based on a
coupled enzyme reaction described in [38]. Basically, the Piproduced by apyrase is the
sub-strate of PNP (nucleoside phosphorylase) which converts Piand
2-amino-6-mercapto-7-methylpurine riboside (MESG) to ribose 1-phosphate and
2-amino-6-mercapto-7-methylpur-ine (AMM). The product AMM absorbs light at 360 nm. Each standard reaction of 100μL
con-tained 0.1 U PNP and 200μM MESG and was incubated at pH 6.5 and 25°C. One unit (U)
PNP was defined as the phosphorolysis of 1.0μmol of inosine to hypoxanthine and ribose
1-phosphate per minute at pH 7.4 and 25°C. The absorption was measured every 30 s with the multimode plate reader infinite M200 (Tecan, Germany).
The discontinuous activity assay was based on the method described in [39]. The nucleotide
substrates were purchased from Sigma and the stock solutions were prepared in water. For the assays with AtAPY1-GFP, nucleotides were diluted in Tris-MES buffer (10 mM Tris base,
2 mM MgCl2(unless stated otherwise in the figure legends), 30 mM KCl, pH 6.5 (except pH
ex-periments), adjusted with 1 M MES pH 3) to the desired concentration and added as 130-μL al-iquots to each well of immobilized AtAPY1-GFP on the GFP-multiTrap plate. The reaction was incubated under shaking (500 rpm) at 30°C for 1 h. The released phosphate was assayed
by transferring 60μL of each reaction mixture to two separate wells on a transparent 96-well
microtiter plate (Cellstar, Greiner Bio-One, Kremsmünster, Austria) and by adding 120μL of
freshly prepared stopping solution of 0.375 M H2SO4, 0.75% (w/v) (NH2)4MoO4×4H2O, 0.7% (w/v) SDS and 3% (w/v) FeSO4×7H2O to each well. After a 10-min incubation at room temper-ature, the absorbance was read at 740 nm with the multimode plate reader infinite M200 (Tecan, Germany). A slightly modified version of the assay was performed for CaM and inhibi-tor #1 and #4 treatments. The nucleotides and either CaM or an inhibiinhibi-tor were diluted in the aforementioned Tris-MES buffer to the desired concentrations and added as 60-μL aliquots to each well of immobilized AtAPY1-GFP. For each treatment, two such reactions were run in
parallel. After stopping the reactions by adding 120μL of stopping solution to each well, the
ab-sorbance of the samples was measured directly in the GFP-multiTrap plate.
For the assays with AtAPY1 or AtAPY1-δTM, other modifications were made: The
Tris-MES buffer used as reaction buffer contained 1 mM MgCl2, unless stated otherwise in the fig-ure legends. Mastermixes including the enzymes and all necessary assay components except for the nucleotides were pipetted directly into the 96-well microtiter plates described above. The addition of nucleotides to initiate catalysis happened simultaneously. Reactions were run
in duplicates and the final volume of each reaction was 60μL. After the incubation period (for
conditions see above), the reactions were terminated with 120μL of stopping solution and
parallel with WT protein extracts of the same concentration. For the AtAPY1 and
AtAPY1-δTM assays, control reactions were incubated at 95°C for 5 min to inactivate the enzymes
be-fore adding the substrates. The absorbance readings of the controls were subtracted from the sample readings.
Structural modeling of the AtAPY1 ecto-domain
For selection of a template structure, sequence alignments of AtAPY1 (Universal protein re-source knowledgebase (UniProtKB): Q9SQG2) and 2 (UniProtKB: Q9SPM5) to sequences of experimental NTPDase structures were performed. To date five different NTPDase structures
have been solved [34,40–45], all of which do not belong to the phylogenetic clade of
intracellu-lar NTPDases that also includes AtAPY1 and 2 [1]. Sequence identity of the catalytic domain
of AtAPY1 to RnNTPDase1 (protein data bank (pdb): 3ZX3) is 22.6%, to RnNTPDase2 (pdb:
3CJA) 22.0% and to NTPDase1 from the bacteriumLegionella pneumophila(LpNTPDase1;
pdb: 3AAP) 22.5%. Sequence identities to the protozoan NTPDase ofToxoplasma gondii(pdb:
4A57) andNeospora caninum(pdb: 3AGR) are even lower. The RnNTPDase2 structure was
selected over that of RnNTPDase1 and LpNTPDase1 for two reasons. First, all three cysteine bridges in the C-terminal domain are conserved between AtAPY1, 2 and RnNTPDase1, 2. LpNTPDase1, on the contrary, possesses only the two strictly conserved disulfide bridges. Sec-ond, multiple published and unpublished complex structures are available for RnNTPDase2 [45].
The sequence alignment between RnNTPDase2 and AtAPY1 performed with the ClustalW
algorithm [46,47] was manually cured in the nucleoside binding region to define equivalence
of residues362ASFFF366of AtAPY1 to residues346SAYYY350of RnNTPDase2. Based on this
alignment, a model for AtAPY1 containing residues K68 to P471 was generated using the
pro-gram MODELLER [48]. For graphical reasons only, a single N-acetylglucosamine group was
added manually in COOT [49] to the sole potential N-glycosylation site at N333. A model of a
Mg2+×VO43-complex was obtained by copying the coordinates of the terminal phosphate and
divalent metal cation of the Ca2+×AMPPNP (adenosine 5’-[(β,γ)-imido] triphosphate)
com-plex of RnNTPDase2. Bond lengths of the artificial VO43-ion were corrected using COOT
[49]. The validity of this approach is given because complex structures of RnNTPDase2 and
LpNTPDase1 with phosphate, sulfate, tungstate, molybdate and vanadate could be obtained in
which the anion always occupies the binding site of the terminal phosphate [34,40,45].
Molyb-date and vanaMolyb-date ions displayed distorted geometries reminiscent of a transition state,
howev-er, these distorted geometries have not been used in this work. A model of a Mg2+×GDP
complex was obtained by copying the coordinates of the metal ion and the nucleotide analog of
a Mg2+×GMPPNP (guanosine 5’-[(β,γ)-imido] triphosphate) complex of RnNTPDase2, but
leaving out the coordinates of theα-phosphate moiety. As was published elsewhere [45],
NTPDases were found to skip the first phosphate binding site in NDP hydrolysis.
Statistical and bioinformatical analyses
Statistical analyses were performed with the programs Prism 5.0 (GraphPad) or SPSS 19 (IBM). TM and N-glycosylation site predictions were annotated according to the
Knowledge-base [50] of the Universal Protein Resource [51]. Sequence alignments were done with the
Bio-Lign program version 4.0.6.2. The putative CaM binding sites were analyzed with an online
analysis tool [52] described in [53]. Disulfide bond partner predictions were made with the
Results
Bioinformatical analysis of the AtAPY1 protein sequence
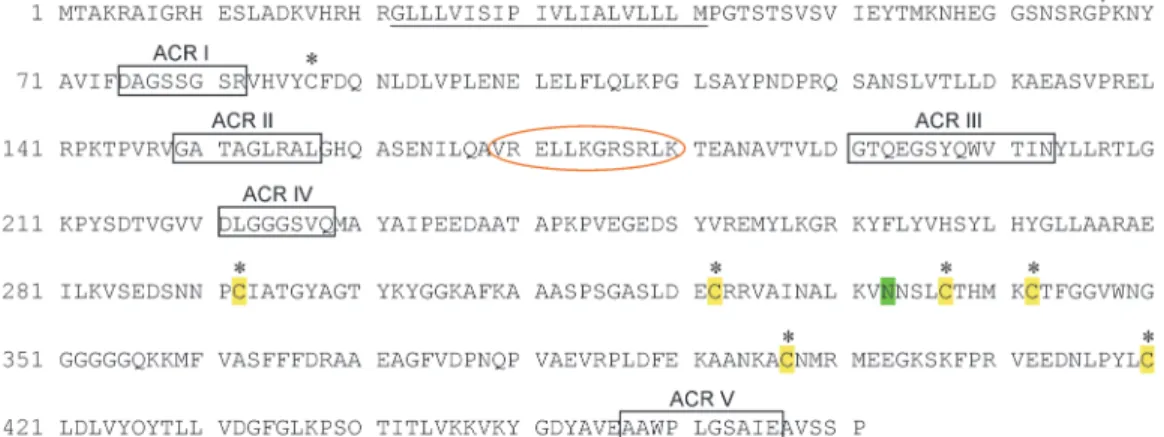
The biochemical analysis of the protein sequence confirmed that AtAPY1 contains the five
ACRs typical of E-NTPDases and a single TM near the N-terminus (Fig. 1). Furthermore, a
N-glycosylation site and calmodulin-binding site (CBS) were found as published previously [20],
although our analysis with the calmodulin target database [52] placed the most likely CBS
(framed orange inFig. 1) in a different position. Additionally, six highly conserved cysteines
were identified which were predicted to form disulfide bridges.
Because of these predictions, extraction of AtAPY1 directly from its plant source was deemed important for biochemical analyses to ensure its native posttranslational modifica-tions. In addition, when extracted from its native host, possible binding partners crucial for ac-tivity would get co-extracted.
Previously, a transgenic Arabidopsis line which synthesized AtAPY1 fused C-terminally
with GFP was characterized [22]. The GFP-tag proved very useful in extracting active AtAPY1
and genetic complementation experiments gave no indication that the tag changed the
biologi-cal function of AtAPY1 [22]. However, slight differences in enzyme properties between the
tagged and the native AtAPY1 might have gone unnoticed. Therefore, AtAPY1 without the GFP-tag was included in our studies and expressed in the host HEK293 which harbors the po-tential of producing active proteins even if they contain TMs and require complex posttransla-tional modifications.
In addition, AtAPY1 without the TM was cloned and expressed in HEK293 cells to produce a soluble version, although there is no experimental evidence in the literature that a soluble form of AtAPY1 exists in vivo. This variant was included in the analyses nonetheless, because a
soluble variant was described for mammalian homologs of AtAPY1 [56,57].
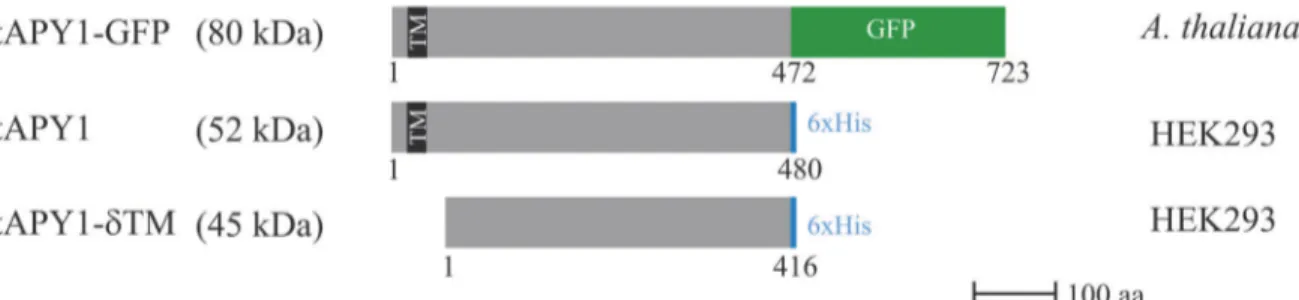
In total, three different versions of AtAPY1 as outlined inFig. 2were biochemically
characterized.
Isolation of AtAPY1-GFP
Active AtAPY1-GFP was extracted from transgenic Arabidopsis plants expressing
AtAPY1-GFPin a one-step purification procedure using microtiter plates coated with antibodies against
Fig 1. Protein sequence characteristics of AtAPY1.The complete AtAPY1 protein sequence is shown. The transmembrane region (TM) is underlined and the putative N-glycosylation site is marked in green. The ACRs are boxed. Six of the seven cysteines (black asterisks) are highly conserved and highlighted in yellow. The putative calmodulin-binding site is circled in orange. A black triangle marks where the sequence of AtAPY1-δTM begins.
GFP (GFP-multiTrap plate). This technology was described to be a reproducible and robust
isolation method of GFP fusion proteins [58]. In order to confirm this, equal volumes of the
same crude protein extracts fromAtAPY1-GFPexpressing plants or WT control were added to
wells of a GFP-multiTrap plate. After the incubation time, the protein solution was removed, replaced by buffer and the GFP fluorescence was determined. In the control wells, the fluores-cence values were barely above the noise level of the detection method, indicating the absence
of bound GFP (S4 Fig.). In the wells incubated with extracts fromAtAPY1-GFPexpressing
plants, however, the fluorescence was significantly above the background (6–7 times above the
limit of quantitation), demonstrating that GFP had bound (S4 Fig.). On average 330 ng of GFP
from transgenic crude extracts were immobilized per well. This amount represents only an esti-mate because the standard curve for the fluorescence values was based on GFP and not
AtAPY1-GFP as a reference.
There were no statistical differences in the amounts of bound GFP from the same protein
extract (p<0.001; one-way ANOVA (analysis of variance) test and Tukey test), confirming
the reproducibility of this isolation method.
In order to verify that AtAPY1-GFP was bound, the attempt was made to elute proteins bound by the GFP antibodies with 300 mM glycine (pH 2.5). However, the amount of proteins bound per well turned out to be too low to be detected by silver staining or even immunoblot-ting (data not shown). Therefore, an indirect approach was tested which turned out to be suc-cessful. The amount of AtAPY1-GFP in the crude protein extract before and after incubation
in a GFP-multiTrap well was compared by Western blot analysis. As shown inFig. 3, the
anti-body against GFP detected two proteins in the extracts: A protein of about 85 kDa which was close to the theoretical molecular weight of AtAPY1-GFP of 80 kDa, and a protein of around 27 kDa which matched the theoretical molecular weight of GFP alone. The bulk of free GFP most likely came from proteolytic degradation of AtAPY1-GFP during the protein extraction procedure and incubation period, although there is evidence from immunogold labeling
exper-iments that degradation of AtAPY1-GFP also occurs in planta [22].
Comparing the signal intensities before and after immobilization showed that both free
GFP and AtAPY1-GFP were captured by the GFP-multiTrap coating (Fig. 3). In addition, the
immunoblotting results revealed that the majority of the GFP fluorescence originated from GFP cleaved off of AtAPY1 and that therefore the amount of bound AtAPY1-GFP could not be accurately determined by fluorescence measurements. The lack of precise numbers for
Fig 2. Scheme of the three AtAPY1 proteins analyzed.All three AtAPY1 protein versions analyzed are drawn to scale. The numbers refer to the first and last amino acid (aa) of each mature protein produced in eitherA.thalianaor human embryonic kidney cells (HEK) 293. For AtAPY1-GFP, the number 472 marks the first aa of the GFP-tag (in green). The other two AtAPY1 derivatives were tagged with six histidines (in blue). The theoretical molecular weight of the fusion proteins are given in parentheses. The transmembrane domain (TM) is depicted as a black bar. The absence of the TM in AtAPY1 is denoted by
“-δTM”.
bound AtAPY1-GFP amounts together with the unknown amount of unspecifically bound
proteins, only allowed the calculation of the total activity for AtAPY1-GFP (Table 1). However,
the GFP-multiTrap method proved to be a very sensitive method which allowed purifying
ac-tive AtAPY1-GFP (as published in [22]) from little starting material reproducibly and fast.
Fig 3. Detection of extracted AtAPY1-GFP.A Western blot analysis of two different crude protein extracts before (= in) and after (= out) the immobilization by GFP-multiTrap is shown. Equal volumes of extract (15μL each) were loaded per lane, its proteins subjected to 10% SDS-PAGE, transferred to a nitrocellulose membrane and incubated with antibodies to GFP. The arrows mark the signals of the AtAPY1-GFP fusion protein and free GFP, respectively. The explanation of the colors in the schematic representation of AtAPY1-GFP can be found inFig. 2. Recombinant GFP (19 ng) served as a positive control and quantitative reference for densitometric evaluation of signal intensities. With this, the total amounts of bound AtAPY1-GFP from 100μL extract 1 and 2 were calculated as 130 ng and 22 ng, respectively. The image shows bands from the same exposure of the same membrane, but non-pertinent lanes were cropped as indicated by vertical lines. The shown signals are representative of at least five separate Western blot analyses of different GFP-multiTrap immobilization experiments.
doi:10.1371/journal.pone.0115832.g003
Table 1. Characteristics of purified AtAPY1 proteins.
Protein Purification step Total activitya(nmol P
i/min) Specific activitya(μmol Pi/min x mg) Fold purification
AtAPY1-GFP Binding to anti-GFP 0.09 + 0.03 n. d. n. d.
AtAPY1 Noneb 0.37 + 0.39 0.78 + 0.95 n. a.
AtAPY1-δTM None 2.04 + 0.43 0.33 + 0.09 n. a
Ni2+-affinity chromatography 0.35 + 0.19 21.7 + 12.0 70
n. a., not applicable; n. d., not determinable
aDetermined for the substrate UDP with the discontinuous assay. Values are the means from three assays + SD. bPuri
fication by Ni2+-af
finity chromatography was not possible as described in Results.
Expression and purification of AtAPY1 and AtAPY1-δTM
For the production of a GFP-tagless version, the cloned AtAPY1 sequence was transfected into HEK293 cells. At various time points after transfection, cell extracts were prepared and sub-jected to Western blot analysis. Using an antibody against AtAPY1, two proteins were detected (Fig. 4A, left panel). The smaller protein of 52 kDa was regarded as unspecific, because it was
already present before expression ofAtAPY1occurred. The larger protein of 61 kDa, however,
was absent at time point zero and appeared only at later time points, making it a likely candi-date for AtAPY1. Since AtAPY1 was tagged C-terminally with six histidines, it was tested if an
antibody against the His-tag would detect the same 61-kDa protein (Fig. 4A, left panel).
In-deed, the His antibody recognized the protein in question. Two other proteins of 65 kDa and 52 kDa were recognized as well, but they were disregarded due to their presence at time point zero. The recognition of the 61-kDa protein strengthened the argument that this protein repre-sented AtAPY1, although the apparent molecular weight was higher than the theoretical mo-lecular weight of 52 kDa.
In summary, the Western blot analyses suggested that AtAPY1 was synthesized by the HEK293 cells and that the amount of AtAPY1 remained approximately the same over four days post transfection.
Since the His-tag was shown to be present, Ni2+-affinity purification of AtAPY1 was
at-tempted. However, Coomassie staining of various purification fractions showed no sign of
en-richment of AtAPY1 in the elution fraction (Fig. 4A, right panel). A Western blot analysis of
the fractions with AtAPY1 antibodies confirmed that the amount of AtAPY1 remained similar
in all fractions (Fig. 4A, right panel), as if AtAPY1 was not binding to the matrix. Therefore,
less stringent binding and washing conditions with 5 mM imidazole instead of 20 mM were tried, but no binding was observed. Similarly, the addition of a detergent (20 mM 3-[(3chola-midopropyl)dimethylammonio]-1-propanesulfonate) and a reducing agent (2 mM dithiothrei-tol) to expose the possibly hidden His-tag did not promote binding.
When NTPDase activities were assayed, no activity was found in the elution (and other) fraction(s) from the purification steps using the cell extract from the mock transfected cells. The elution fraction from the transfected HEK293 cells, however, showed a specific activity of
0.78 + 0.95 U/mg (Table 1). So, although the specific activity was low, active AtAPY1 was
being produced.
For the expression of the soluble form, the sequence encoding AtAPY1 from the first
ß-strand after the TM to the end except for the terminal proline (residues 67–470) was cloned
(Fig. 1). Sequences coding for a secretion signal peptide and a C-terminal His6-tag were added (Fig. 2,S3 Fig.). HEK293 cells transfected with this construct showed no production of a pro-tein of the expected molecular weight of 45 kDa as judged by Coomassie staining of culture
su-pernatants from day 2 to 4 after transfection (Fig. 4B, left panel). However, Western blots with
antibodies against AtAPY1 unraveled the synthesis of a protein of 55 kDa (Fig. 4B, left panel).
Even though the apparent molecular weight of this protein was higher than the theoretical
mo-lecular weight of AtAPY1-δTM, it was concluded that it represented AtAPY1-δTM because of
its absence before transfection and its increasing amount over time. Incubation of the stripped membrane with His antibodies supported this conclusion as the same protein of 55 kDa was
detected (Fig. 4B, left panel). The results with anti-His also confirmed the presence of the
His-tag.
Since the amount of AtAPY1-δTM was highest four days after transfection (Fig. 4B, left
panel), the culture supernatant from this time point was used for Ni2+-affinity chromatography
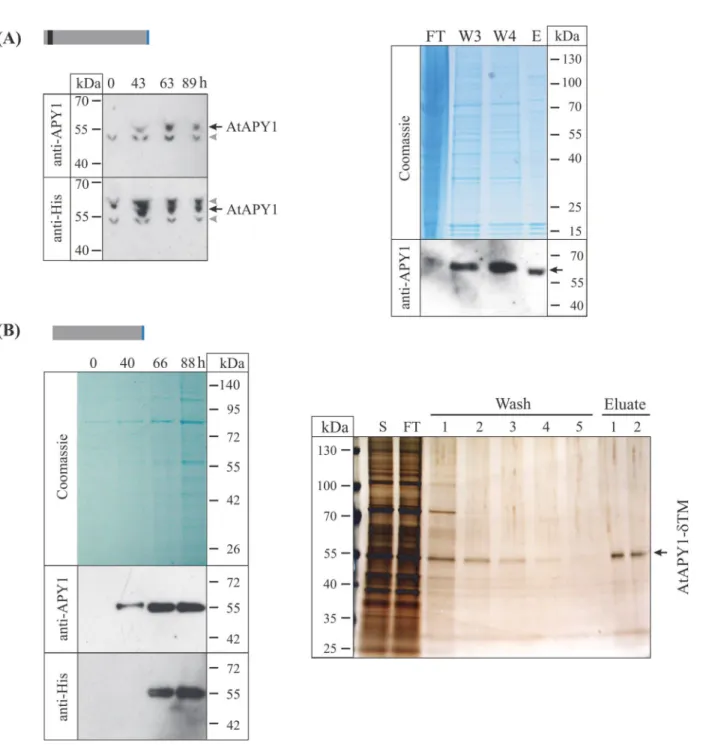
Fig 4. Purification of AtAPY1 and AtAPY1-δTM.The explanation of the colors in the schematic representations of AtAPY1 and AtAPY1-δTM can be found inFig. 2. (A) Total proteins from 1.6 x 10⁵HEK293 cells were harvested at each of the indicated time points post transfection withAtAPY1DNA, separated in
a 4–12% gradient gel under denaturing conditions, transferred onto a PVDF membrane and successively incubated with anti-APY1 and anti-His antibodies (left panel). The black arrows mark the signal specific for AtAPY1, while the gray arrowheads indicate unspecific bands. The right panel shows the total protein extract from 1.4 x 10⁸HEK293 cells harvested at 89 h after transfection withAtAPY1DNA subjected to Ni2+-affinity chromatography. Various fractions
were separated in a 4–12% gel under denaturing conditions and either stained with Coomassie or transferred onto a PVDF membrane for Western blot analysis. The black arrow indicates the signal detected with antibodies against AtAPY1. The volumes loaded were 1/480 of the flow through (FT) fraction, 1/ 50 of each of the final two wash fractions W3 and W4 and 1/100 of the elution fraction E. (B) The left panel shows samples representing equal volumes (1/ 3,000) of the culture medium of 1 x 10⁸HEK293 cells taken at the indicated time points post transfection withAtAPY1-δTMDNA and separated in a 4
–12% gradient gel under denaturing conditions. Subsequently, the proteins were either stained with Coomassie or blotted onto a PVDF membrane for Western blot analysis. The right panel depicts the culture medium of 4 x 10⁷HEK293 cells at time point 88 h after transfection withAtAPY1-δTMDNA subjected to Ni2+
-affinity chromatography. A gradient gel (4–12%) was loaded with 20μL of supernatant (S) and 20μL of flow through (FT), 10μL of each wash 1–5 and 10μL of each eluate 1–2. For total volumes of the individual fractions seeMaterials and Methods. The protein amount loaded for eluate 1 equals about 70 ng. Following SDS-PAGE, the gel was silver-stained.
of several of these fractions with antibodies against the His-tag or AtAPY1 confirmed the
iden-tity of this 55-kDa protein as AtAPY1-δTM (S5 Fig.). NTPDase activity measurements
demon-strated that AtAPY1-δTM was active. The increase of about 70 times between the specific
activity of AtAPY1-δTM in the supernatant and the elution fraction (Table 1) validated the
conclusion of a successful purification.
Broad pH range for activity
AtAPY1 was previously localized to the Golgi apparatus [22,30–32]. Therefore, the pH
opti-mum of AtAPY1 was expected to be around 6.2 which represents the pH found in the Golgi
ap-paratus [59]. In order to test this assumption, the activity of AtAPY1-GFP was assayed in the
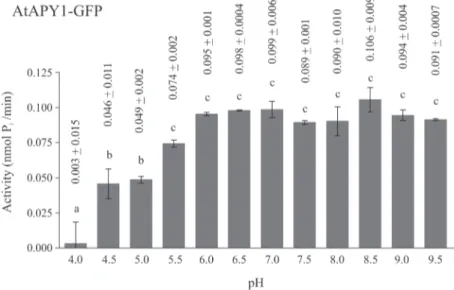
pH range from 4.0 to 9.5 in 0.5 pH intervals. AtAPY1-GFP was particularly useful for this assay, because its binding to the plate well bottoms allowed the original liquid to be readily re-placed by the reaction buffer of the desired pH. AtAPY1-GFP showed the highest and same
level of activity from pH 5.5 to 9.5 (Fig. 5). There was a significant drop in activity (p<0.01) at
pH 5.0 and the activity decreased further with increasing acidity. At pH 4.0 the activity was down to 3% of the highest activity observed. In summary, AtAPY1-GFP showed maximum ac-tivity in a broad pH range which included the pH of its Golgi localization.
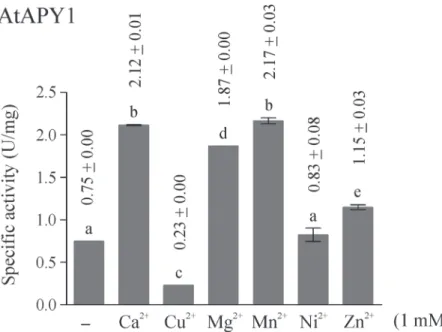
Effect of divalent ions on activity
E-NTPDases are known to depend on divalent ions for activity, because the metal nucleotide complex acts as the real substrate. Nevertheless, the most suitable metal as cofactor differs
among NTPDases. For AtAPY1, six different divalent ions were tested (Fig. 6). The ions Ca2+,
Mg2+, Mn2+and to a lesser extent Zn2+stimulated its activity while Ni2+had no effect. The
metal Cu2+even inhibited its activity.
This metal ion preference was compared with that of AtAPY1-GFP (S6 Fig.). Both enzymes
showed the same response pattern, except for AtAPY1-GFP not being stimulated by Zn2+.
Fig 5. Influence of pH on AtAPY1-GFP activity.Enzyme activities were determined in the presence of 3 mM UDP using the discontinuous apyrase activity assay. The activity of AtAPY1-GFP was measured discontinuously over the pH range indicated. Different letters above the columns indicate mean values that are significantly different from one other (one-way ANOVA and Tukey test; p<0.01). Error bars represent
standard deviations of duplicates from one assay. The data are representative of four activity assays with independent protein extracts.
Since some activity was observed even in the absence of any cofactor (Fig. 6,S6 Fig.), it was checked if the residual activity was due to contaminating ions in the reaction buffer. For this
control, the activity of AtAPY1-GFP with and without the chelator EDTA was compared (S6
Fig.). Indeed, the addition of EDTA completely abolished apyrase activity, pointing to the
pres-ence of some divalent ions in the reaction buffer. Therefore, as anticipated, the activity of
AtAPY1 depends on divalent ions as cofactors which are preferably Ca2+, Mg2+or Mn2+.
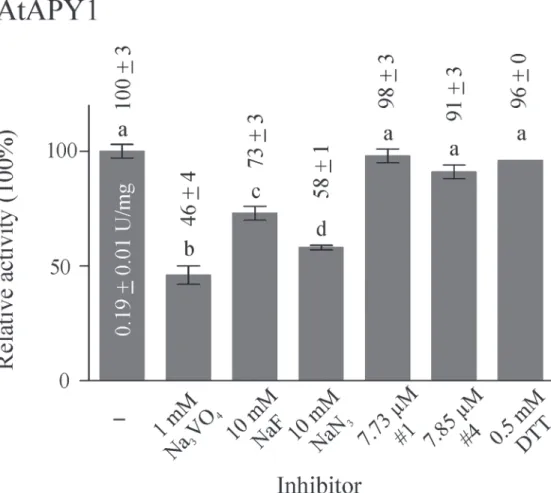
Inhibitors of AtAPY1
Apyrases are typically inhibited by chelating agents (as confirmed for AtAPY1-GFP inS6 Fig.).
Other potential inhibitors are azides and the phosphate analogs orthovanadate (VO43-) and
fluorides. To test the inhibitory potential of these chemicals, the effect of sodium vanadate,
sodium fluoride and sodium azide on AtAPY1 activity was investigated (Fig. 7). Vanadate
(1 mM) had the strongest effect, reducing the activity of AtAPY1 by 54%. Fluoride and azide inhibited the activity by 27% and 42%, respectively, at a concentration of 10 mM. The same
in-hibition pattern was found for AtAPY1-GFP (S7 Fig.).
The three chemicals tested are rather non-specific inhibitors. Vanadate and NaF also inhibit alkaline phosphatases, vanadate also P-type ATPases, and sodium azide inhibits F-type
ATPases. With the objective to find apyrase-specific inhibitors, Windsor et al. [60] screened a
chemical library of low-molecular-weight compounds, using a commercially available potato apyrase (grade VI; Sigma) as the model NTPDase. Among others, they found the two inhibitors
#1 (also published under the name NGXT191) (S1 Fig.) and #4 (S2 Fig.), belonging to the
structural class of sulfonamides. Although these inhibitors turned out not to be completely
apy-rase-specific because they inhibited alkaline phosphatases as well [61], they have become useful
Fig 6. Influence of divalent metal ions on AtAPY1 activity.Enzyme activities were determined in the presence of 3 mM UDP using the discontinuous apyrase activity assay. The activity of AtAPY1 (1 U = 1μmol Pi/min) was measured in the absence or presence of either 1 mM CaCl2, CuCl2, MgCl2, MnCl2, NiCl2
or ZnCl2. The control (-) shows the activity without the addition of any divalent ions. The means + SD of
duplicates from one assay are shown. Different letters above the columns indicate mean values that are significantly different from one other (one-way ANOVA and Tukey test; p<0.01). Data are representative of
two activity assays.
tools in deciphering the physiological role of extracellular E-NTPDases in plants [23,24,29,
62–64].
First, the inhibitory effect of these two chemicals was tested on a commercially available re-combinant potato apyrase. Both compounds reduced the apyrase activity by approximately
40% (S8 Fig.). This result confirmed the previously published inhibitory effects [60], although
it is unknown if the potato apyrases analyzed in the previous publication and here are the same, because the commercial suppliers do not provide the sequences of their apyrase
prod-ucts, and many different potato apyrase proteins exist [65].
Next, the inhibitors were tested at the concentration that had previously been shown to re-duce the activity of soluble Arabidopsis ecto-apyrase by over 80% compared with the control
[23]. The activity of AtAPY1 or AtAPY1-GFP, however, was not affected by the inhibitors at
this concentration of 2.5μg/mL (= 7.73μM inhibitor #1 and 7.85μM inhibitor #4, respectively)
or by their solvent DMF alone (Fig. 7,S7 Fig.). Obviously, the inhibitors #1 and #4 do not
in-hibit apyrases in general. This observation was confirmed by others who tested the inin-hibitor #1 on the recombinant soybean (Glycine soja) plasma membrane-bound ecto-apyrase GS52
whose activity remained unaffected by concentrations of up to 30.9μM (= 10μg/mL) [66].
Fig 7. Influence of inhibitors on AtAPY1 activity.Enzyme activities were determined in the presence of 3 mM UDP using the discontinuous apyrase activity assay. The AtAPY1 activity (1 U = 1μmol Pi/min) was
measured in the presence of various inhibitors and the activity without inhibitor (-) was defined as 100%. The means + SD of duplicates from one assay are shown. Different letters above the columns indicate mean values that are significantly different from one other (one-way ANOVA and Tukey test; p<0.05). The data
are representative of four assays.
Finally, the inhibitory potential of a reducing agent was tested, because the cysteines C87
and C337, C292 and C342 and C397 and C420 (seeFig. 1) were predicted to form disulfide
bonds [54]. However, the reductant DTT (0.5 mM) had no effect on either AtAPY1 (Fig. 7) or
AtAPY1-GFP (S7 Fig.) activity.
In summary, AtAPY1 and AtAPY1-GFP responded alike to the substances tested. Only the rather non-specific inhibitors vanadate and to a smaller degree fluoride and azide
were effective.
AtAPY1-GFP has highest affinity for GDP
Previously, the nucleoside diphosphates GDP, IDP and UDP were identified as substrates for
AtAPY1-GFP [22]. To determine the order of preference, the initial reaction velocities were
monitored as a function of substrate concentration in a continuous reaction. This continuous assay involved the coupling of the Pi-producing AtAPY1-GFP with the Pi-converting enzyme
nucleoside phosphorylase (PNP). The final product AMM absorbs light of 360 nm [38].
In order to ensure that the coupling enzyme PNP never became rate limiting, the initial ve-locities of AtAPY1-GFP were recorded as a function of AtAPY1-GFP concentration. The reac-tion rates increased linearly with increasing amounts of AtAPY1-GFP (exemplarily shown for
the substrate GDP inS9 Fig.), demonstrating that the reaction conditions were sufficient.
Plotting the initial reaction velocities versus the substrate concentrations fit the
Michaelis-Menten model for all three substrates tested (Fig. 8A-C). The calculated Kmvalue was 59.7 ±
12.5μM for GDP, 74.4 ± 9.88μM for UDP and 166 ± 25.4μM for IDP (Table 2).
The hydrolysis activity was highest for UDP followed by an equally high activity for GDP
and IDP [22]. The order of affinities, however, turned out be GDP>UDP>>IDP, rendering
AtAPY1-GFP primarily a GDPase.
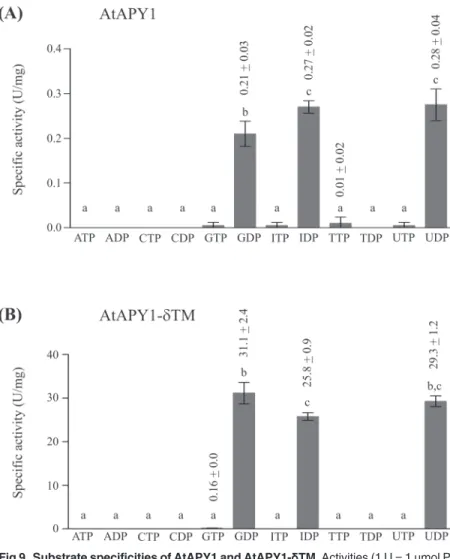
Substrate specificity
There is some debate if AtAPY1 has a second localization site in the cell wall where the enzyme would hydrolyze ATP, although it was shown that AtAPY1-GFP does not accept ATP as a
sub-strate [22]. One of the arguments that AtAPY1 might still degrade ATP was that the GFP-tag
might interfere with its native substrate specificity. Therefore, a substrate specificity analysis of
the GFP-tagless AtAPY1 was conducted. However, as shown inFig. 9A, only GDP, IDP and
UDP were hydrolyzed by AtAPY1, while ATP and other nucleotides were not.
Since AtAPY1 contains a N-terminal region which might serve as a secretory signal peptide
as shown for two mammalian homologs called NTPDase6 from man and rat [56,57], AtAPY1
might exist as a soluble protein as well. For the rat NTPDase6, the substrate specificity was the
same for both forms [57], but in the case of the human homolog, only the soluble form was a
diphosphatase, while the membrane-bound form hydrolyzed triphosphates as well [56].
To find out if the loss of the TM would also change the substrate specificity of AtAPY1, its soluble form was analyzed. However, the pattern of hydrolysable nucleotides remained the
same (Fig. 9B). So the substrate specificity of AtAPY1 with or without TM is limited to the
nu-cleotides GDP, IDP and UDP.
Activity stimulation by calmodulin
AtAPY1 carries a putative CBS (Fig. 1) and was previously found to bind calmodulin 2 fromA.
thaliana(AtCaM2) [20]. However, it had not been investigated yet, if CaM had any effect on AtAPY1 activity.
the biotinylation reaction was confirmed experimentally (S10 Fig.). AtAPY1-δTM was blotted
onto membrane and incubated with the biotinylated AtCaM2 (Fig. 10A). This AtAPY1 version
was chosen because relatively pure and large amounts of protein are needed for the
CaM-over-lay method. Cellulase andLegionella pneumophila(Lp) NTPDase1 were included as negative
controls, since neither protein contains a putative CBS. The CaM-binding protein-phosphatase
calcineurin served as the positive control. As CaM binds its target in a Ca2+-dependent
man-ner, the incubation was performed with two membranes in parallel, one in the presence of cal-cium and the other one without. In addition, the incubation buffer without calcal-cium contained the chelator EGTA. Binding of CaM to a target was visualized with a streptavidin-based assay.
Only AtAPY1-δTM and calcineurin produced signals and only in the presence of calcium,
demonstrating that AtAPY1-δTM bound CaM specifically. To ensure that the exposure time of
the EGTA-treated membrane was long enough, both membranes carried the same amount of a biotinylated control protein (= Snap-Biotin). The exposure times of the calcium- and EGTA-treated membrane were chosen so that the intensity of the Snap-Biotin signal from each was
comparable (S10 Fig.).
Next, activity assays were performed to see if CaM binding would evoke stimulation or re-pression of enzyme activity. All three AtAPY1 versions, GFP, AtAPY1 and
AtAPY1-δTM, were included. LpNTPDase1 served as the negative control which was not stimulated by
the addition of calmodulin (Fig. 10B,S11 Fig.). The activity of AtAPY1-GFP increased in the
presence of calmodulin, but the increase was not statistically significant (Fig. 10B,S11 Fig.).
Fig 8. Kmvalues of AtAPY1-GFP for GDP, UDP and IDP.Michaelis-Menten plots of the initial reaction
velocities (v) for different concentrations of substrate are shown. Different amounts of AtAPY1-GFP enzyme were used in (A), (B) and (C) as a result of different starting material. The enzyme velocities were determined by the continuous assay. For each substrate concentration, the mean velocity calculated from two parallel reactions was plotted. The initial velocities were linear over time for30 min. Each initial velocity was determined from a minimum of 24 data points from this linear phase. The error bars represent the standard deviations of the velocity means. The data set is representative of six (A, B) and three experiments (C), respectively.
doi:10.1371/journal.pone.0115832.g008
Table 2. Kmvalues.
Km(μM) substrate
59.7±12.5 GDP1
74.4±9.88 UDP2
166±25.4 IDP3
The mean Kmvalues are listed±SD. The Kmvalues for GDP, UDP and IDP were all significantly different
from each other (p<0.0001; one-way ANOVA test and Tukey test).
1The mean of the K
mvalue was calculated from six separate experiments. The means were not statistically
different from each other (p<0.001; one-way ANOVA). AtAPY1-GFP purified from three different protein
extracts (biological repeats) was analyzed. One, two and three separate experiments were run with each protein extract, respectively.
2The mean of the K
mvalue was calculated from six separate experiments. The means were not statistically
different from each other (p<0.001; one-way ANOVA). AtAPY1-GFP purified from two different protein
extracts (biological repeat) was analyzed. Two and four separate experiments were run with each protein extract, respectively.
3The mean of the K
mvalue was calculated from three separate experiments. The means were not
statistically different from each other (p<0.01; one-way ANOVA). AtAPY1-GFP purified from two different
protein extracts (biological repeat) was analyzed resulting in one technical and one biological repeat.
This result was unexpected, because AtAPY1 can bind CaM in vitro. Obviously, AtAPY1-GFP cannot, whether due to interference from the GFP-tag or from the tethering to the plate well bottom or due to some other reason was not further investigated in this study. AtAPY1 and
AtAPY1-δTM, however, were stimulated by calmodulin, both about 5-fold (Fig. 10B),
com-pared with the activity in the presence of calcium alone (S11 Fig.). The stimulation by CaM
was in the same range as documented previously for a pea NTPDase [33] and confirmed here
(S12 Fig.). These findings show that both the membranous and soluble AtAPY1 are amenable to regulation by CaM.
The CaM-stimulation kinetics in the presence of calcium were analyzed in more detail using
the purified AtAPY1-δTM protein and various concentrations of CaM from 0.1–1μM
(Fig. 10C). The CaM-activation curve shows that small changes in the concentration of CaM led to a big increase in enzyme activity. This observed positive co-operativity opens the
possi-bility of an efficient regulation of AtAPY1-δTM by CaM in vivo.
Whether the CaM regulation is physiologically relevant, however, cannot be answered by the biochemical data. A possible scenario of biological importance other than the impact on
Fig 9. Substrate specificities of AtAPY1 and AtAPY1-δTM.Activities (1 U = 1μmol Pi/min) of AtAPY1 (A)
and AtAPY1-δTM (B) were determined in the presence of various substrates (3 mM each) using the discontinuous apyrase activity assay. The means + SD of duplicates from one assay are shown. Different letters above the columns indicate mean values that are significantly different from one other (one-way ANOVA and Tukey test; p<0.05). Each data set is representative of three independent activity assays.
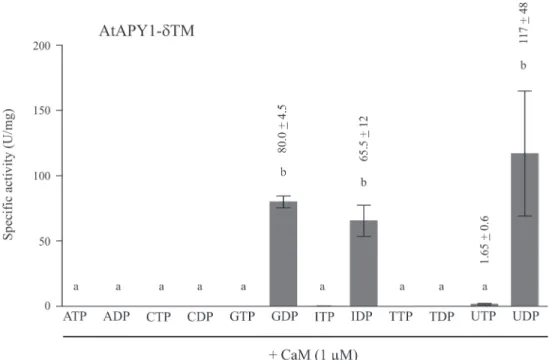
enzyme activity would be a change in substrate specificity. CaM is primarily regarded a
cytosol-ic protein, but it also occurs in other compartments, e. g. the extracellular space [67]. Therefore,
if AtAPY1 were indeed secreted in planta, CaM would be available to modify its substrate spec-ificity, for example to hydrolyze ATP or ADP. To test this hypothetical scenario, the substrate
specificity of AtAPY1-δTM was assayed in the presence of calcium and calmodulin (Fig. 11).
Twelve different nucleotides were investigated, but GDP, IDP and UDP remained the only hydrolysable substrates.
Structural model of the ecto-domain
A three-dimensional putative structural model of the AtAPY1 catalytic domain was generated,
using the ecto-domain structure of rat NTPDase2 (RnNTPDase2) as a template [40]. The
re-sulting model contains residues K68 to P471 of AtAPY1 (Fig. 1) which covers the sequence of
AtAPY1-δTM except for the first and terminal proline (P67, P471). In spite of only 23%
se-quence identity, a strong conservation of the catalytic residues that line the active site cleft
be-tween the two lobes of the protein is evident (Fig. 12). The model shows that the putative CBS
is easily accessible for Ca2+-activated CaM. Similarly, the sole potential N-glycosylation site at
N333 is well solvent-exposed and therefore likely to become glycosylated. The model further
confirms that three cysteine bridges are formed as predicted by the DiANNA web server [54],
however, the model’s prediction of the bonds is different: C292-C322, C337-C342, and
C397-C420. Furthermore, the cysteine residue at position 87 is likely to exist as a free sulfhydryl ac-cording to the model.
Fig. 12gives an explanation for the strong inhibitory effect of vanadate found experimental-ly (Fig. 7,S7 Fig.). Vanadate and other phosphate mimics such as sulfate, ortho-molybdate and ortho-tungstate can bind to the substrate's terminal phosphate binding site in the active site
cleft between the two lobes of the protein [34,45]. In addition, the flexible bond lengths and
ge-ometry of vanadate allow it to adopt gege-ometry reminiscent of the transition state, hence further increasing its competitive inhibitory effect.
Our kinetic analyses showed that AtAPY1-GFP had the highest affinity towards GDP (Fig. 8,Table 2). Therefore, an approximate binding mode for the substrate GDP was modeled (Fig. 12). The position and geometry of GDP is based on complex structures of RnNTPDase2
with the ADP analog and the GTP analog GMPPNP [34,41,45]. Due to the low sequence
con-servation in the nucleoside binding region, the predictive power is limited and no substrate docking was performed. Nevertheless, F366 and N415 are strong candidates for base sandwich binding. Y418 most certainly corresponds to Y398 of RnNTPDase2 and Y350 of LpNTPDase1
Fig 10. Stimulation of AtAPY1 activity by CaM.(A) Similar amounts (~ 150 ng) of the specified proteins were loaded per lane of a 12% SDS gel, separated by PAGE and subsequently either silver-stained or blotted onto a membrane for a CaM overlay in the presence of either calcium or EGTA. For each of the three applications, all samples were processed in parallel and identical volumes of the same protein sample were loaded. Biotinylated CaM bound by the proteins was detected via chemiluminescence after incubation with alkaline phosphatase coupled to streptavidin. The exposure time for the detection of CaM binding on the Ca2+-treated membrane was 1 s versus 60 s for the EGTA-treated membrane based on normalization via a positive control shown inS10 Fig.The results are representative of three independent CaM overlays. (B) The specific activities were determined by the discontinuous assay in the presence of 1 mM CaCl2and 3 mM ADP
(LpNTPDase1) or 3 mM UDP (AtAPY1-GFP, AtAPY1, AtAPY1-δTM) and compared with the activities under the same conditions, except for the addition of 0.8μM CaM (LpNTPDase1) or 1.0μM CaM (AtAPY1-GFP, AtAPY1, AtAPY1-δTM). Error bars represent the standard deviations of the means in fold activity change by the presence of CaM from two independent activity assays. (C) The specific activity of AtAPY1-δTM was determined by the discontinuous assay in the presence of 3 mM UDP, 1 mM CaCl2and rising concentrations
of CaM as indicated. The data were fit to the Hill equation. The means + SD of duplicates from one assay are shown. The result is representative of two independent assays. 1 U = 1μmol Pi/min.
which are involved in in-plane base binding [40,41]. However, whereas in RnNTPDase2 and LpNTPDase1 the tyrosine is directly adjacent to the second one of the two canonical disulfide bridges, it is shifted one residue position in AtAPY1 (a leucine is inserted). It is tempting to speculate that this shift is linked to the high nucleoside diphosphate specificity and/or base specificity.
Discussion
Plant Golgi E-NTPDases
Among the family of E-NTPDases, the focus of biochemical characterization has been on ex-tracellular E-NTPDases, mainly from mammalian species. Fewer Golgi apyrases have been characterized biochemically so far, and only two of them were from plants: A 50-kDa apyrase
from sycamore (Acer pseudoplatanus) [68] and an IDPase from rice (Oryza sativa) [69]. The
corresponding protein or gene sequences of these two Golgi apyrases, however, were not iden-tified, but their substrate specificity and the stimulation of their activity by a wide range of diva-lent ions make them likely members of the E-NTPDase family. Nevertheless, AtAPY1 is the first plant Golgi apyrase, for which enzymatic properties were unequivocally linked to a protein with known sequence.
Comparison of the enzymatic properties of AtAPY1, AtAPY1-δTM and
AtAPY1-GFP
The enzymatic properties of the three AtAPY1 variants were very similar, if not identical. This is not self-evident considering that a larger region was either removed, in the case of
AtAPY1-δTM, or added, in the form of a GFP-tag. Except for the response to Zn2+and CaM, the
Fig 11. Substrate specificity of AtAPY1-δTM in the presence of CaM.Activities (1 U = 1μmol Pi/min) of
AtAPY1-δTM were determined in the presence of various substrates (3 mM each) and 1μM CaM using the discontinuous apyrase activity assay. The means + SD of three independent assays are shown. Different letters above the columns indicate mean values that are significantly different from one other (one-way ANOVA and Tukey test; p<0.05).
biochemical analysis of AtAPY1-GFP indicated that the tag was not changing the properties of
AtAPY1 in agreement with previous genetic complementation experiments [22]. The finding
that AtAPY1-GFP represents most of the enzymatic properties of the native enzyme could make the GFP-multiTrap system a useful tool to efficiently screen for inhibitors and activators.
Substrate specificity of Golgi E-NTPDases
Regarding substrate specificity, there are clear differences between Golgi E-NTPDases with a TM near the N-terminus (= N-anchored) or the C-terminus (= C-anchored). AtAPY1 belongs to the N-anchored Golgi apyrases, and the complete alignment of all eight confirmed members
across species is shown inFig. 13. While all C-anchored E-NTPDases hydrolyze ADP or ATP
[12,14,15,70,71], all N-anchored NTPDases do not [14,22,72,73]. The substrate specificity
of AtAPY1 presented here fits this classification.
To identify obvious sequence differences which may explain the different substrate spectra
between these two classes, their consensus sequences were compared (Fig. 13). The amino
acids proposed responsible for GDP binding in AtAPY1 are residues F366, N415 and Y418
Fig 12. Putative three-dimensional structural model of the AtAPY1 ecto-domain.The structural model was colored using the ConSurf server [83] and 300 random NTPDase sequences sharing between 20 and 80% sequence identity. The N-terminal (NT) and C-terminal (CT) residue are marked. Three conserved cysteine bridges are predicted for the C-terminal lobe, while the non-conserved C87 is likely to be free. A single acetyl glucosamine group is drawn to indicate the solvent-exposed position of the single potential N-glycosylation site N333 in the back. Next to the active site Mg2+ion (gray sphere) a vanadate ion is shown in
the active site to highlight its likely competitive inhibition mechanism. The putative CaM-binding site (CBS)
169VRELLKGRSRLK180is depicted as red sticks. An approximate binding mode for GDP is shown in half
transparency. F366 and N415 are strong candidates for base sandwich binding. Y418 might be involved in base binding as well but would have to adopt a different side chain conformation than that assigned by the MODELLER program [48].
(Fig. 12). Strikingly, strong differences between the two consensus sequences occur near these amino acids. C-anchored E-NTPDases exhibit an insertion of several highly conserved amino acids (= C-anchored Golgi E-NTPDase conserved motif) before F366 of AtAPY1. In addition, the C-anchored E-NTPDases also differ greatly with the N-anchored consensus sequence shortly after the Y418 of AtAPY1. These sequence differences may serve as starting points to study the differences in substrate specificity.
Stimulation of AtAPY1 activity by CaM
The finding that AtAPY1 activity was enhanced by CaM suggests that this is a regulatory mode of this enzyme with physiological implications. However, so far no other Golgi-resident
CaM-binding proteins have been identified. In animals, theδ2 isoform of the CaM-dependent kinase
II is often ambiguously referred to as a Golgi enzyme, but it was localized at the Golgi and not
inside [74]. Regarding CaM, none of the various isoforms have been localized in the Golgi
ei-ther. However, not all CaM isoforms and CaM-binding proteins have been localized so far. There is one known Arabidopsis CaM-binding protein in the ER, a subunit of the
ER-resi-dent glucosidase II, which was iER-resi-dentified as a CaM-binding protein [75]. From this it can be
in-ferred that CaM exists in the ER and from this, in turn, it can be imagined that CaM exists in its closely associated compartment, the Golgi, as well.
So far, only one other plant NTPDase has been demonstrated to be stimulated by CaM [33]
raising the possibility that this regulatory feature might be plant-specific. However, it could also be that the possible regulation of NTPDases by CaM is scarcely documented, because it has been simply overlooked as an option. The bioinformatics analysis at least predicts CBS in
other Golgi E-NTPDases from other species (Fig. 13) warranting experimental exploration.
AtAPY1 and purinergic signaling
The discovery that eATP elicits a spike in cytosolic Ca2+concentration in plants [76,77],
sparked research efforts to unravel the underlying signaling pathway. AtAPY1 and AtAPY2
emerged as the prime candidates for the NTPDase activity breaking down eATP [27]. Genetic
evidence was provided by transgenic Arabidopsis lines overexpressingAtAPY2. Application of
ATP on leaves of WT and the overexpressing plants effected the accumulation of superoxide in both genotypes with the difference, however, that the accumulation was much less in the
over-expressors [78]. This result implied that the overexpression ofAtAPY2lowered the
concentra-tion of eATP. To test this, a poorly hydrolysable ATP analog was applied, and indeed the
difference in superoxide production between the two genotypes disappeared [78]. These
exper-iments dealt with AtAPY2, but since previous genetic complementation had shown that AtAPY1was functionally redundant withAtAPY2[25,26], AtAPY1 was linked to purinergic Q9SPM5], GS50 fromGlycine soja(G. s) [UniProtKB: Q9FVC3], NTPDase6 fromRattus norvegicus(R. n.) [UniProtKB: Q9ER3], GDA1 fromKluyveromyces lactis(K. l.) [UniProtKB: Q9HEM6], GDA1 fromSaccharomyces cerevisiae(S. c.) [UniProtKB: P32621], GDA1 fromSchizosaccharomyces pombe(S. p.) [UniProtKB: Q9UT35] and GDA1 fromCandida albicans(C. a.) [UniProtKB: Q8TGH6]. The sequences (without the N-terminal regions) are presented in descending order of identity to AtAPY1: AtAPY1 and AtAPY2 share the highest (87% identity) and AtAPY1 and C. a. GDA1 the lowest identity (24%). Their consensus is presented as“N-anchored”. The ACRs are boxed. Highly conserved cysteines are highlighted in yellow. The candidate amino acids for substrate binding in AtAPY1 (seeFig. 12) are labeled with red asterisks. Differences between the NTPDase6 and the other seven N-anchored Golgi E-NTPDases are shown in blue and highlighted in gray, respectively. A putative CBS is circled in green. The“C-anchored”consensus from all known Golgi E-NTPDase sequences which contain one TM near the C-terminus (= C-anchored) was generated separately: NTP-1 fromC.elegans(C. e.) [UniProtKB: Q18411], S. p. YND1 [UniProtKB: Q9USP2], S. c. YND1 [UniProtKB: P40009] and K. l. YND1 [UniProtKB: Q70KY5]. For the extraction of the consensus sequences, the sequences of the regions from ACR I to ACR V were evaluated, omitting the respective N- and C-terminal parts with the TMs from the analysis. Amino acids present in all members of the N- and/or C-anchored class are in black. If the amino acids are exclusively present in all members of one class, they appear in orange or red, respectively. The 8-aa region marked CGM (C-anchored Golgi NTPDase conserved motif) is unique to C-anchored Golgi E-NTPDases.

![Fig 12. Putative three-dimensional structural model of the AtAPY1 ecto-domain. The structural model was colored using the ConSurf server [83] and 300 random NTPDase sequences sharing between 20 and 80% sequence identity](https://thumb-eu.123doks.com/thumbv2/123dok_br/16412008.194512/24.918.305.741.117.550/putative-dimensional-structural-structural-ntpdase-sequences-sequence-identity.webp)
