ACPD
12, 19683–19713, 2012Coal-fired power-plant SO2 and
NOx control
technologies
C. R. Lonsdale et al.
Title Page
Abstract Introduction
Conclusions References
Tables Figures
◭ ◮
◭ ◮
Back Close
Full Screen / Esc
Printer-friendly Version
Interactive Discussion
Discussion
P
a
per
|
Dis
cussion
P
a
per
|
Discussion
P
a
per
|
Discussio
n
P
a
per
Atmos. Chem. Phys. Discuss., 12, 19683–19713, 2012 www.atmos-chem-phys-discuss.net/12/19683/2012/ doi:10.5194/acpd-12-19683-2012
© Author(s) 2012. CC Attribution 3.0 License.
Atmospheric Chemistry and Physics Discussions
This discussion paper is/has been under review for the journal Atmospheric Chemistry and Physics (ACP). Please refer to the corresponding final paper in ACP if available.
The e
ff
ect of coal-fired power-plant SO
2
and NO
x
control technologies on aerosol
nucleation in the source plumes
C. R. Lonsdale1, R. G. Stevens1, C. A. Brock2, P. A. Makar3, E. M. Knipping4, and J. R. Pierce1
1
Department of Physics and Atmospheric Science, Dalhousie University, Halifax, Canada
2
NOAA Earth System Research Laboratory, Boulder, CO, USA
3
Environment Canada, Downsview, Toronto, Canada
4
Electric Power Research Institute, Palo Alto, CA, USA
Received: 17 July 2012 – Accepted: 30 July 2012 – Published: 7 August 2012
Correspondence to: J. R. Pierce ([email protected])
ACPD
12, 19683–19713, 2012Coal-fired power-plant SO2 and
NOx control
technologies
C. R. Lonsdale et al.
Title Page
Abstract Introduction
Conclusions References
Tables Figures
◭ ◮
◭ ◮
Back Close
Full Screen / Esc
Printer-friendly Version
Interactive Discussion
Discussion
P
a
per
|
Dis
cussion
P
a
per
|
Discussion
P
a
per
|
Discussio
n
P
a
per
|
Abstract
Nucleation in coal-fired power-plant plumes can greatly contribute to particle number concentrations near source regions. The changing emissions rates of SO2 and NOx
due to pollution-control technologies over recent decades may have had a significant effect on aerosol formation and growth in the plumes, with ultimate implications for
5
climate and human health. We use the System for Atmospheric Modeling (SAM) large-eddy simulation model with the TwO-Moment Aerosol Sectional (TOMAS) microphysics algorithm to model the nucleation in plumes of coal-fired plants. We test a range of cases with varying emissions to simulate the implementation of emissions-control tech-nologies between 1997 and 2010. For the W.A. Parish power plant (near Houston, TX)
10
during this time period, NOxemissions were reduced by ∼90 %, while SO2 emissions
decreased by∼30 %. Increases in plume OH (due to the reduced NOx) produced
en-hanced SO2oxidation and particle nucleation despite the reduction in SO2emissions.
These results suggest that NOx emissions may strongly regulate particle nucleation and growth in power-plant plumes. Comparison of model results with airborne
mea-15
surements made in the W.A. Parish power-plant plume in 2000 and 2006 confirm the importance of NOx emissions on new particle formation, yet also highlight the sub-stantial effect of background aerosol loadings on this process. A wide range of NOx
and SO2emissions were modeled to understand how they affect particle formation in
the plume. Particle formation generally increases with SO2emission, while NOxshows
20
two different regimes: increasing particle formation with increasing NOxunder low-NOx
emissions and decreasing particle formation with increasing NOxunder high-NOx
emis-sions. Finally, we calculate emissions statistics of 330 coal-fired power plants in the US in 1997 and 2010, and the model results show a median decrease of 19 % in particle formation ratesfrom 1997 to 2010 (whereas the W.A. Parish case study showed an
25
ex-ACPD
12, 19683–19713, 2012Coal-fired power-plant SO2 and
NOx control
technologies
C. R. Lonsdale et al.
Title Page
Abstract Introduction
Conclusions References
Tables Figures
◭ ◮
◭ ◮
Back Close
Full Screen / Esc
Printer-friendly Version
Interactive Discussion
Discussion
P
a
per
|
Dis
cussion
P
a
per
|
Discussion
P
a
per
|
Discussio
n
P
a
per
tensive plume measurements for a range of emissions of SO2and NOxand in varying background aerosol conditions are needed to better quantify these effects.
1 Introduction
Anthropogenic aerosols affect human health and the Earth’s climate. High aerosol con-centrations are known to cause human health problems such as respiratory and
car-5
diovascular diseases, intensification of asthma, a reduction in physical abilities and an increase in mortality rates (Arya, 1999; Stieb et al., 2002; Peng et al., 2004). Aerosols affect the Earth’s radiative properties. The direct effect of aerosols on climate is due to their ability to scatter and absorb incoming solar radiation (Charleson et al., 1992). The indirect effect of aerosols on climate is the change in the radiative properties of
10
clouds from the altering of cloud droplet/crystal size and concentration and potentially precipitation rates by changes in the number of aerosols acting as Cloud Condensa-tion Nuclei (CCN) (Twomey, 1974; Albrecht, 1989). Both the direct and indirect effects of aerosols have large uncertainties associated with them, partly due to uncertainties in primary anthropogenic aerosols and the nucleation of ultrafine aerosols that are
ini-15
tially too small to act as CCN (IPCC 2007; Spracklen et al., 2008; Makkonen et al., 2009; Pierce and Adams, 2009a; Wang and Penner, 2009).
Measurements of high concentrations of ultrafine particles have been found in the plumes of coal-fired power plants despite the reduction of emissions from installed pollution-control technology (Junkermann et al., 2011a,b). Junkermann et al. (2011b)
20
compared the aerosol size distributions measured in plumes from modern power plants with pollution controls to those from older plants without controls. They found the mod-ern plants to have significantly more ultrafine particles (and total particle number) than the older plants. Their hypothesis as to the source of these ultrafine aerosols is ex-plained by in-stack formation from pollution-control technology byproducts (Srivastava
25
ACPD
12, 19683–19713, 2012Coal-fired power-plant SO2 and
NOx control
technologies
C. R. Lonsdale et al.
Title Page
Abstract Introduction
Conclusions References
Tables Figures
◭ ◮
◭ ◮
Back Close
Full Screen / Esc
Printer-friendly Version
Interactive Discussion
Discussion
P
a
per
|
Dis
cussion
P
a
per
|
Discussion
P
a
per
|
Discussio
n
P
a
per
|
2009a; Konwar et al., 2010; Junkermann et al., 2011a, b). Junkermann et al. (2011b) describes how the shift to cleaner power plants may lead to more CCN that can impact climate. Thus, it is important to understand the various processes that affect the net number of particles formed due to power plants that are affected by pollution-control technologies. Along with the in-stack formation of new particles, changes in plume
5
chemistry and microphysics due to the changes in SO2 and NOx emissions may also
affect the net number of particles contributed by a power plant. This latter effect of SO2
and NOxemissions changes has yet to be explored.
Recent pollution-control technologies installed on power plants remove sulfur dioxide (SO2) and nitrogen oxides (NOx=NO+NO2). SO2may be oxidized in the gas phase
10
via OH to form sulfuric acid (H2SO4) vapors that contribute to new-particle formation and growth (Kulmala and Kerminen, 2008). Thus, a reduction in SO2 alone would
re-sult in a reduction of particles formed in power-plant plumes. However, NOx controls
may either increase or decrease OH concentrations in the plume (depending on the environmental conditions). Thus, in many conditions a reduction in NOx may lead to
15
an increase in the rate at which H2SO4is formed and perhaps an increase in particle
formation/growth.
In this paper, we explore the effects of SO2 and NOx control technologies on
nu-cleation in the plumes of coal-fired power plants. In Section 2, we review the various chemical and microphysical processes affecting particle formation in plumes. In
Sec-20
tion 3, we provide an overview of power-plant control technologies. The methods and the SAM/TOMAS model are described in Sect. 4. Our results, including a detailed case study of the W.A. Parish power plant, a comparison to measurements and an assessment of particle-formation changes from US coal-fired power plants, are given in Sect. 5. In Sect. 6, we present the conclusions.
ACPD
12, 19683–19713, 2012Coal-fired power-plant SO2 and
NOx control
technologies
C. R. Lonsdale et al.
Title Page
Abstract Introduction
Conclusions References
Tables Figures
◭ ◮
◭ ◮
Back Close
Full Screen / Esc
Printer-friendly Version
Interactive Discussion
Discussion
P
a
per
|
Dis
cussion
P
a
per
|
Discussion
P
a
per
|
Discussio
n
P
a
per
2 Chemical processes in power-plant plumes
Coal-fired power plants are sources of SO2, NOx and primary ash particles (Zhao et
al., 2008; Srivastava et al., 2004). However, due to the high efficiency of particulate controls, primary ash emissions in modern coal-fired power plants in developed coun-tries are very low (Miller, 2010). A product of coal combustion is SO2, which is oxidized
5
in the gas phase by OH to form H2SO4 vapor under tropospheric conditions (Seinfeld and Pandis, 2006; Zhao et al., 2011). Under continental surface conditions, H2SO4
va-por will quickly (seconds to minutes) form either new∼1 nm aerosol particles (aerosol
nucleation) or condense onto pre-existing particles (Pierce and Adams, 2009b). In the presence of clouds, SO2 is dissolved into cloud or rain droplets and oxidized to
sul-10
fate (SO2−
4 ) by aqueous ozone (O3) or hydrogen peroxide (H2O2), which reduces the
H2SO4concentrations in the gas phase (Zhou et al., 2012). Since SO2is emitted from
power plants, H2SO4 vapor concentrations are elevated above background levels in plumes and thus power plants may be a major contributor to nucleated particles in the atmosphere under sunny and clear-sky conditions (Yu, 2010; Stevens et al., 2011).
15
The rate of gas-phase SO2 oxidation depends on the amount of available OH, which depends on the amount of incoming solar radiation, NOx concentrations and volatile
organic compound (VOCs) concentrations.
NOx is an indirect contributor to new-particle formation rate because it affects the amount of OH available for the SO2→H2SO4 gas-phase reaction (Poppe et al., 1992)
20
(Fig. 1). At high NOxconcentrations (>30 ppb), the reaction of OH with NO2becomes
a significant sink for OH, and OH concentrations are reduced with increasing NOx concentrations. For low NOxconcentrations (<0.5 ppb), the reaction of NO2with OH is
unimportant, and OH increases with increasing NOx (via photolysis of NO2, enhanced
O3formation and increased production of O( 1
D), in turn increasing the equilibrium level
25
ACPD
12, 19683–19713, 2012Coal-fired power-plant SO2 and
NOx control
technologies
C. R. Lonsdale et al.
Title Page
Abstract Introduction
Conclusions References
Tables Figures
◭ ◮
◭ ◮
Back Close
Full Screen / Esc
Printer-friendly Version
Interactive Discussion
Discussion
P
a
per
|
Dis
cussion
P
a
per
|
Discussion
P
a
per
|
Discussio
n
P
a
per
|
H2SO4 concentrations (and particle formation and growth rates) may subsequently increase or decrease in the plumes.
In addition to H2SO4production contributing to formation and growth (via
condensa-tion) rates in the atmosphere, the presence of pre-existing particles also determines if particles will form and survive in a source plume. Condensational growth and
coagu-5
lation rates depend on the concentration of pre-existing particles (Pierce and Adams, 2007). If a high condensation sink exists (due to a large amount of pre-existing aerosol surface area), H2SO4will condense quickly onto these pre-existing particles, which will
lower the H2SO4 concentrations and reduce new-particle formation and growth rates.
Additionally, freshly nucleated particles are lost through coagulation with the larger
10
pre-existing particles. Thus, large amounts of pre-existing aerosol will reduce the net number of particles formed in a plume both by reducing nucleation and condensa-tional growth rates and by increasing coagulation. Power-plant emissions in polluted-background regions likely generate fewer new particles than in clean regions (Stevens et al., 2012). Although not investigated in this paper, the emissions of primary ash
par-15
ticles by power plants without particulate controls could also provide a large amount of surface area and would also greatly reduce new-particle formation and growth. These primary ash particles may be important in developing countries where particulate con-trols are not implemented or for historical simulations of periods prior to when these controls were commonplace in developed countries (e.g. the United States before the
20
implementation of the Clean Air Act in 1970 (Miller, 2010)).
Finally, meteorological conditions affect nucleation and growth in the power-plant plumes (Stevens et al., 2012). Both wind and turbulence act to dilute the SO2 and NOxemissions from the power plant and thus particle formation. Increased relative
hu-midity will increase the size of hygroscopic aerosols thereby increasing condensation
25
for-ACPD
12, 19683–19713, 2012Coal-fired power-plant SO2 and
NOx control
technologies
C. R. Lonsdale et al.
Title Page
Abstract Introduction
Conclusions References
Tables Figures
◭ ◮
◭ ◮
Back Close
Full Screen / Esc
Printer-friendly Version
Interactive Discussion
Discussion
P
a
per
|
Dis
cussion
P
a
per
|
Discussion
P
a
per
|
Discussio
n
P
a
per
mation and increases the size of the pre-existing particles, which reduces new-particle formation.
3 Clean control technologies in coal-fired power plants
To reduce the anthropogenic impact on the environment by coal-fired power plants, specifically acid rain, PM and tropospheric ozone concentrations (Seinfeld and
Pan-5
dis, 2006), pollution-control technologies have been implemented to reduce primary-particle, SO2 and NOx emissions (EPRI, 2008). There are numerous techniques for controlling emissions, and we will review the most common techniques here. For a more extensive discussion of pollution-control strategies, please refer to Srivastava et al. (2004) and Miller (2010).
10
Technologies to reduce the amount of primary particles emitted from source stacks are currently the most effective of the pollution-control technologies. Nearly all power plants in the US and Canada use baghouse filters or electrostatic precipitators (ESP) with removal efficiencies up to 99.9 %. Baghouse filters contain fibrous materials that catch large particles (diameters >1 µm) by inertial and direct impaction and smaller
15
particles by diffusion (Miller, 2010). ESP involves the charging of the ash particles by corona discharge followed by removal of these charged aerosols by an electric field (Miller, 2010). Because of such high removal efficiencies, emissions rates of primary particles are not included in the EPA’s Clean Air Market Database.
Many power plants have switched to burning coal with low sulfur contents to allow
20
for SO2emissions reductions without the need to implement new control systems.
An-other technique to reduce SO2 emissions includes flue gas desulfurization (FGD, e.g.
scrubbers). Different classifications of FGD include wet and dry methods, expressing the production of waste in the form of a wet slurry or dry material, respectively. A dis-advantage of FGD includes the sometimes-inefficient removal of sulfur trioxide (SO3)
25
ACPD
12, 19683–19713, 2012Coal-fired power-plant SO2 and
NOx control
technologies
C. R. Lonsdale et al.
Title Page
Abstract Introduction
Conclusions References
Tables Figures
◭ ◮
◭ ◮
Back Close
Full Screen / Esc
Printer-friendly Version
Interactive Discussion
Discussion
P
a
per
|
Dis
cussion
P
a
per
|
Discussion
P
a
per
|
Discussio
n
P
a
per
|
may lead to particle formation in the stack (Junkermann et al., 2011b; Srivastava et al., 2004). However, this particle-formation pathway will not be considered in this paper.
Most coal-burning power plants now contain NOx controls in the form of Low NOx
Burner Technology (LNBT), the over-fire air technique, or a combination of both. Both of these techniques aim to create combustion conditions that reduce the amount of N2
5
(from air) oxidized to NO and generally have an efficiency up to 40–60 % (relative to uncontrolled emissions). An additional technology, selective catalytic reduction (SCR), has more recently been added, often in combination with LNBT or over-fire air, to many plants to increase removal efficiencies (>90 % NOx reductions). SCR involves a
cata-lyst and the addition of a reagent, ammonia (NH3), that promotes the reduction of NOx
10
to nitrogen and water. A negative attribute of SCR includes an SO3by-product that will quickly form H2SO4(Miller, 2010). Thus, similar to FGD, SCR may also lead to particle
formation in the power-plant stack (Srivastava et al., 2004; EPRI, 2008). Another dis-advantage of SCR is that NH3may not react completely with NOxand may be emitted to the atmosphere (EPRI, 2008; Wang et al., 2012). This process is called ammonia
15
slip and can be somewhat controlled with careful tuning of the SCR system and regular maintenance of the catalysts (Miller, 2010; Gong et al., 2012). Since NH3is potentially an important enhancer of aerosol nucleation rates (Merikanto et al., 2007; Kirkby et al., 2011), this too may affect particle formation. This influence on particle formation is not explored in this paper, but was explored in Gong et al. (2012). Gaseous ammonia may
20
also condense directly onto acidic aerosols (Seinfeld and Pandis, 2006), increasing aerosol mass and size, hence influencing subsequent condensation and coagulation rates.
4 Methods
We use the SAM/TOMAS model to explore the dynamics and aerosol microphysics
(nu-25
Sim-ACPD
12, 19683–19713, 2012Coal-fired power-plant SO2 and
NOx control
technologies
C. R. Lonsdale et al.
Title Page
Abstract Introduction
Conclusions References
Tables Figures
◭ ◮
◭ ◮
Back Close
Full Screen / Esc
Printer-friendly Version
Interactive Discussion
Discussion
P
a
per
|
Dis
cussion
P
a
per
|
Discussion
P
a
per
|
Discussio
n
P
a
per
ulation (LES) and Cloud Resolving Model (CRM) (Khairoutdinov and Randall, 2003). Stevens et al (2012) evaluated the model’s ability to predict nucleation and growth in the sulfur plumes of anthropogenic point sources through testing of several nucleation schemes and varying background conditions. With comparisons to aircraft measure-ments in two power-plant plumes, the model provided reasonable predictions of
in-5
plume particle number concentration and size at distances 20-100km downwind of the source. In this paper, we use grid-box sizes that are 400 m×400 m horizontal
resolu-tion and two different vertical resolutions of 40 m and 80 m (depending on the boundary layer height). The simulations contain the gas-phases species of SO2, H2SO4, NOxand
NH3. OH concentrations are parametrized based on NOxconcentrations, incoming
so-10
lar radiation and an assumed concentration of reactive VOCs (Stevens et al., 2012). The number and mass of sulfate aerosol, ammonium and water are tracked in 15 size sections spanning 3 nm to 10 µm using the TOMAS microphysics scheme (Adams and Seinfeld, 2002; Pierce and Adams, 2009a). Power-plant emissions of SO2 and NOx are obtained from the Clean Air Market emissions inventory (Clean Air Markets – Data
15
and Maps, 2012). Primary-particle emissions are assumed to be negligible in model simulations. Emissions are assumed to be well-mixed in the emissions grid-box. Other inputs to the model include background SO2, NOx, NH3and aerosol size distributions
acquired from Texas Air Quality Studies (TexAQS) field campaigns near Houston, Texas during 2000 and 2006. The large-scale meteorological forcing of the SAM simulations
20
are provided by vertical profiles of mean winds, temperature, relative humidity and surface sensible heat, latent heat and momentum fluxes from the National Center for Environmental Prediction (NCEP) North American Regional Reanalysis (NARR) data (Mesinger et al., 2006). The reanalysis data were provided by the National Oceanic and Atmospheric Administration (NOAA)/Outstanding Accomplishments in Research
25
ACPD
12, 19683–19713, 2012Coal-fired power-plant SO2 and
NOx control
technologies
C. R. Lonsdale et al.
Title Page
Abstract Introduction
Conclusions References
Tables Figures
◭ ◮
◭ ◮
Back Close
Full Screen / Esc
Printer-friendly Version
Interactive Discussion
Discussion
P
a
per
|
Dis
cussion
P
a
per
|
Discussion
P
a
per
|
Discussio
n
P
a
per
|
nucleation schemes were tested in Stevens et al. (2012), and the activation scheme compared best against observations from the TexAQS2006 field campaign.
In these simulations, we do not consider the oxidation of SO2 within clouds (the
meteorology on the tested days contained cloud-free or nearly cloud-free boundary layers). Also, we do not consider the loss of NOxby chemical reactions. The direct effect
5
of the NO2+OH reaction on OH is implicit in the OH parameterization; however, this
does not result in the reduction of NOx concentrations. Early in the plume, the mixing of the plume with background air will dominate the reduction of NOXconcentrations in the plume, so the chemical loss of NOxis less important than later in the plume. NOx
lifetime in high [OH] conditions is only a few hours during the day, with the summertime
10
lifetimes being shorter as compared to winter (Beirle et al., 2011). Thus, we expect to over-predict NOx concentrations with increasing distances from the source. VOC
concentrations were assumed fixed in the OH parameterization in our simulations (150 pptv of isoprene). Changes in VOCs may affect OH concentrations resulting in different SO2 oxidation rates (Stevens et al., 2012). We also do not consider any primary ash
15
particles (which would result in a decrease in nucleation rates) or particles that may have formed in the stack because of high SO3 formation from FGD or SCR (which would increase the number of particles in the plumes (Junkermann et al., 2011b)). This formation of SO3 by the pollution control technologies is an additional way in which
pollution controls can lead to increased numbers of ultrafine particles. However, this
20
formation pathway is not explored in this paper.
5 Results
5.1 Changes in the W.A. Parish plume between 1997 and 2010
We have compared the model to observations (Stevens et al., 2012) and shown that it captures the essential features of aerosol size distributions in anthropogenic plumes. In
25
emis-ACPD
12, 19683–19713, 2012Coal-fired power-plant SO2 and
NOx control
technologies
C. R. Lonsdale et al.
Title Page
Abstract Introduction
Conclusions References
Tables Figures
◭ ◮
◭ ◮
Back Close
Full Screen / Esc
Printer-friendly Version
Interactive Discussion
Discussion
P
a
per
|
Dis
cussion
P
a
per
|
Discussion
P
a
per
|
Discussio
n
P
a
per
sions rates due to pollution-controls from the W.A Parish coal-fired power-generation facility between 1997 and 2010.
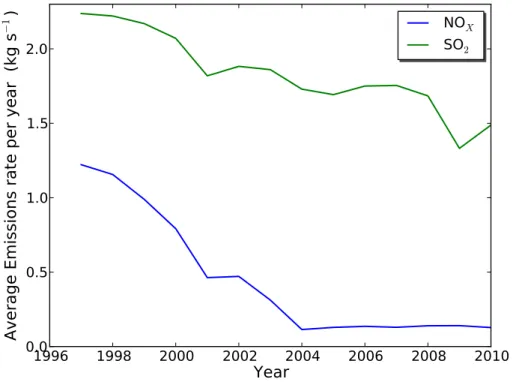
The annually averaged SO2 and NOx emissions from the W.A. Parish power plant
from 1997 to 2010 are shown in Fig. 2. In 1997, four of the eight total units were coal-fired sources (units 5, 6, 7 and 8). All four of these units contained particle controls in
5
the form of baghouse filters. NOx controls were installed on unit 5 (LNBT) and unit 8
(over-fire air) prior to 1997. There is no record of NOxcontrols on units 6 and 7 in 1997.
By 2004, all units contained LNBT with either over-fire air or combinations with SCR, and by 2005 all units contained SCR. For SO2controls, only unit 8 is recorded to have
Wet Lime FGD for all years, and the other three units have no record of SO2 controls
10
for any years. From the Clean Air Markets database, we derived that in 1997 the av-erage NOx and SO2 emissions for the W.A. Parish power plant were 1.22 kg s−
1
and 2.24 kg s−1, respectively. In 2010, these emissions were reduced to 0.128 kg s−1 and 1.49 kg s−1for NO
xand SO2, respectively (Fig. 2). Even though changes in SO2control
implementations were not recorded, there is an indication of emissions reduction in the
15
database, and this may be due to reduced sulfur content in the coal. The emissions of both gaseous species decreased over the 13-yr period; however, NOxrates decreased by∼90 % while SO2only decreased by∼30 %.
To estimate how the emissions changes between 1997 and 2010 may have affected particle formation in the plume, we performed two simulations: one with the 1997
emis-20
sions and another with the 2010 emissions, each using meteorology and chemical background conditions from 27 September 2006 during the TexAQS2006 field cam-paign as tested in Stevens et al. (2012). This day had clear skies and a boundary-layer height of 1000 m. The mean boundary-layer winds were northward at 5 m s−1avoiding Houston, Texas with somewhat polluted remote-continental background aerosol
con-25
ACPD
12, 19683–19713, 2012Coal-fired power-plant SO2 and
NOx control
technologies
C. R. Lonsdale et al.
Title Page
Abstract Introduction
Conclusions References
Tables Figures
◭ ◮
◭ ◮
Back Close
Full Screen / Esc
Printer-friendly Version
Interactive Discussion
Discussion
P
a
per
|
Dis
cussion
P
a
per
|
Discussion
P
a
per
|
Discussio
n
P
a
per
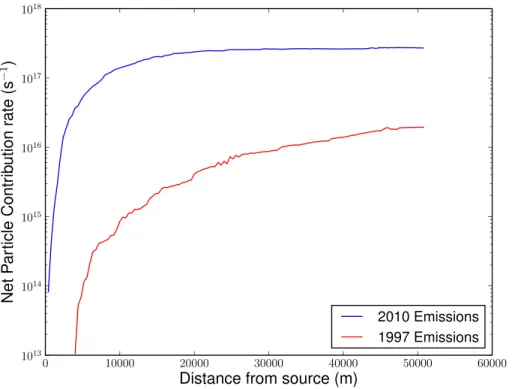
|
coagulation. The NPC rate is the effective emissions rate of particles from the power plant once chemistry and physics in the plume has been accounted for. It depends on the distance from the stack because both nucleation and coagulation shape the aerosol distribution as the plume moves further from the stack.
In Fig. 4, it can be seen that there is over an order of magnitude increase in the
5
predicted NPC rate between 1997 and 2010 (with background conditions fixed). This increase occurs even though SO2 emissions have decreased by 30 %. The increase is due to the large reduction of NOx emissions that has caused an increase in the
predicted OH in the plume. The OH and NOx changes for the corresponding years are
shown in Fig. 1. The predicted OH concentrations have increased by∼10×in the plume
10
between 1997 and 2010. Thus, SO2 is oxidized∼10×more quickly in 2010 leading to
larger H2SO4concentrations early in the plume even though SO2emissions rates were
reduced by∼30 %.
The predictions shown here are limited to a single set of background conditions. As we will show later (in Sect. 5.3), the sensitivity of the NPC rate to changes in emissions
15
depends greatly on the background conditions. In the limit of no or low sunlight (e.g. night) or high background particle concentrations, no nucleation will take place regard-less of emissions (Stevens et al., 2012), and the NPC rate will have no sensitivity to emissions (it will be zero).
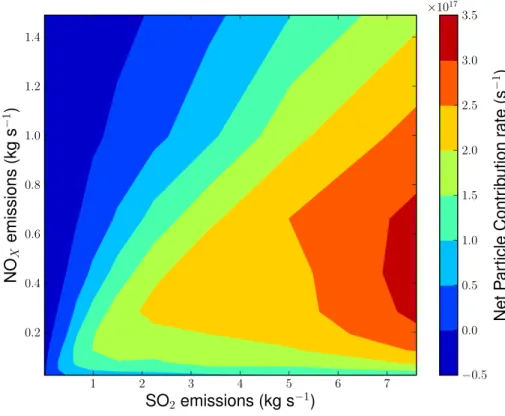
5.2 Net Particle Contribution rates versus SO2and NOx
20
To better understand how NPC rates depend on SO2and NOxemissions, Fig. 5 shows the NPC rates at 50 km downwind of a source stack against NOx emissions ranging
from 0–1.4 kg s−1and SO
2emissions ranging from 0–7.5 kg s− 1
(these ranges encom-pass most power plants in the US). Similar to Fig. 4, the background conditions are set to those for 27 September 2006 at the W.A. Parish power plant. 110 individual
25
SAM/TOMAS simulations are used to populate the figure. The NPC rate ranges from over 1017s−1in high-SO
2emissions cases to zero particles in very-low-SO2emissions
ACPD
12, 19683–19713, 2012Coal-fired power-plant SO2 and
NOx control
technologies
C. R. Lonsdale et al.
Title Page
Abstract Introduction
Conclusions References
Tables Figures
◭ ◮
◭ ◮
Back Close
Full Screen / Esc
Printer-friendly Version
Interactive Discussion
Discussion
P
a
per
|
Dis
cussion
P
a
per
|
Discussion
P
a
per
|
Discussio
n
P
a
per
be expected based on Fig. 1, increasing NOx emissions leads to an increase in the NPC rate if NOx emissions are low (OH increases with increasing NOx), and
increas-ing NOxemissions leads to a decrease in the NPC rate if NOxemissions are high (OH
decreases with increasing NOx). These results indicate that for power plants with high NOx emissions (>∼0.6 kg NOxs−1 according to Fig. 5), SO
2 concentrations must be
5
reduced by a larger fractional amount than NOx in order for the net particle production
in the plume to decrease. Similar to the previous section, these results are only for a single background. The magnitude of the predicted NPC rates will depend greatly on the background concentrations (Stevens et al., 2012), which will be shown in the following section.
10
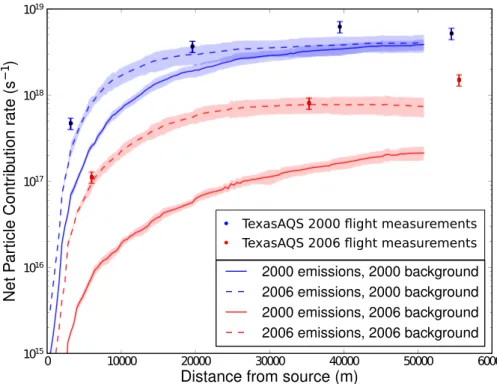
5.3 Observational evidence and comparison of model to measurements
Aircraft-based measurements of coal-fired power-plant plumes using the suite of in-struments required to set-up and test the model (e.g. SO2, NOx, fast aerosol size
distri-bution measurements) are quite sparse. To ideally identify the effect of pollution-control technologies from observations, many aircraft-based measurements of power-plant
15
plumes would be needed both before and after pollution controls were implemented. A large number of measurements would be required in order to average over day-to-day variability in background meteorology and aerosol concentrations. These before/after measurements are even more sparse, though we have found one set of measurements that we will analyze here.
20
The NCAR Electra aircraft and NOAA P-3 aircraft made transects through the W.A. Parish power plant in the TexAQS2000 and TexAQS2006 field campaigns, respectively. For each campaign, we have identified a measurement case where the power-plant plume was able to evolve with minimal additional anthropogenic emissions mixing into the plume (e.g. the plume must avoid the city of Houston). The TexAQS2000 flight
25
measurements were on 27 August 2000 and the TexAQS2006 measurements were on 27 September 2006 (described in Sect. 5.1). There were significant changes in NOx
ACPD
12, 19683–19713, 2012Coal-fired power-plant SO2 and
NOx control
technologies
C. R. Lonsdale et al.
Title Page
Abstract Introduction
Conclusions References
Tables Figures
◭ ◮
◭ ◮
Back Close
Full Screen / Esc
Printer-friendly Version
Interactive Discussion
Discussion
P
a
per
|
Dis
cussion
P
a
per
|
Discussion
P
a
per
|
Discussio
n
P
a
per
|
smaller between 2000 and 2006 than it is between 1997 and 2010 (as tested earlier), NOx emissions were still reduced by 83 % and SO2 emissions were reduced by 15 % between 2000 and 2006. The boundary layer height on 27 August 2000 was recorded to have a maximum of∼2000 m above the surface with northward winds ranging from
3–6 m s−1(Brock et al., 2003). Fair-weather boundary-layer cumulus clouds were
oc-5
casionally present on this day; however, during the time of flight, low-cloud coverage was less than 10 % according to the NCEP North American Regional Reanalysis. As mentioned earlier, in-cloud oxidation of SO2 was not included in the model; however, the reduction of downward short-wave radiative flux by the clouds was accounted for in the model inputs.
10
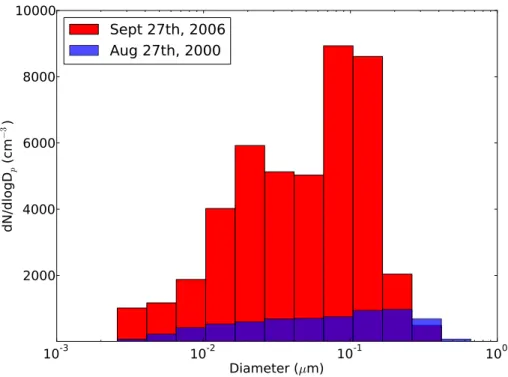
There was a large difference in the background aerosol size distributions between the campaign days as seen in Fig. 3. The condensation/coagulation sink of the back-ground aerosol for the 2000 case was only 0.25 of the 2006 case. Thus, we expect the differences in the condensation and coagulation sinks to have a significant effect on the NPC rates, so unfortunately the measured effect of the changes in power-plant
15
emissions between 2000 and 2006 cannot be isolated in the measurements alone. In this section, we will use the model as a means of interpreting the measured response to the emissions changes by isolating the emissions and background-aerosol changes. We present 4 simulations: one with 2000 background concentrations and meteorology with 2000 emissions, one with 2000 background concentrations and meteorology with
20
2006 emissions, one with 2006 background concentrations and meteorology with 2000 emissions, and one with 2006 background concentrations and meteorology with 2006 emissions.
Figure 6 shows the NPC rate for the four simulations and the measurements. The simulation with 2006 emissions and 2006 background matches the 2006
measure-25
ACPD
12, 19683–19713, 2012Coal-fired power-plant SO2 and
NOx control
technologies
C. R. Lonsdale et al.
Title Page
Abstract Introduction
Conclusions References
Tables Figures
◭ ◮
◭ ◮
Back Close
Full Screen / Esc
Printer-friendly Version
Interactive Discussion
Discussion
P
a
per
|
Dis
cussion
P
a
per
|
Discussion
P
a
per
|
Discussio
n
P
a
per
the difference between this simulation and the simulation with the 2000 emissions and 2000 background is small, particularly farther from the source.
The effect of the background aerosol concentrations on the simulated NPC rate in Fig. 6 was significant, consistent with Stevens et al. (2012). The difference between the clean 2000 background cases (blue) and the more-polluted 2006 background cases
5
(red) was about a factor of 10 or higher when the emissions were held fixed. Thus, the differences in background likely contributed significantly to the difference in the mea-sured NPC rates between 2000 and 2006. The model also showed that the difference between the 2000 and 2006 measurements would be even larger if the emissions were held fixed, particularly under the more polluted 2006 background conditions. Thus, if
10
the model-predicted dependence of the NPC rate on the background concentrations is correct, the change in the emissions between 2000 and 2006 resulted in an increase in NPC; however, the change in background between the 2000 and 2006 cases resulted in a decrease in NPC (that is larger in magnitude than the effect of the emissions change).
15
The model predicts that the sensitivity to changing emissions under fixed-background conditions is significantly larger during the more-polluted 2006 conditions (difference between the red lines) than during the less-polluted 2000 conditions (dif-ference between the blue lines). Under the cleaner 2000 background conditions, nu-cleation proceeds quickly in both emissions cases (although more quickly in the case
20
of 2006 emissions). The nucleation mode quickly becomes the dominant condensa-tion and coagulacondensa-tion sink (the pre-existing particles did not contribute greatly to these sinks). In the 2006 emissions case (with the 2000 background conditions), the con-densation and coagulation sink formed in the plume is somewhat larger than the 2000 emissions case (with the 2000 background conditions), and this provides a negative
25
ACPD
12, 19683–19713, 2012Coal-fired power-plant SO2 and
NOx control
technologies
C. R. Lonsdale et al.
Title Page
Abstract Introduction
Conclusions References
Tables Figures
◭ ◮
◭ ◮
Back Close
Full Screen / Esc
Printer-friendly Version
Interactive Discussion
Discussion
P
a
per
|
Dis
cussion
P
a
per
|
Discussion
P
a
per
|
Discussio
n
P
a
per
|
conditions, the pre-existing particles continue to be the dominant condensation and coagulation sink throughout the plume. Thus, the total condensation and coagulation sink did not depend greatly on the SO2 and NOx emissions. Unlike the 2000
back-ground conditions, there is no strong negative feedback in the 2006 backback-ground cases that reduce the new-particle formation rates and increase the coagulation rates for the
5
2006 emissions case, and this facilitates a large fractional difference in the NPC rate between the 2006 and 2000 emissions cases. Thus, as mentioned earlier, the sensitiv-ity of the NPC rate to emissions is strongly sensitive to the background conditions.
This sensitivity to background conditions is particularly important because power plants may correlate (or anti-correlate) with highly polluted regions. For example, the
10
power plants in the Ohio River Valley will exist in generally polluted air. Thus, future work will be done using 3-D chemical transport models to explore these correlation effects.
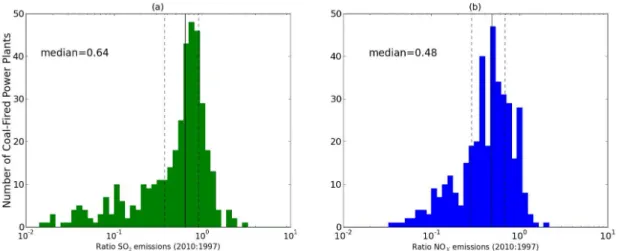
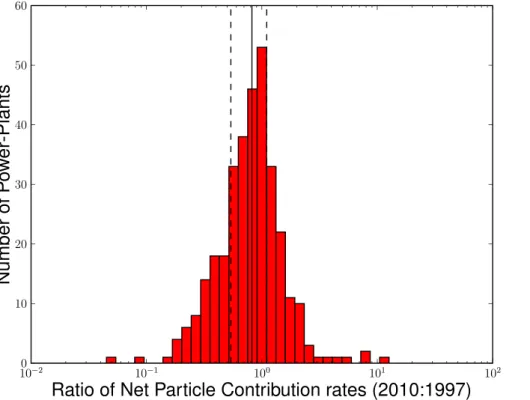
5.4 US emissions statistics and estimated particle formation
The increase in particle production of a single coal-fired power plant may not be
indica-15
tive of broader trends in power plants; therefore, we explored how particle production may have changed for each plant in the US based on their SO2 and NOx emissions
changes. Using the Clean Air Markets database, the 1997 and 2010 SO2 and NOx emissions were found for each of the available 330 coal-fired power plants in the US (that was operational in each of these years). Figure 7 shows the ratio of emissions
20
between 2010 and 1997 for SO2and NOx emissions for these plants. Nearly all power plants show decreases in both species between 1997 and 2010 with a median ratio of 0.64 and 0.48 for SO2and NOx respectively.
In the case of the W.A. Parish plant explored throughout this paper, NOx emissions reductions are significantly greater than the SO2emissions reductions. Thus, the
emis-25
con-ACPD
12, 19683–19713, 2012Coal-fired power-plant SO2 and
NOx control
technologies
C. R. Lonsdale et al.
Title Page
Abstract Introduction
Conclusions References
Tables Figures
◭ ◮
◭ ◮
Back Close
Full Screen / Esc
Printer-friendly Version
Interactive Discussion
Discussion
P
a
per
|
Dis
cussion
P
a
per
|
Discussion
P
a
per
|
Discussio
n
P
a
per
ditions of the W.A. Parish power plant on 27 September 2006 by interpolating the NPC rates in Fig. 5. Figure 8 shows the ratio of the predicted NPC rate between 2010 and 1997 for the 330 plants under the fixed background conditions. Based on these plants, we estimate that there is a net reduction of particle formation between the two years with a median decrease of 19 %, when background conditions are held constant. This
5
overall decrease could be due, in part, to NOx emissions from smaller power plants
being low enough such that the plume is not in the high-NOxregime. For these power plants, reductions in NOx do not lead to large increases in OH and may even lead to
decreases in OH.
It appears that the W.A. Parish power plant investigated throughout this paper may be
10
an extreme case relative to the US median of the power plants because of its stronger NOx controls than SO2 controls. Again, we stress that the results for the sensitivity
of NPC rate to emissions changes will depend on the background meteorology and chemistry. However, the results show that the median change in the NPC rate across the 330 power plants is small. This result is likely robust to changes in background
15
conditions because changes in the background will generally not change the sign of how emissions change the NPC rate. Because the individual 330 plants show a wide range of increases and decreases in NPC rate that largely cancel out (Fig. 8), this can-cellation should not change with the background. However, a full analysis of the effect of power-plant emissions changes on aerosol concentrations using a regional
chemi-20
cal transport model is planned for future work, which will yield a more comprehensive estimate than provided here.
6 Conclusions and discussion
In this paper, we explored how power-plant controls may have affected new-particle for-mation in coal-fired power-plant plumes. Using the meteorology and background
con-25
ACPD
12, 19683–19713, 2012Coal-fired power-plant SO2 and
NOx control
technologies
C. R. Lonsdale et al.
Title Page
Abstract Introduction
Conclusions References
Tables Figures
◭ ◮
◭ ◮
Back Close
Full Screen / Esc
Printer-friendly Version
Interactive Discussion
Discussion
P
a
per
|
Dis
cussion
P
a
per
|
Discussion
P
a
per
|
Discussio
n
P
a
per
|
emissions with SAM/TOMAS model. The decreasing emissions rates of SO2 (30 %) and NOx (90 %) due to pollution-control technologies during this time were simulated,
and model results indicated a significant increase in aerosol formation in the plume. The model showed an order-of-magnitude increase in Net Particle Contribution rate (NPC, the effective emissions of ultrafine particles from the plant taking into account
5
formation and coagulation in the plume) 50 km downwind of the plant during this time period. This predicted increase in NPC rate was due to a decreasing in NOxemissions, which caused an increase in OH and the oxidation rate of SO2to H2SO4.
Model predictions were compared to aircraft measurements from the TexAQS 2000 and 2006 campaigns. This analysis showed that the change in plume particle
concen-10
trations were likely influenced more strongly by differences in the pre-existing particle concentrations between measurement days than by differences in emissions between the years. Meteorological conditions will also have a large influence on the plume mi-crophysics. Thus, it is difficult to quantify the impact of emissions controls on aerosol formation in the plumes from measurements alone without a large number of
mea-15
surements both before and after the controls were added. In addition, the simulations predict that the sensitivity to changing emissions under fixed background conditions is much larger under more polluted conditions (2006) than during the less polluted conditions (2000).
We determined generally how SO2 and NOx emissions changes affect NPC under
20
fixed atmospheric conditions. For power plants with high NOx emissions, SO2
con-centrations must be reduced by a larger fractional amount than NOx concentrations
in order for particle production to decrease in the plume. Using these results, the US-median NPC rate was estimated to have a 19 % decrease between 1997 and 2010 assuming fixed background conditions. However, the results of this paper are limited
25
by the comparison to only two background conditions, and thus the magnitude of the NPC changes may, on average, be different from these predictions.
ACPD
12, 19683–19713, 2012Coal-fired power-plant SO2 and
NOx control
technologies
C. R. Lonsdale et al.
Title Page
Abstract Introduction
Conclusions References
Tables Figures
◭ ◮
◭ ◮
Back Close
Full Screen / Esc
Printer-friendly Version
Interactive Discussion
Discussion
P
a
per
|
Dis
cussion
P
a
per
|
Discussion
P
a
per
|
Discussio
n
P
a
per
in Germany, Inner Mongolia and Southern Australia. They attributed the increased par-ticle concentrations to the in-stack formation of SO3/H2SO4 from Flue Gas
Desulfur-ization and Selective Catalytic Reduction technologies (which may lead to particle for-mation in/near the stack). They did not investigate the potential for changes in plume chemistry and nucleation as we do here. On the other hand, we did not address the
5
in-stack processes in this paper since emissions data of SO3, H2SO4or ultrafine
par-ticles formed in the stack is not readily available for US power plants. However, the unintended formation of SO3/H2SO4 could cause significant changes in the particle
concentrations in plumes of emission-controlled plants and should be investigated in future work. Additionally, NH3slip from SCR may lead to increased nucleation rates in
10
a plume. We estimated the possible effects of NH3 slip in Gong et al. (2012), but do not address this here as NH3emission data is also not readily available for US power
plants. The aqueous oxidation of particles in clouds was also not considered in this work due to little to no plume/cloud interaction in the test cases. For cases where the plume enters clouds, there would be a decreased NPC rate in the plume due to the
15
aqueous removal of SO2, additional of sulfate to activated particles, as well as reduced
OH because of the reduction in sunlight. Additionally, VOC concentrations were as-sumed fixed in our simulations, and changes in VOCs may affect OH concentrations resulting in different SO2oxidation rates for fixed NOxemissions and backgrounds.
This study has shown that an unintended result of pollution-control technologies may
20
be occurring with the addition or loss of particles produced within power-plant plumes. In order to accurately estimate the cumulative effect of aerosols on climate and health, primary emissions, nucleation and growth of particles in plumes of power plants must be understood. With the continuing construction of coal-fired power plants and the changes in pollution-control technologies, there is a strong need for additional
mod-25
ACPD
12, 19683–19713, 2012Coal-fired power-plant SO2 and
NOx control
technologies
C. R. Lonsdale et al.
Title Page
Abstract Introduction
Conclusions References
Tables Figures
◭ ◮
◭ ◮
Back Close
Full Screen / Esc
Printer-friendly Version
Interactive Discussion
Discussion
P
a
per
|
Dis
cussion
P
a
per
|
Discussion
P
a
per
|
Discussio
n
P
a
per
|
From this, the impact of power-plant controls on downwind CCN production can be studied using three-dimensional modeling of plume dynamics. Additionally, we are cre-ating a sub-grid plume parameterization for three-dimensional global models to more accurately quantify aerosol microphysics in coal-fired power-plant plumes and the ef-fects of pollution-control technologies.
5
Acknowledgements. This research was funded by Environment Canada and the Electrical Power Research Institute (EPRI). We would like to thank Annmarie Carlton of Rutgers Uni-versity for her suggestions.
References
Adams, P. J. and Seinfeld, J. H.: Disproportionate impact of particulate emissions
10
on global cloud condensation nuclei concentrations, Geophys. Res. Lett., 30, 1239, doi:10.1029/2002GL016303, 2003.
Albrecht, B.: Aerosols, cloud microphysics, and fractional cloudiness, Science, 245, 1227– 1230, 1989.
Arya, S. P.: Air Pollution Meteorology and Dispersion, Oxford University Press, Inc., New York,
15
USA, 309 pp., 1999.
Beirle, S., Boersma, K. F., Platt, U., Lawrence, M. G., and Wagner, T.: Megacity Emissions and Lifetimes of Nitrogen Oxides Probed from Space, Science, 333, 1737–1739, 2011.
Brock, C., Trainer, M., Ryerson, T., Neuman, J., Parrish, D., Holloway, J., Nicks, D., Frost, G., H ¨ubler, G., Fehsenfeld, F., Wilson, J., Reeves, J., Lafleur, B., Hilbert, H., Atlas, E. L., Donnelly,
20
S., Schauffler, S. M., Stroud, V. F., and Wiedinmyer, C.: Particle growth in urban and industrial plumes in Texas, J. Geophys. Res. 108, 4111, doi:10.1029/2002JD002746, 2003.
Canadian Environmental Protection Act Federal-Provincial Advisory Committee Working Group on Air Quality Objectives and Guidelines. National Ambient Air Quality Objectives for Partic-ulate Matter, Science Assessment Document; Health Canada and Environment Canada,
25
Ottawa, Ontario, Canada, 1999.
ACPD
12, 19683–19713, 2012Coal-fired power-plant SO2 and
NOx control
technologies
C. R. Lonsdale et al.
Title Page
Abstract Introduction
Conclusions References
Tables Figures
◭ ◮
◭ ◮
Back Close
Full Screen / Esc
Printer-friendly Version
Interactive Discussion
Discussion
P
a
per
|
Dis
cussion
P
a
per
|
Discussion
P
a
per
|
Discussio
n
P
a
per
Charlson, R. J., Schwartz, S. E., Hales, J. M., Cess, R. D., Coakley, J. A., Hansen, J. E., and Hofmann, D. J.: Climate forcing by anthropogenic aerosols, Science, 255, 423-430, 1992. Electric Power Research Institute: Estimating Total Sulfuric Acid Emissions from Stationary
Power Plants, Report 1016384, Palo Alto, CA, USA, Electric Power Research Institute, 2008. Gong, L., Lewicki, R., Griffin R., Lonsdale, C., Stevens, R., Pierce, J., Malloy, Q., Travis, S.,
5
Bobmanuel, L., Lefer, B. and Flynn, J. (2012) Atmospheric ammonia measurements and implications for particulate matter formation in Houston, TX, submitted to Environ. Sci. Tech., 2012.
Junkermann, W., Hagemann, R., and Vogel, B.: Nucleation in the Karlsruhe plume during the COPS/TRACKS – Lagrange experiment, Q. J. Roy. Meteorol. Soc., 137, 267–274, 2011a.
10
Junkermann, W., Vogel, B., and Sutton, M. A.: The climate penalty for clean fossil fuel combus-tion, Atmos. Chem. Phys., 11, 12917–12924, doi:10.5194/acp-11-12917-2011, 2011b. Khairoutdinov, M. F. and Randall, D. A.: Cloud resolving modeling of the ARM Summer 1997
IOP: model formulation, results, uncertainties, and sensitivities, J. Atmos. Sci., 60, 607–625, 2003.
15
Kirkby, J., Curtius, J., Almeida, J., Dunne, E., Duplissy, J., Ehrhart, S., Franchin, A., Gagn ´e , S., Ickes, L., K ¨urten, A., Kupc, A., Metzger, A., Riccobono, F., Rondo, L., Schobesberger, S., Tsagkogeorgas, G., Wimmer, D., Amorim, A., Bianchi, F., Breitenlechner, M., David, A., Dommen, J., Downard, A., Ehn, M., Flagan, R.C., Haider, S., Hansel, A., Hauser, D., Jud, W., Junninen, H., Kreissl, F., Kvashin, A., Laaksonen, A., Lehtipalo, K., Lima, J., Lovejoy, E.
20
R., Makhmutov, V., Mathot, S., Mikkil ¨a, J., Minginette, P., Mogo, S., Nieminen, T., Onnela, A., Pereira, P., Pet ¨aj ¨a, T., Schnitzhofer, R., Seinfeld, J. H., Sipil ¨a, M., Stozhkov, Y., Stratmann, F., Tom ´e, A., Vanhanen, J., Viisanen, Y., Vrtala, A., Wagner, P. E., Walther, H., Weingartner, W., Wex, H., Winkler, P. M., Carslaw, K. S., Worsnop, D. R., Baltensperger, U., and Kulmala, M.: Role of sulphuric acid, ammonia and galactic cosmic rays in atmospheric aerosol nucleation,
25
Nature, 476, 429–433. doi:10.1038/nature10343, 2011.
Konwar, M., Maheskumar, R. S., Kulkarni, J. R., Freud, E., Goswami, B. N. and Rosenfeld, D.: Suppression of warm rain by aerosols in rain-shadow areas of India, Atmos. Chem. Phys. Discuss., 10, 17009–17027, doi:10.5194/acpd-10-17009-2010, 2010.
Kulmala, M., and Kerminen, V.: On the formation and growth of atmospheric nanoparticles,
30
Atmos. Res., 90, 132–150, doi:10.1016/j.atmosres.2008.01.005, 2008.
ACPD
12, 19683–19713, 2012Coal-fired power-plant SO2 and
NOx control
technologies
C. R. Lonsdale et al.
Title Page
Abstract Introduction
Conclusions References
Tables Figures
◭ ◮
◭ ◮
Back Close
Full Screen / Esc
Printer-friendly Version
Interactive Discussion
Discussion
P
a
per
|
Dis
cussion
P
a
per
|
Discussion
P
a
per
|
Discussio
n
P
a
per
|
J., and Kulmala, M.: Sensitivity of aerosol concentrations and cloud properties to nucleation and secondary organic distribution in ECHAM5-HAM global circulation model, Atmos. Chem. Phys., 9, 1747–1766, doi:10.5194/acp-9-1747-2009, 2009.
Merikanto, J., Napari, I., Vehkamaki, H., Anttila, T., and Kulmala, M.: New parameterization of sulfuric acid-ammonia-water ternary nucleation rates at tropospheric conditions, J. Geophys.
5
Res., 112, D15207, doi:10.1029/2006JD007977, 2006.
Mesinger, F., Dimego, G., Kalnay, E., Mitchell, K., Shafran, P. C., Ebisuzaki, W., Joviæ, D., Woollen, J., Rogers, E., Berbery, E. H., Ek, M. B., Fan, Y., Grumbine, R., Higgins, W., Li, H., Lin, Y., Manikin, G., Parrish, D., and Shi, W.: North American Regional Reanalysis: A long-term, consistent, high-resolution climate dataset for the North American domain, as a major
10
improvement upon the earlier global reanalysis datasets in both resolution and accuracy, B. Am. Meteorol. Soc., 87, 343–360, 2006.
Miller. B. G.: Clean Coal Engineering Technology, Elsevier Inc, Oxford, 375–481, 2010. Peng, R. D., Dominici, F., Pastor-Barriuso, R., Zeger, S. L., and Samet, J. M.: Seasonal
Analy-ses of Air Pollution and Mortality in 100 US Cities, Am. J. Epidemiol., 161, 585–594, 2004.
15
Pierce, J. R. and Adams, P. J.: Efficiency of cloud condensation nuclei formation from ultrafine particles, Atmos. Chem. Phys., 7, 1367–1379, doi:10.5194/acp-7-1367-2007, 2007.
Pierce, J. R. and Adams, P. J.: Uncertainty in global CCN concentrations from uncer-tain aerosol nucleation and primary emission rates, Atmos. Chem. Phys., 9, 1339–1356, doi:10.5194/acp-9-1339-2009, 2009a.
20
Pierce, J. R. and Adams, P. J.: A computationally efficient aerosol nucleation/condensation method: pseudo-steady-state sulfuric acid, Aerosol Sci. Technol., 43, 1–11, 2009b.
Poppe, D., Wallasch, M., and Zimmermann, J.: The Dependence of the Concentration of OH on its Precursors under Moderately Polluted Conditions: A Model Study, J. Atmos. Chem., 16, 61–78, 1992.
25
Seinfeld, J. H. and Pandis, S. N.: Atmospheric Chemistry and Physics: From Air Pollution to Climate Change, 2, John Wiley & Sons, Inc., Hoboken, New Jersey, USA, 1–1225, 2006. Solomon, S., Qin, D., Manning, M., Chen, Z., Marquis, M., Averyt, K. B., Tignor, M., and
Miller, H. L. (Eds.): Climate change 2007: The Physical Science Basis. Contribution of Work-ing Group 1 to the Fourth Assessment Report of the Intergovernmental Panel on Climate
30
Change, IPCC, Cambridge University Press, Cambridge, UK, and New York, NY, USA, 2007. Spracklen, D. V., Carslaw, K. S., Kulmala, M., Kerminen, V.-M., Sihto, S. L., Riipinen, I.,
ACPD
12, 19683–19713, 2012Coal-fired power-plant SO2 and
NOx control
technologies
C. R. Lonsdale et al.
Title Page
Abstract Introduction
Conclusions References
Tables Figures
◭ ◮
◭ ◮
Back Close
Full Screen / Esc
Printer-friendly Version
Interactive Discussion
Discussion
P
a
per
|
Dis
cussion
P
a
per
|
Discussion
P
a
per
|
Discussio
n
P
a
per
H.: Contribution of particle formation to global cloud condensation nuclei concentrations, Geophys. Res. Lett., 35, L06808, doi:10.1029/2007GL033038, 2008.
Srivastava, R. K. and Jozewicz, W.: Flue Gas Desulfurization: The State of the Art, J. Air Waste Manage. Assoc., 51, 1676–1688, 2001.
Srivastava, R. K., Miller, C. A., Erickson, C., and Jambhekar, R.: Emissions of sulfur trioxide
5
from coal-fired power plants, Air Waste Manage. Assoc., 54, 750–762, 2004.
Stevens, R. G., Pierce, J. R., Brock, C. A., Reed, M. K., Crawford, J. H., Holloway, J. S., Ry-erson, T. B., Huey, L. G., and Nowak, J. B.: Nucleation and growth of sulfate aerosol in coal-fired power plant plumes: sensitivity to background aerosol and meteorology, Atmos. Chem. Phys., 12, 189–206, doi:10.5194/acp-12-189-2012, 2012.
10
Stieb, D. M., Judek, S., and Burnett, R. T.: Meta-analysis of time- series studies of air pollution and mortality: effects of gases and particles and their influence of cause of death, age and season, J. Air Manage. Assoc. 52, 470–484, 2002.
Twomey, S.: Pollution and planetary albedo, Atmos. Environ., 8, 1251–1256, 1974.
Wang, M. and Penner, J. E.: Aerosol indirect forcing in a global model with particle nucleation,
15
Atmos. Chem. Phys., 9, 239–260, doi:10.5194/acp-9-239-2009, 2009.
Wang, S. W., Zhang, Q., Streets, D. G., He, K. B., Martin, R. V., Lamsal, L. N., Chen, D., Lei, Y., and Lu, Z.: Growth in NOx emissions from power plants in China: bottom-up estimates and satellite observations, Atmos. Chem. Phys., 12, 4429–4447, doi:10.5194/acp-12-4429-2012, 2012.
20
Zhao, Y., Wang, S., Duan, L., Lei, Y., Cao, P., and Hao, J.: Primary air pollutant emissions of coal-fired power plants in China: Current status and future prediction, Atmos. Environ., 42, 8442–8452. 2008.
Zhou, W., Cohan, D. S., Pinder, R. W., Neuman, J. A., Holloway, J. S., Peischl, J., Ryerson, T. B., Nowak, J. B., Flocke, F., and Zheng, W. G.: Observation and modeling of the evolution
25
ACPD
12, 19683–19713, 2012Coal-fired power-plant SO2 and
NOx control
technologies
C. R. Lonsdale et al.
Title Page
Abstract Introduction
Conclusions References
Tables Figures
◭ ◮
◭ ◮
Back Close
Full Screen / Esc
Printer-friendly Version
Interactive Discussion
Discussion
P
a
per
|
Dis
cussion
P
a
per
|
Discussion
P
a
per
|
Discussio
n
P
a
per
|
10−1 100 101 102
NOx[ppb]
104
105
106
107
108
O
H
[m
o
le
c
cm
−
3 ]
2010
1997
ACPD
12, 19683–19713, 2012Coal-fired power-plant SO2 and
NOx control
technologies
C. R. Lonsdale et al.
Title Page
Abstract Introduction
Conclusions References
Tables Figures
◭ ◮
◭ ◮
Back Close
Full Screen / Esc
Printer-friendly Version
Interactive Discussion
Discussion
P
a
per
|
Dis
cussion
P
a
per
|
Discussion
P
a
per
|
Discussio
n
P
a
per
1996 1998 2000 2002 2004 2006 2008 2010
Year
0.0
0.5
1.0
1.5
2.0
Av
era
ge
Em
issi
on
s r
ate
pe
r y
ea
r (
kg
s
−
1
)
NO
XSO
2Fig. 2.The yearly average emissions (kg s−1) of SO
2 (green) and NOx (blue) from the 4
ACPD
12, 19683–19713, 2012Coal-fired power-plant SO2 and
NOx control
technologies
C. R. Lonsdale et al.
Title Page
Abstract Introduction
Conclusions References
Tables Figures
◭ ◮
◭ ◮
Back Close
Full Screen / Esc
Printer-friendly Version
Interactive Discussion
Discussion
P
a
per
|
Dis
cussion
P
a
per
|
Discussion
P
a
per
|
Discussio
n
P
a
per
|
10
-310
-210
-110
0Diameter (
µm)
2000
4000
6000
8000
10000
dN/dlogD
p
(cm
−
3
)
Sept 27th, 2006
Aug 27th, 2000
ACPD
12, 19683–19713, 2012Coal-fired power-plant SO2 and
NOx control
technologies
C. R. Lonsdale et al.
Title Page
Abstract Introduction
Conclusions References
Tables Figures
◭ ◮
◭ ◮
Back Close
Full Screen / Esc
Printer-friendly Version
Interactive Discussion
Discussion
P
a
per
|
Dis
cussion
P
a
per
|
Discussion
P
a
per
|
Discussio
n
P
a
per
0 10000 20000 30000 40000 50000 60000
Distance from source (m)
1013
1014
1015
1016
1017
1018
N
e
t
P
a
rt
icl
e
C
o
n
tr
ib
u
ti
o
n
ra
te
(s
−
1 )
2010 Emissions 1997 Emissions
ACPD
12, 19683–19713, 2012Coal-fired power-plant SO2 and
NOx control
technologies
C. R. Lonsdale et al.
Title Page Abstract Introduction Conclusions References Tables Figures ◭ ◮ ◭ ◮ Back Close
Full Screen / Esc
Printer-friendly Version Interactive Discussion Discussion P a per | Dis cussion P a per | Discussion P a per | Discussio n P a per |
1 2 3 4 5 6 7
SO2emissions (kg s−1)
0 .2 0 .4 0 .6 0 .8 1 .0 1 .2 1 .4 N OX e m issi o n s (kg s − 1 )
−0.5 0 .0 0 .5 1 .0 1 .5 2 .0 2 .5 3 .0 3 .5 N e t P a rt icl e C o n tr ib u ti o n ra te (s − 1 )
×1017
ACPD
12, 19683–19713, 2012Coal-fired power-plant SO2 and
NOx control
technologies
C. R. Lonsdale et al.
Title Page
Abstract Introduction
Conclusions References
Tables Figures
◭ ◮
◭ ◮
Back Close
Full Screen / Esc
Printer-friendly Version
Interactive Discussion
Discussion
P
a
per
|
Dis
cussion
P
a
per
|
Discussion
P
a
per
|
Discussio
n
P
a
per
0 10000 20000 30000 40000 50000 60000
Distance from source (m) 1015
1016 1017 1018 1019
N
e
t
P
a
rt
icl
e
C
o
n
tr
ib
u
ti
o
n
ra
te
(s
−
1 )
2000 emissions, 2000 background 2006 emissions, 2000 background 2000 emissions, 2006 background 2006 emissions, 2006 background • TexasAQS 2000 flight measurements
• TexasAQS 2006 flight measurements
ACPD
12, 19683–19713, 2012Coal-fired power-plant SO2 and
NOx control
technologies
C. R. Lonsdale et al.
Title Page
Abstract Introduction
Conclusions References
Tables Figures
◭ ◮
◭ ◮
Back Close
Full Screen / Esc
Printer-friendly Version
Interactive Discussion
Discussion
P
a
per
|
Dis
cussion
P
a
per
|
Discussion
P
a
per
|
Discussio
n
P
a
per
|
ACPD
12, 19683–19713, 2012Coal-fired power-plant SO2 and
NOx control
technologies
C. R. Lonsdale et al.
Title Page
Abstract Introduction
Conclusions References
Tables Figures
◭ ◮
◭ ◮
Back Close
Full Screen / Esc
Printer-friendly Version
Interactive Discussion
Discussion
P
a
per
|
Dis
cussion
P
a
per
|
Discussion
P
a
per
|
Discussio
n
P
a
per
10−2 10−1 100 101 102
Ratio of Net Particle Contribution rates (2010:1997)
010 20 30 40 50 60
![Fig. 1. [OH] as a function of [NO x ] for the background conditions on 27 September 2006](https://thumb-eu.123doks.com/thumbv2/123dok_br/18251554.342346/24.918.101.617.96.497/fig-oh-function-x-background-conditions-september.webp)