ACPD
9, 25565–25597, 2009Physical and optical properties of atmospheric aerosol
M. Calvello et al.
Title Page
Abstract Introduction
Conclusions References
Tables Figures
◭ ◮
◭ ◮
Back Close
Full Screen / Esc
Printer-friendly Version
Interactive Discussion
Atmos. Chem. Phys. Discuss., 9, 25565–25597, 2009 www.atmos-chem-phys-discuss.net/9/25565/2009/ © Author(s) 2009. This work is distributed under the Creative Commons Attribution 3.0 License.
Atmospheric Chemistry and Physics Discussions
This discussion paper is/has been under review for the journal Atmospheric Chemistry and Physics (ACP). Please refer to the corresponding final paper in ACP if available.
Physical and optical properties of
atmospheric aerosol by in-situ and
radiometric measurements
M. Calvello1, F. Esposito1,2, G. Pavese1, and C. Serio2
1
Consiglio Nazionale delle Ricerche-Istituto di Metodologie per l’Analisi Ambientale (CNR-IMAA), C.da S.Loja, 85050 Tito Scalo, Potenza, Italy
2
Dipartimento di Ingegneria e Fisica dell’Ambiente, Universit ´a della Basilicata, Viale dell’Ateneo Lucano n.10, 85100 Potenza, Italy
Received: 13 October 2009 – Accepted: 10 November 2009 – Published: 27 November 2009
Correspondence to: M. Calvello (calvello@imaa.cnr.it)
ACPD
9, 25565–25597, 2009Physical and optical properties of atmospheric aerosol
M. Calvello et al.
Title Page
Abstract Introduction
Conclusions References
Tables Figures
◭ ◮
◭ ◮
Back Close
Full Screen / Esc
Printer-friendly Version
Interactive Discussion
Abstract
Physical and optical properties of atmospheric aerosols collected by using a high reso-lution (1.5 nm) spectroradiometer (spectral range 400–800 nm), a 13 stages Dekati Low
Pressure Impactor (size range 30 nm–10µm), and an AE31 Aethalometer (7
wave-lenghts from 370 nm to 950 nm), have been examined in a semi-rural site in Southwest
5
Italy (Tito Scalo, 40◦35′N, 15◦41′E, 750 m a.s.l.). In particular, daily averaged values
of AOD and ˚Angstr ¨om turbidity parameters from radiometric data together with
mass-size distributions from impactor data and Black Carbon (BC) concentrations have been analyzed from May to October 2008. Furthermore, by inverting direct solar radiances, aerosol columnar number and volume size distributions have been obtained for the
10
same period. Comparison of different observation methods, allowed to verify if, and in
what conditions, changes in aerosol properties measured at ground are representative of columnar properties variations. Agreement between columnar and in-situ measure-ments has been obtained in case of anthropogenic aerosol loading, while in case of Saharan dust intrusions some discrepancies have been found when dust particles were
15
located at high layers in the atmosphere (4–8 km) thus affecting columnar properties
more than surface ones. For anthropogenic aerosols, a good correlation has been confirmed through the comparison of fine aerosol fraction contribution as measured by radiometer, impactor and aethalometer, suggesting that in this case particles are more homogeneously distributed over the lower layers of atmosphere and columnar aerosol
20
optical properties are dominated by surface measured component.
1 Introduction
At present time aerosols are recognized to be responsible of a significant impact on
climate change affecting our environment. IPCC 2007 refers to aerosol radiative
forc-ing, through direct, indirect and semi-direct effects, as a problem with a medium-low
25
ACPD
9, 25565–25597, 2009Physical and optical properties of atmospheric aerosol
M. Calvello et al.
Title Page
Abstract Introduction
Conclusions References
Tables Figures
◭ ◮
◭ ◮
Back Close
Full Screen / Esc
Printer-friendly Version
Interactive Discussion
and the high spatial and temporal variability of aerosol properties in the atmosphere. Uncertainty in aerosol properties retrieval requires the merging of well integrated
instru-mentation since no single type of observation is sufficient to predict aerosol properties
in an adequate way. Thus, according to IPCC 2007, improved and intensified in situ observations together with remote sensing of aerosols could better constrain the range
5
of aerosol radiative forcing.
Radiometric remote sensing techniques are a very powerful tool to investigate aerosol optical properties on the vertical column. AOD values can be measured to estimate aerosol loading in the atmosphere. Moreover the analysis of AOD spectral
dependence expressed by the ˚Angstr ¨om exponent α and the study of a relationship
10
between AOD andα can be useful to distinguish different aerosol types. On this
sub-ject Masmoudi et al. (2003) identified aerosol source region in different sites of the
Mediterranean basin analysing ˚Angstr ¨om exponent α variation as a function of the
aerosol optical thickness at 870 nm. The same kind of analysis is carried out by Mukai et al. (2006), and Pace et al. (2006) over an urban area in Japan and the
Mediter-15
ranean Sea, respectively. As a further support to aerosol characterization, inversions can be performed from radiometric measurements to obtain both columnar volume and number size distributions (Cachorro et al., 2008; Lyamani et al., 2005; Pavese et al., 2009; Perrone et al., 2005). Observations of aerosol properties from radiomet-ric measurements are widely available so far, consider for example AERONET and
20
SKYNET networks. However, for a better understanding of the aerosol role in atmo-spheric processes especially near the ground, where most anthropogenic aerosol are concentrated, measurements in the near-ground layer of the atmosphere are desirable.
Furthermore, in cases when different layers of aerosol at different heights are present,
uncertainties in column-integrated aerosol optical and physical parameters retrievals,
25
ACPD
9, 25565–25597, 2009Physical and optical properties of atmospheric aerosol
M. Calvello et al.
Title Page
Abstract Introduction
Conclusions References
Tables Figures
◭ ◮
◭ ◮
Back Close
Full Screen / Esc
Printer-friendly Version
Interactive Discussion
aerosol properties (Chaudhry et al., 2007; Cheng et al., 2008; Choi et al., 2008; Gera-soupoulos et al., 2007; Mukai et al., 2006, Sch ¨afer et al., 2008; Schaap et al., 2009). This has led to an increasing interest in expanding coverage for integrated
measure-ments into key areas representative of different aerosol types.
The main goal of this work is to study optical and physical properties of aerosol
5
by the use of different observation techniques such as ground-based radiometric,
in-situ gravimetric and filter-absorbing techniques. For an in-depth analysis, ground-level and columnar size distributions have been compared directly for days of contemporary measurements. Attention has been focused on particulate fine fraction component through Black Carbon (BC) concentrations measurements due to its important role
10
in climate forcing as the major solar radiation absorbing component of atmospheric aerosols. The aethalometer is one of the most common instrument for measuring real-time BC concentrations with more than one thousand instruments used all around the world (Snyder et al., 2007). It is simple to use, quite inexpensive, allowing samplings to be subjected to further analysis. In this work, aethalometer measurements of BC
15
concentrations combined with impactor and radiometric estimates of aerosol physical properties contributed to a better understanding of BC contribution to the fine fraction of aerosol.
All measurements have been performed in a semi-rural site belonging to the Mediter-ranean area that is a proper site for monitoring variability of aerosol properties in a
com-20
plete way due to the influence of different air masses. In particular seaborne particles
both from the Mediterranean itself and transported from the Atlantic Ocean are present, together with dust from Sahara desert and polluted and smoke aerosols mainly from Central and Eastern Europe. Combining radiometric, impactor and aethalometer mea-surements, at least on a campaign basis so far, could provide a closure between optical
25
ACPD
9, 25565–25597, 2009Physical and optical properties of atmospheric aerosol
M. Calvello et al.
Title Page
Abstract Introduction
Conclusions References
Tables Figures
◭ ◮
◭ ◮
Back Close
Full Screen / Esc
Printer-friendly Version
Interactive Discussion
2 Field campaign
2.1 Sampling site
The measurement site, located in South-Italy (Tito Scalo, 40◦60′N, 15◦72′E, 750 m
a.s.l.), is a very small industrial zone placed in a large rural area with some anthro-pogenic aerosol local source impacting the sampling location (some little plants and
5
a main road passing at a distance of about 1 km). During the sampling period, mainly summer, frequent local smoke events from neighbouring woods have been registered. Moreover the site is exposed to receive aerosol loading from air mass transport both anthropogenic from North-Eastern Europe and dust intrusion from Sahara desert to-gether with marine particles which are an almost constant component at the site due to
10
the closeness of Tyrrhenian, Adriatic and Ionian seas (respectively 70 km, 90 km, and 95 km) .
2.2 Measurements and methods
A Dekati Low Pressure Impactor (DLPI hereafter) has been used to obtain aerosol mass size distributions at ground level with the instrument inlet placed at about 2 m
15
above ground. The DLPI has a size range from 0.03 to 10.0µm and a flow rate of
30 l/min with 50% stage cut off Equivalent Aerodynamic Diameters (EAD) at 0.029,
0.056, 0.095, 0.158, 0.264, 0.383, 0.610, 0.939, 1.577, 2.354, 3.928, 6.471, 9.769µm.
Aerosol have been collected on 25 mm diameter Nucleopore polycarbonate filters for gravimetric analysis with a sampling time of 24 h. Mean daily values of air temperature,
20
pressure and relative humidity measured at the impactor inlet were used to obtain the normalised sampled volume. Filters were stored into a conditioned room for 24 h
before and after exposure at 50±5 RH% and 20±5◦C. After equilibration, before and
after exposure, filters were weighted on a microbalance (Mettler Toledo MX5 Type –
weighing accuracy of±1µg) for gravimetric analysis. Weighing was performed in the
25
ACPD
9, 25565–25597, 2009Physical and optical properties of atmospheric aerosol
M. Calvello et al.
Title Page
Abstract Introduction
Conclusions References
Tables Figures
◭ ◮
◭ ◮
Back Close
Full Screen / Esc
Printer-friendly Version
Interactive Discussion
weighing when the first two were not within 5µg. The mean of the two closest weighing
was used for the analysis. Field blanks were used to calculate the limit of detection (LOD) for the whole procedure. A number of 13 samplings were carried out with one or at most two samplings per week for the period June–October 2008. From direct mass measurements on sampled filters, mass size distributions are simply derived from:
5
d m dlog(D)=
d Mi
VN·log(D50,i+1/D50,i) (1)
whered Mi is the mass collected on thei-th stage (i=1–13),VNis the normalised
sam-pled volume, andD50,i and D50,i+1 are the cut-off equivalent aerodynamic diameters
for thei-th stage and thei+1-th stage, respectively (Baron and Willeke, 2001).
Direct solar irradiance spectra have been measured by the high resolution Ocean
10
Optics S2000 spectroradiometer covering the spectral range 400–800 nm. The solar
diffuse light component has been excluded from the incoming beam by the optic field of
view of about 1◦. Measurements were carried out in cloudless conditions, all along the
day, recording spectra every 15 min. More than 500 spectra have been collected during the period May–September 2008 on 14 measurements days. Aerosol Optical Depth
15
has been estimated by the Langley calibration procedure out of the strong gaseous absorption bands (Esposito et al., 2004). A correction has been made for the ozone
Chappuis band (0.45–0.70µm) using ozone content daily data available on the TOMS
(Total Ozone Map Spectrometer) web site (toms.gsfc.nasa.gov/eptoms/ep.html).
The estimation of the ˚Angstr ¨om parametersα andβ has been obtained by a fitting
20
procedure applied to the well-known ˚Angstr ¨om turbidity formula relating AOD to the
wavelength.
Finally, aerosol number and volume size distributions have been derived from AOD through a modified non-parametric inversion technique described in detail in Esposito et al. (2004).
25
ACPD
9, 25565–25597, 2009Physical and optical properties of atmospheric aerosol
M. Calvello et al.
Title Page
Abstract Introduction
Conclusions References
Tables Figures
◭ ◮
◭ ◮
Back Close
Full Screen / Esc
Printer-friendly Version
Interactive Discussion
achievable only during the day and with clear sky conditions, whereas impactor mea-surements are only subject to the no-rain condition.
Black Carbon measurements were carried out from May 2008 to October 2008
with a seven wavelengths Aethalometer (Magee Scientific, model AE31,λ=370, 470,
520, 590, 660, 880, 950 nm). The size selective inlet (aerodynamic particle diameter
5
<2.5µm) was placed at about 2 m above ground. Aerosol were collected on a quartz
fiber tape with a time resolution of 5 min at a flow rate of 3.9 lpm. Optical attenuation measurements through the filter allowed to estimate BC mass concentration using the
constant mass absorption cross section value of 16.6 m2g−1at 800 nm recommended
by the manufacturer. In this phase, no correction has been performed either for the
10
shadowing effect and for the scattering offset (Collaud Coen et al., 2009), considering
first results obtained here useful for a first qualitative BC data analysis. In a further step, a correction procedure is expected to be carried out for a more quantitative analysis.
To better interpret surface and columnar data comparison, back trajectory analysis has been performed using the HYbrid Single-Particle Lagrangian Integrated Trajectory
15
(HYPLIT4) model (Draxler and Rolph, 2003). In particular, 5-day backward trajectories
have been calculated at 12 different endpoints from 500 to 6000 m a.g.l. ARL/GDAS
meteorological database (spatial resolution 1◦, temporal resolution 3 h) from NOAA
Air Resources Laboratory’s web server (http://www.arl.noaa.gov/READYamet.php) has
been employed as input for theHYSPLIT4 model.
20
Possible Saharan dust intrusions have been verified even through theDREAM(Dust
REgional Atmospheric Model) model and the Navy Aerosol Analysis and Prediction System (NAAPS) aerosol maps, provided from the Barcelona Supercomputing Cen-ter (http://www.bsc.es/projects/earthscience/DREAM/) and the Naval Research Labo-ratory (http://www.nrlmry.navy.mil/aerosol/), respectively. NAAPS aerosol maps were
25
used also to obtain sulphate and smoke concentrations distribution. For investigation
of fire areas, daily active fire hot spot detections (FIRMS maps) were used from Web
ACPD
9, 25565–25597, 2009Physical and optical properties of atmospheric aerosol
M. Calvello et al.
Title Page
Abstract Introduction
Conclusions References
Tables Figures
◭ ◮
◭ ◮
Back Close
Full Screen / Esc
Printer-friendly Version
Interactive Discussion
3 Results and discussion
3.1 Aerosol properties from ground-level DLPI measurements
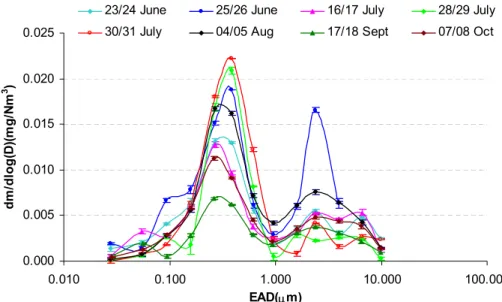
Typical mass size distributions obtained from DLPI data for the analyzed measure-ment period show a prevailing bimodal pattern with the accumulation mode oscillating
in the range 0.27µm–0.39µm and a coarse mode centred at 2.4µm. Some
distribu-5
tions show a multimodal pattern with alternatively three more modes: two ultra-fine at
0.055µm and 0.093µm and a coarse at 6.6µm. The accumulation mode is always
present and can be attributed to local traffic emissions in accordance with what found
in Chuaybamroong et al. (2006) for traffic associated mass size distributions. In that
work, aerosol mass size distributions have been obtained with a MOUDI, sampling
10
different aerosol types near their corresponding point sources: a cement plant stack
for anthropogenic secondary aerosols, an agricultural farm for soil dust aerosols, the
Atlantic Ocean for seaborne particles. In the case of traffic aerosol, measured near
the footpath of a very busy street without other major aerosol sources, mass size
dis-tributions showed a peak in the dimensional range 0.32–0.56µm. As it will be seen
15
later, for our measurements this mode becomes more intense when air masses from North-Eastern Europe are transported to the sampling site or when local smoke events
take place. Modal diameter centred at about 2.4µm is also always present being
at-tributable to local sources of dust like soil (Chuaybamroong et al., 2006; Salma et al., 2002) or to marine aerosol that are, as verified from back-trajectories analysis, a
con-20
stant component of air mass transport and loading on the sampling site. As for the accumulation mode, also this second mode increases for long-range transport events in this case from Saharan desert. This is in accordance with what is commonly found in literature where dust mass size distributions are characterized by a dominant coarse
mode with modal diameter>2µm (Clarke et al., 2004; Park and Kim, 2006; Tegen et
25
al., 2006). As regards marine aerosol, in literature their mass size distributions com-monly show two modes, one sub-micrometer less intense and one more intense in the
ACPD
9, 25565–25597, 2009Physical and optical properties of atmospheric aerosol
M. Calvello et al.
Title Page
Abstract Introduction
Conclusions References
Tables Figures
◭ ◮
◭ ◮
Back Close
Full Screen / Esc
Printer-friendly Version
Interactive Discussion
2002) suggesting that marine aerosol in our case mainly contribute to the coarse mode
at about 6.6µm.
In Table 1, for each measured size distribution, values of modal EAD are reported for both bimodal and multimodal mass size distributions. Looking at the variety of mass size distributions obtained, and analysing transport phenomena by back-trajectories,
5
NAAPS and DREAM maps, it has been possible to verify how different aerosol types
contribute to the different modes. In particular Saharan dust loading results in a
distri-bution with the mode at 2.4µm dominating on the fine one as plotted in Fig. 1. In all
these cases Saharan dust intrusions influence the size distributions but with different
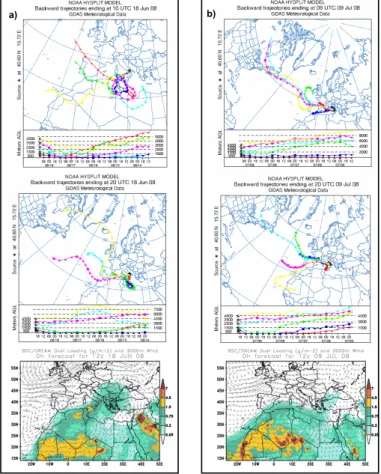
intensity and duration. On 18/19 June, 7/8 July and 8/9 September, the contribution
10
of transport from Africa remains strong almost all 24 h DLPI measurements long, with air masses travelling very low on Sahara region and on the Mediterranean Sea. This allows particles to be caught also from the sea resulting in an enhanced loading over the entire dimensional range. These features are showed for the representative day of 18/19 June in Fig. 2a, where the corresponding DREAM map is reported to verify the
15
high intensity of Saharan air masses advection over our region. Mass size distributions for 9/10 July and the 14/15 July are characterised by the two less intense modes. As showed in Fig. 2b for the representative case of 9/10 July, back-trajectories in most cases do not directly come from the Saharan desert, loading up dust particles when travelling over the Mediterranean Sea, as it is possible to see also from DREAM map.
20
Note that back trajectories reported in Fig. 2 are all calculated with their arrival time almost coincident with first hours of DLPI sampling to take into account the deposition time of dust particles (Cachorro et al., 2008; Mukai et al., 2007).
Similarly, anthropogenic loading from North-Eastern Europe air masses transport
results in distribution with the accumulation mode at about 0.3µm dominating on the
25
coarse one at 2.4µm as plotted in Fig. 3. Depending on the strength of transport
ACPD
9, 25565–25597, 2009Physical and optical properties of atmospheric aerosol
M. Calvello et al.
Title Page
Abstract Introduction
Conclusions References
Tables Figures
◭ ◮
◭ ◮
Back Close
Full Screen / Esc
Printer-friendly Version
Interactive Discussion
shown for the representative day of 28/29 July in Fig. 4a together with NAAPS map for sulphate concentration that is very high over our area. For 25/26 June in particular, mixed anthropogenic, smoke and dust aerosols are responsible for both modes to be very intense. As shown in Fig. 4b, on 4/5 August, air masses are mainly of marine origin but a strong local smoke event influences mass-size distribution leading to the
5
fine mode prevailing on the coarse one. Mass size distributions for 23/24 June, 16/17 July and 7/8 October show a prevailing fine mode less intense in comparison with days described before. In Fig. 4c, NAAPS map, for the representative case of 7/8 October, showing the absence of particular loading, has been reported. In these last cases back trajectories are mainly of marine origin. Finally, mass size distribution for 17/18
10
September is characterised by the lowest values of modal intensity both for the fine and the coarse mode. This is representative of a very back-ground situation since the measures have been preceded by a week lasted rain event that cleaned the air from aerosol burden.
3.2 Columnar properties
15
Daily averaged optical columnar properties of aerosol as measured by Ocean Optics S2000 radiometer from May to September 2008 are presented in Table 2. In particular
values of AOD at 500 nm and 780 nm together with ˚Angstr ¨om parametersα andβare
reported, each with corresponding standard deviation. For the entire analysis period
a mean value of AOD @ 500 nm of 0.26±0.01 have been registered with a maximum
20
value of 0.37±0.01 on 08 July and a minimum of 0.11±0.01 on 16 July. As regards
α, it oscillates between a minimum of 0.33±0.01 on 8 July and a maximum of 1.91 on
30 July with a mean value of 1.12±0.04. Mean AOD and α values are comparable
to those reported in literature for rural sites similar to ours. In particular, our value for AOD @ 500 nm is in the middle between a mean value of AOD @ 440 nm of about
25
0.2 (α∼1.0), reported by Toledano et al. (2007), as measured during summer months
ACPD
9, 25565–25597, 2009Physical and optical properties of atmospheric aerosol
M. Calvello et al.
Title Page
Abstract Introduction
Conclusions References
Tables Figures
◭ ◮
◭ ◮
Back Close
Full Screen / Esc
Printer-friendly Version
Interactive Discussion
basis for a rural site in the Netherlands. In the case of Toledano et al. (2007), the site is characterized by advection phenomena similar to ours (continental air masses and Saharan dust intrusions), but with a larger prevalence of marine aerosol component. Grouping days with similar optical properties and analysing back-trajectories, DREAM and NAAPS maps it is possible to identify aerosol impacting the measurement site as
5
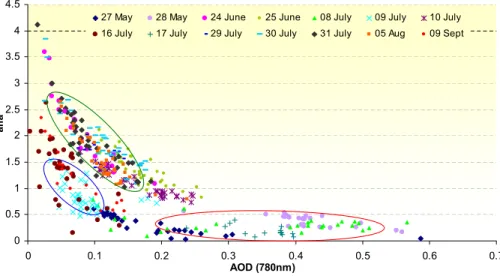
previously done with DLPI measurements. In particular Saharan dust, anthropogenic, and marine particles from transport phenomena have been detected together to back-ground aerosols, as shown in Table 3. In Fig. 5, a scatter plot of daily averaged values
of AOD @ 780 nm and α has been reported as an instrument to interpret data by
integrating information on aerosol size and loading. Almost all data points lie in three
10
different zones of the graph: points circled by the green ellipse are associated with
values of AOD @ 780 nm between 0.1 and 0.2 andα between 1.1 and 3.0 and are
related to days of continental mass loading, anthropogenic and smoke aerosols, as checked with data analysis support tools (back trajectories, NAAPS, FIRMS). Points
circled by the red ellipse with values of AOD>0.2 and values of α<0.5 are verified to
15
be related to dust events. Points circled by the blue ellipse with both low values of
AOD, <0.1 and α between 0.7 and 1.3, are related to days without heavy transport
phenomena a part from air masses coming from the sea.
In Fig. 6, spectral AOD behaviour, and corresponding number and volume
colum-nar size distributions are presented for three selected days characterized by different
20
aerosol loading. Flatter curve for AOD vs. λis found for dust episode on 8 July (a).
As regards number size distributions (b), their are unimodal Junge functions for
back-ground/marine and polluted case of 16 and 30 July, respectively. Dust size distributions
are bimodal with a coarse mode centred at 0.94µm in agreement with what found in
Pavese et al. (2009), where a transition from no-dust to dust atmospheric burden on
25
a daily basis has been highlighted. Volume size distributions (c) are dominated by fine
pres-ACPD
9, 25565–25597, 2009Physical and optical properties of atmospheric aerosol
M. Calvello et al.
Title Page
Abstract Introduction
Conclusions References
Tables Figures
◭ ◮
◭ ◮
Back Close
Full Screen / Esc
Printer-friendly Version
Interactive Discussion
ence of some smoke aerosols in transit during measurements, as annotated by the operator during radiometric measurements.
3.3 Comparing ground level and columnar size distributions
Considering only contemporary radiometric and gravimetric measurements,
agree-ment has been found in the identification of aerosol types associated with different
5
air masses history from measurements obtained with the two different instruments as
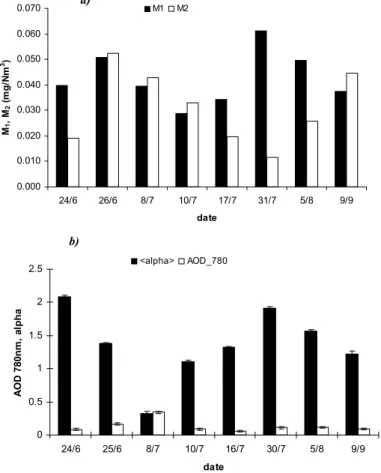
reported in Fig. 7. In Fig. 7, daily averaged columnar AOD @ 780 nm andα values
are shown together with contributions of the fine and coarse particles fractions, M1
andM2, to the surface mass size distributions. M1and M2are calculated as the sum
ofdm/dlog(D)values (Eq. 1) in the interval EAD<1µm and EAD>1µm, respectively.
10
Note that, due to the two instruments different sampling times, only diurnal hours of
DLPI sampling coincide with radiometric measurements. This could explain the poor agreement in cases where air masses undergo changes in their origins and paths
dur-ing the 24 h or where the effective coinciding hours of measurements are few. This is
the case of 8/9 September when very different air masses transport phenomena affect
15
night and day measurements hours as we will see better later.
In other cases, days with high values ofαparameter and intermediate values of AOD
@ 780 nm measured over the atmospheric column, identified in Fig. 5 as the points circled by the green ellipse, correspond to higher fraction of small particles measured at ground by DLPI (23/24 June, 30/31 July and 4/5 August). For dust event of 7/8 July, high
20
value of AOD @ 780 nm (0.34±0.04) and minimum value of α parameter (0.33±0.01)
correspond to an enhancement of coarse/small particles ratio measured at the ground.
For 25/26 June both higher values ofα parameter (1.38±0.02) and AOD (0.17±0.01
@780 nm) together with both intense mode for surface mass size distribution suggest
an aerosol mixing with different components summing up in a substantial loading. Days
25
such as 9/10 July and 16/17 July, with intermediate values ofα (0.82±0.02 for 9 July
and 1.33±0.04 for 16 July) and low value of AOD @ 780 nm (0.09±0.01 for 9 July and
ACPD
9, 25565–25597, 2009Physical and optical properties of atmospheric aerosol
M. Calvello et al.
Title Page
Abstract Introduction
Conclusions References
Tables Figures
◭ ◮
◭ ◮
Back Close
Full Screen / Esc
Printer-friendly Version
Interactive Discussion
between maximum values of 25/26 June and minimum values of 17/18 September (see Fig. 3).
To analyze thoroughly the relation between columnar and surface data, values of
effective ray from radiometric derived volume size distributions have been converted to
EAD assuming spherical particles and known values of density. In particular an
aver-5
age value of 1.5 g cm−3 have been assumed for density of fine particles as assessed
in Kannosto et al. (2008) with a study on mode resolved density of fine aerosols par-ticles. This value is the same reported in other correlated studies (McMurry et al.,
2002; Saarikoski et al., 2005; Virtanen et al., 2006). A mean value of 2 g cm−3 has
been used for coarse particles according to the work of Tegen et al. (2006), where
10
the authors used this value to model dust particles starting from experimental data. In
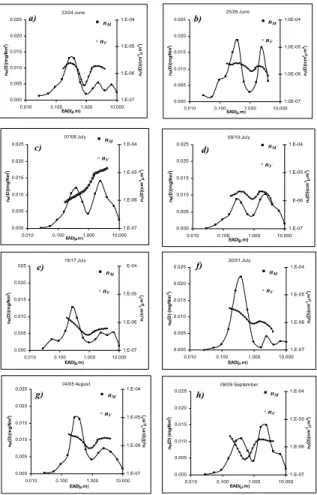
Fig. 8, columnar volume size distributionsnv(D) and mass size distributions at ground
levelnM(D) have been plotted for days of contemporary measurements. It is important
to point out that for columnar distributions mean daily values have been considered.
Another noteworthy aspect to be considered is the different dimensional range extent
15
between radiometric and DLPI data since the reliability of radiometric inversion
tech-nique is limited to the 0.1–3.0µm dimensional range whereas impactor distributions
extend from 0.03µm to 10µm. Looking at Fig. 8, a first remark is about the case of
dust episode of 7/8 July (c) when coarse mode prevalence is more evident for radio-metric measurement than for impactor one. Referring to Sect. 3.1, this is the case of
20
an almost constant transport from Sahara during the 24 h, without substantial changes between contemporary and no-contemporary measurement hours. Notwithstanding
this, high dust layers seem to affect columnar data in a more intense way than surface
ones. This allows to agree with Smirnov et al. (2000), in the definition of a Saharan
Air Layer (SAL) not always affecting low atmospheric layers. In Pace et al. (2006)
25
ACPD
9, 25565–25597, 2009Physical and optical properties of atmospheric aerosol
M. Calvello et al.
Title Page
Abstract Introduction
Conclusions References
Tables Figures
◭ ◮
◭ ◮
Back Close
Full Screen / Esc
Printer-friendly Version
Interactive Discussion
from Africa with ending altitude of 3500–6000 m as verified from Hysplit model. These dust aerosols poorly contribute to the coarse mode of DLPI distribution also for the delay in deposition at ground. Mixing situation of 25/26 June (b) has been revealed by the two instruments with the fine and coarse modes amplitude of about the same magnitude measured both at ground and on the column. The same is for 9/10 July (d)
5
even with a lower aerosol loading. For 8/9 September (h) there is a huge difference in
air masses paths between diurnal and nocturnal hours. DLPI measurement in fact, is influenced by a contribution of air masses arriving from Africa that is almost completely absent in radiometric measurement. For 16/17 July (e), 30/31 July (f) and 4/5 (g) Au-gust both ground and columnar distributions show a fine mode dominating the coarse
10
one but with modal diameters for the fine fraction shifted to lower values in the case of columnar data. This could be explained by two reasons. First, in the case where
aerosol loading is mainly attributed to fine particles, using a mean value of 1.5 g cm−3
for the density of fine particles leads to an overestimation of the true value. Second
cause is the effective difference between concentrations at ground and over the
col-15
umn. This is due to the fact that anthropogenic loading events are often originated by sources near the ground, this being in some cases the main component of aerosols sampled at ground but not so important when data are integrated on the atmospheric column as for radiometric measurements (Gerasopoulos et al., 2007). On the other side, for these three days, fire smoke aerosols transported at high altitude (Lyamani et
20
al., 2008; Pietruczuk and Chaikovsky, 2007) cause columnar measurements to reveal a larger amount of fly ash fine particles.
3.4 Black carbon concentrations
Figure 9 shows hourly averaged values of 7-wavelenghts (λ=370, 470, 520, 590, 660,
880, 950 nm) BC concentrations for some selected periods between May 2008 to
Au-25
gust 2008 almost coinciding with periods analysed for radiometric and DLPI
measure-ments. In particular daily variations are reported from 27 May to 5 June (a), from 18
ACPD
9, 25565–25597, 2009Physical and optical properties of atmospheric aerosol
M. Calvello et al.
Title Page
Abstract Introduction
Conclusions References
Tables Figures
◭ ◮
◭ ◮
Back Close
Full Screen / Esc
Printer-friendly Version
Interactive Discussion
most of the working days (Monday to Thursday), by two peaks with concentrations
values @ 880 nm between 2000 and 4000 ng/m3: one in the morning between 7:00
and 08:00 UTC and one in the evening between 17:00 to 20:00 UTC. A more variable behaviour has been found for week-end days without definite modes and with overall
lower concentrations of about 2000 ng/m3at maximums. This suggests that local traffic
5
is the main source of black-carbon at the site. Looking at panelc, it is possible to note
that daily trends are lost due to the strong smoke/pollution long-range transport event registered from 29 July to 0 August and described before (see Sect. 3.1 and 3.2). For
this period minimum threshold is shifted to higher values of about 1000 ng/m3 also for
week-end days.
10
Considering only contemporary measurements, in graphic in Fig. 10, temporal
vari-ation of daily averaged values ofn1 (columnar fine fraction particle concentration) as
obtained from radiometric measurements, of BC (surface black carbon concentration
@ 800 nm) as measured by aethalometer, and ofM1 (surface fine fraction mass) as
obtained from DLPI measurements, are reported. Note that for DLPI and
aethalome-15
ter sampling, averages are calculated over 24 h, whereas for radiometer only diurnal
measurements are available. Lower values of M1, n1 and BC are found during dust
event (8 July) and for back-ground aerosol condition (9 and 16 July). Maximum values correspond to anthropogenic loading due to air masses transport from Eastern Europe (25 June and 30 July). For these days BC local component is enhanced by polluted
20
incoming aerosol particles.
4 Conclusions
Atmospheric aerosol optical and physical properties have been studied with the com-bined use of in-situ (impactor and aethalometer) and radiometric remote sensing mea-surements in a semi-rural site in Southwest Italy from May to October 2008. Analysis of
25
different types of data obtained allowed to coherently characterize atmospheric aerosol
asso-ACPD
9, 25565–25597, 2009Physical and optical properties of atmospheric aerosol
M. Calvello et al.
Title Page
Abstract Introduction
Conclusions References
Tables Figures
◭ ◮
◭ ◮
Back Close
Full Screen / Esc
Printer-friendly Version
Interactive Discussion
ciated with variation of transport phenomena. In particular dust episodes have been simultaneously identified from optical radiometric derived properties, with a maximum
daily averaged value of AOD @ 780 nm and minimum value ofα parameter, and from
mass size distributions measured at the ground, with the coarse fraction prevailing on the fine one. In the case of pollution events associated with continental air masses
5
coming from East Europe, an enhancement of α parameter and of AOD @ 500 nm,
corresponds to a fine fraction dominant on the coarse one for distributions measured at ground.
Further, considering aethalometer measurements, increased values of BC concen-tration have been found for transported anthropogenic aerosol. For these cases, daily
10
trends characterized by two peaks for most of the working days and no definite modes plus overall lower concentrations, for week-end days, are lost. In particular, minimum
concentration threshold is shifted to higher values of about 1000 ng/m3also for
week-end days. Daily trweek-end for the working days suggests that local traffic (a main road
passes at a distance of about 1 km) is the main source of black-carbon at the site.
15
A direct comparison between impactor mass-size distributions and columnar volume size distributions has been performed to complete the study of integrated data. In the case of Saharan dust event, dust particles seem to dominate aerosol optical proper-ties within the column: comparison with in-situ measurements reveals in this case an underestimate in coarse particles detection at ground level. For anthropogenic
trans-20
ported and local produced aerosol, a better agreement is found suggesting that in this case, surface aerosols optical properties dominate columnar integrated data.
Limitation in correlating surface and columnar measurements has been represented
in our work by instruments different sampling times and conditions, since only diurnal
hours of DLPI sampling coincide with radiometric measurements. This taken into
ac-25
count, from obtained results it has been possible to study links between aerosol in the near-ground layer of the atmosphere and aerosol over the column also in cases when
different layers of aerosol at different heights are present, thus reducing degrees of
ACPD
9, 25565–25597, 2009Physical and optical properties of atmospheric aerosol
M. Calvello et al.
Title Page
Abstract Introduction
Conclusions References
Tables Figures
◭ ◮
◭ ◮
Back Close
Full Screen / Esc
Printer-friendly Version
Interactive Discussion
On the whole, representativeness of ground-level data for columnar ones has been verified, in agreement with what found in Mukai et al. (2007), Schaap et al. (2009) and Sch ¨afer et al. (2008).
The necessity in expanding spatial and temporal coverage for integrated measure-ments represents a stimulus to extend the database to include seasonal patterns of
5
aerosol properties.
References
Baron, P. A. and Willeke, K.: Aerosol Measurements. Principles, Techniques, and Application, Wiley & Sons, Inc., New York, USA, 2001.
Cachorro, V. E., Toledano, C., Prats, N., Sorribas, M., Mogo, S., Berj ´on, A., Torres, B.,
Ro-10
drigo, R., de la Rosa, J., and De Frutos, A. M.: The strongest desert dust intrusion mixed with smoke over the Iberian Peninsula registered with Sun photometry, J. Geophys. Res., 113, D14S04, doi:10.1029/2007JD009582, 2008.
Chaudhry, Z., Vanderlei Martins, J., Li, Z., Tsay, S., Chen, H., Wang, P., Wen, T., Li, C., and Dickerson, R. R.: In situ measurements of aerosol mass concentration and
ra-15
diative properties in Xianghe, southeast of Beijing, J. Geophys. Res., 112, D23S90, doi:10.1029/2007JD009055, 2007.
Cheng, T., Zhang, R., Han, Z., and Fang, W.: Relationship between ground-based particle component and column aerosol optical property in dusty days over Beijing, Geophys. Res. Lett., 35, L20808, doi:10.1029/2008GL035284, 2008.
20
Choi, I., Kim, S., Kim, J., Yoon, S., Kim, M., Sugimoto, N., Kondo, Y., Miyazaki, Y., Moon, K., and Han, J.: Characteristics of the transport and vertical structure of aerosols during ABC-EAREX2005, Atmos. Environ., 42, 8513–8523, 2008.
Chuaybamroong, P., Wu, C., and Lundgren, D. A.: Aerosol source sampling in a mid-scale city, Gainesville, FL, Aerosol Air Qual. Res., 6, 213–230, 2006.
25
ACPD
9, 25565–25597, 2009Physical and optical properties of atmospheric aerosol
M. Calvello et al.
Title Page
Abstract Introduction
Conclusions References
Tables Figures
◭ ◮
◭ ◮
Back Close
Full Screen / Esc
Printer-friendly Version
Interactive Discussion
Collaud Coen, M., Weingartner, E., Apituley, A., Ceburnis, D., Flentje, H., Henzing, J. S., Jen-nings, S. G., Moerman, M., Petzold, A., Schmidhauser, R., Schmid, O., and Baltensperger, U.: Minimizing light absorption measurement artifacts of the Aethalometer: evaluation of five correction algorithms, Atmos. Meas. Tech. Discuss., 2, 1725–1770, 2009,
http://www.atmos-meas-tech-discuss.net/2/1725/2009/.
5
Draxler, R. R. and Rolph, G. D.: HYSPLIT (Hybrid Single-Particle Lagrangian Integrated Tra-jectory) model, online available at: http://www.arl.noaa.gov/ready/hysplit4.html, NOAA Air Resour. Lab., Silver Spring, MD, 2003.
Eleftheriadis, K., Colbeck, I., Housiadas, C., Lazaridis, M., Mihalopoulos, N., Mitsakou, C., Smolik, J., and Zdimal, V.: Size distribution composition and origin of the submicron aerosol
10
in the marine boundary layer during the Eastern Mediterranean “SUB-AERO” experiment, Atmos. Environ., 40, 6245–6260, 2006.
Esposito, F., Leone, L., Pavese, G., Restieri, R., and Serio, C.: Seasonal variation of aerosol
properties in South Italy: a study on aerosol optical depths, ˚Angstr ¨om turbidity parameters
and aerosol size distributions, Atmos. Environ., 38, 1605–1614, 2004.
15
Gerasopoulos, E., Koulouri, E., Kalivitis, N., Kouvarakis, G., Saarikoski, S., M ¨akel ¨a, T., Hillamo, R., and Mihalopoulos, N.: Size-segregated mass distributions of aerosols over Eastern Mediterranean: seasonal variability and comparison with AERONET columnar size-distributions, Atmos. Chem. Phys., 7, 2551–2561, 2007,
http://www.atmos-chem-phys.net/7/2551/2007/.
20
IPCC: Intergovernmental Panel on Climate Change, Climate Change 2007: The Physical Sci-ence Basis: Contribution of Working Group I to the Fourth Assessment Report of the Inter-governmental Panel on Climate Change, Cambridge University Press, Cambridge, 2007. Kannosto, J., Virtanen, A., Lemmetty, M., M ¨akel ¨a, J. M., Keskinen, J., Junninen, H., Hussein, T.,
Aalto, P., and Kulmala, M.: Mode resolved density of atmospheric aerosol particles, Atmos.
25
Chem. Phys., 8, 5327–5337, 2008,
http://www.atmos-chem-phys.net/8/5327/2008/.
Lyamani, H., Olmo, F. J., and Alados-Arboledas, L.: Saharan dust outbreak over southeastern Spain as detected by sun photometer, Atmos. Environ., 39, 7276–7284, 2005.
Lyamani, H., Olmo, F. J., and Alados-Arboledas, L.: Light scattering and absorption properties
30
of aerosol particles in the urban environment of Granada, Spain, Atmos. Environ., 42, 2630– 2642, 2008.
ACPD
9, 25565–25597, 2009Physical and optical properties of atmospheric aerosol
M. Calvello et al.
Title Page
Abstract Introduction
Conclusions References
Tables Figures
◭ ◮
◭ ◮
Back Close
Full Screen / Esc
Printer-friendly Version
Interactive Discussion
temporal variability of aerosol: size distribution and optical properties, Atmos. Res., 66, 1–19, 2003.
McMurry, P., Wang, X., Park, K., and Ehara, K.: The relationship between mass and mobility for atmospheric particles: A new technique for measuring particle density, Aerosol Sci. Tech., 36, 227–238, 2002.
5
Mukai, S., Sano, I., Mukai, M., and Yasumoto, M.: Evaluation of air quality from space, in: Proceedings of SPIE – The International Society for Optical Engineering, 6745, 67451X.1– 67451X.8, 2007.
Mukai, S., Sano, I., Satoh, M., and Holben, B. N.: Aerosol properties and air pollutants over an urban area, Atmos. Res., 82, 643–651, 2006.
10
Pace, G., di Sarra, A., Meloni, D., Piacentino, S., and Chamard, P.: Aerosol optical properties at
Lampedusa (Central Mediterranean). 1. Influence of transport and identification of different
aerosol types, Atmos. Chem. Phys., 6, 697–713, 2006, http://www.atmos-chem-phys.net/6/697/2006/.
Park, S. and Kim, J.: Aerosol size distributions observed at the Seoul National University
cam-15
pus in Korea during the Asian dust and no-dust periods, Atmos. Environ., 40, 1722–1730, 2006.
Pavese, G., De Tomasi, F., Calvello, M., Esposito, F., and Perrone, M. R.: Detection of Sahara dust intrusions during mixed advection patterns over south-east Italy: A case study, Atmos. Res., 92, 489–504, 2009.
20
Perrone, M. R., Santese, M., Tafuro, A. M., Holben, B., and Smirnov, A.: Aerosol load charac-terization over South–East Italy for one year of AERONET sun-photometer measurements, Atmos. Res., 75, 111–133, 2005.
Pietruczuk, A. and Chaikovsky, A. P.: Properties of fire smoke in Eastern Europe measured by remote sensing method, in: Proceedings of SPIE – The International Society for Optical
25
Engineering, 6745, 67451T.1–67451T.10, 2007.
Saarikoski, S., M ¨akel ¨a, T., Hillamo, R., Aalto, P., Kerminen, V., and Kulmala, M.: Physico-chemical characterization and mass closure of size-segregated atmospheric aerosols in Hyyti ¨al ¨a, Finland, Boreal Environ. Res., 10, 385–400, 2005.
Salma, I., Dal Maso, M., Kulmala, M., and Z ´aray, G.: Modal characteristics of particulate matter
30
in urban atmospheric aerosols, Microchem. J., 73, 19–26, 2002.
Schaap, M., Apituley, A., Timmermans, R. M. A., Koelemeijer, R. B. A., and de Leeuw, G.:
ACPD
9, 25565–25597, 2009Physical and optical properties of atmospheric aerosol
M. Calvello et al.
Title Page
Abstract Introduction
Conclusions References
Tables Figures
◭ ◮
◭ ◮
Back Close
Full Screen / Esc
Printer-friendly Version
Interactive Discussion
Atmos. Chem. Phys., 9, 909–925, 2009, http://www.atmos-chem-phys.net/9/909/2009/.
Sch ¨afer, K., Harbusch, A., Emeis, S., Koepke, P., and Wiegner, M.: Correlation of aerosol mass near the ground with aerosol optical depth during two seasons in Munich, Atmos. Environ., 42, 4036–4046, 2008.
5
Smirnov, A., Holben, B. N., Kaufman, Y. J., Dubovik, O., Eck, T. F., Slutsker, I., Pietras, C., and Halthore, R.: Optical properties of atmospheric aerosol in maritime environments, J. Atmos. Sci., 59, 501–503, 2002.
Smirnov, A., Holben, B. N., Savoie, D., Prospero, J. M., Kaufman, Y. J., Tanre, D., Eck, T. F., and Slutsker, I.: Relationship between column aerosol optical thickness and in situ ground
10
based dust concentrations over Barbados, Geophys. Res. Lett., 27, 1643–1646, 2000. Snyder, D. C. and Schauer, J. J.: An Inter-Comparison of Two Black Carbon Aerosol
Instru-ments and a Semi-Continuous Elemental Carbon Instrument in the Urban Environment, Aerosol Sci. Tech., 41(5), 463–474, 2007.
Tegen, I., Heinold, B., Todd, M., Helmert, J., Washington, R., and Dubovik, O.: Modelling soil
15
dust aerosol in the Bodl depression during the BoDEx campaign, Atmos. Chem. Phys., 6, 4345–4359, 2006,
http://www.atmos-chem-phys.net/6/4345/2006/.
Toledano, C., Cachorro, V. E., Berjon, A., de Frutos, A. M., Sorribas, M., de la Morena, B. A.,
and Goloub, P.: Aerosol optical depth and ˚Angstr ¨om exponent climatology at El Arenosillo
20
AERONET site (Huelva, Spain), Q. J. Roy. Meteor. Soc., 133, 795–807, 2007.
Virtanen, A., R ¨onkk ¨o, T., Kannosto, J., Ristim ¨aki, J., M ¨akel ¨a, J. M., Keskinen, J., Pakkanen, T., Hillamo, R., Pirjola, L., and H ¨ameri, K.: Winter and summer time size distributions and
densities of traffic-related aerosol particles at a busy highway in Helsinki, Atmos. Chem.
Phys., 6, 2411–2421, 2006,
25
ACPD
9, 25565–25597, 2009Physical and optical properties of atmospheric aerosol
M. Calvello et al.
Title Page
Abstract Introduction
Conclusions References
Tables Figures
◭ ◮
◭ ◮
Back Close
Full Screen / Esc
Printer-friendly Version
Interactive Discussion Table 1. Modal EAD values for mass size distributions derived from impactor sampling. Dates
in the table are reported considering first and second day of each 24 h sampling.
Date EAD (µm) EAD (µm) EAD (µm) EAD (µm)
Mode 0 Mode 1 Mode 2 Mode 3
18/19 Jun 0.093 0.387 2.393
23/24 Jun 0.327 2.401 6.615
24/25 Jun 0.093 0.388 2.404
7/8 Jul 0.387 2.398 6.539
9/10 Jul 0.266 2.404 6.615
14/15 Jul 0.093 0.266 2.401
16/17 Jul 0.055 0.266 2.401 6.615
28/29 Jul 0.093 0.388 1.606 6.606
30/31 Jul 0.388 2.401 6.606
4/5 Aug 0.327 2.401
8/9 Sep 0.055 0.387 2.395 6.587
17/18 Sep 0.055 0.265 2.372
ACPD
9, 25565–25597, 2009Physical and optical properties of atmospheric aerosol
M. Calvello et al.
Title Page
Abstract Introduction
Conclusions References
Tables Figures
◭ ◮
◭ ◮
Back Close
Full Screen / Esc
Printer-friendly Version
Interactive Discussion Table 2. Mean daily values of AOD (@ 500 and 780 nm), ofαandβ parameters. Values of
standard deviationσare reported.
Date hAODi±σ hAODi±σ hαi±σ hβi±σ
(500 nm) (780 nm)
27 May 0.20±0.01 0.18±0.02 0.34±0.02 0.16±0.02
28 May 0.51±0.01 0.42±0.05 0.39±0.01 0.39±0.02
24 Jun 0.20±0.01 0.08±0.03 1.90±0.03 0.06±0.01
25 Jun 0.31±0.01 0.17±0.03 1.38±0.02 0.12±0.02
8 Jul 0.37±0.01 0.34±0.04 0.33±0.01 0.30±0.01
9 Jul 0.13±0.01 0.09±0.03 0.82±0.02 0.07±0.02
10 Jul 0.26±0.01 0.16±0.04 1.11±0.02 0.12±0.01
16 Jul 0.11±0.01 0.06±0.03 1.33±0.04 0.05±0.02
17 Jul 0.38±0.01 0.35±0.11 0.19±0.02 0.34±0.01
29 Jul 0.24±0.01 0.10±0.04 1.70±0.03 0.07±0.01
30 Jul 0.26±0.01 0.11±0.03 1.91±0.02 0.08±0.02
31 Jul 0.21±0.01 0.09±0.03 1.89±0.03 0.06±0.02
5 Aug 0.22±0.01 0.11±0.03 1.56±0.02 0.08±0.01
6 Aug 0.44±0.02 0.36±0.06 0.34±0.01 0.34±0.02
ACPD
9, 25565–25597, 2009Physical and optical properties of atmospheric aerosol
M. Calvello et al.
Title Page
Abstract Introduction
Conclusions References
Tables Figures
◭ ◮
◭ ◮
Back Close
Full Screen / Esc
Printer-friendly Version
Interactive Discussion Table 3.Aerosol classification based on different AOD (@ 500 and 780 nm) andαandβrange
of variations.
Parameters Saharan dust Anthropogenic Back-ground/marine
AOD (500 nm) 0.37–0.51 0.2–0.31 <0.2
AOD (780 nm) 0.34–0.42 0.08–0.17 0.06–0.09
α 0.19–0.39 1.11–2.09 0.7–1.3
ACPD
9, 25565–25597, 2009Physical and optical properties of atmospheric aerosol
M. Calvello et al.
Title Page
Abstract Introduction
Conclusions References
Tables Figures
◭ ◮
◭ ◮
Back Close
Full Screen / Esc
Printer-friendly Version
Interactive Discussion 0.000
0.005 0.010 0.015 0.020
0.010 0.100 1.000 10.000 100.000
EAD(µm)
d
m
/d
lo
g
(D
)(
m
g
/N
m
3)
18/19 June 07/08 July 09/10 July 14/15 July 08/09 Sept
Fig. 1. Mass size distributions at ground level from DLPI data for 18/19 June, 7/8, 9/10 July,
and 14/15 July and 8/9 September. Coarse mode at 2.4µm prevails on accumulation mode at
ACPD
9, 25565–25597, 2009Physical and optical properties of atmospheric aerosol
M. Calvello et al.
Title Page
Abstract Introduction
Conclusions References
Tables Figures
◭ ◮
◭ ◮
Back Close
Full Screen / Esc
Printer-friendly Version
Interactive Discussion
b) a)
Fig. 2. (a)Back-Trajectories for 18 June at 10:00 UTC and 20:00 UTC and DREAM map for
12:00 UTC of the same day. (b)Back-Trajectories for 9 July at 09:00 UTC and 20:00 UTC and
ACPD
9, 25565–25597, 2009Physical and optical properties of atmospheric aerosol
M. Calvello et al.
Title Page
Abstract Introduction
Conclusions References
Tables Figures
◭ ◮
◭ ◮
Back Close
Full Screen / Esc
Printer-friendly Version
Interactive Discussion
0.000 0.005 0.010 0.015 0.020 0.025
0.010 0.100 1.000 10.000 100.000
EAD(µm)
dm
/d
lo
g(
D
)(
m
g/
N
m
3 )
23/24 June 25/26 June 16/17 July 28/29 July
30/31 July 04/05 Aug 17/18 Sept 07/08 Oct
Fig. 3.Mass size distributions at ground level from DLPI data for 23/24 and 25/26 June, 16/17, 28/29 and 30/31 July, 4/5 August, 17/18 September and 7/8 October. Accumulation mode at
ACPD
9, 25565–25597, 2009Physical and optical properties of atmospheric aerosol
M. Calvello et al.
Title Page
Abstract Introduction
Conclusions References
Tables Figures
◭ ◮
◭ ◮
Back Close
Full Screen / Esc
Printer-friendly Version
Interactive Discussion
c) b)
a)
Fig. 4. (a) Back-Trajectories and NAAPS maps for sulphate concentrations for 29 July at
00:00 UTC. (b) Back-Trajectories, NAAPS maps for smoke concentrations and FIRMS map
ACPD
9, 25565–25597, 2009Physical and optical properties of atmospheric aerosol
M. Calvello et al.
Title Page
Abstract Introduction
Conclusions References
Tables Figures
◭ ◮
◭ ◮
Back Close
Full Screen / Esc
Printer-friendly Version
Interactive Discussion 0
0.5 1 1.5 2 2.5 3 3.5 4 4.5
0 0.1 0.2 0.3 0.4 0.5 0.6 0.7
AOD (780nm)
al
fa
27 May 28 May 24 June 25 June 08 July 09 July 10 July
16 July 17 July 29 July 30 July 31 July 05 Aug 09 Sept
ACPD
9, 25565–25597, 2009Physical and optical properties of atmospheric aerosol
M. Calvello et al.
Title Page
Abstract Introduction
Conclusions References
Tables Figures
◭ ◮
◭ ◮
Back Close
Full Screen / Esc
Printer-friendly Version
Interactive Discussion
0.05 0.09 0.13 0.17 0.21 0.25 0.29 0.33 0.37
450 500 550 600λ(µm )650 700 750 800
AO
D
08 July 08 16-lug 30 July 08
a)
α = 1.45± 0.02
α = 0.61± 0.01 α = 1.75 ± 0.02
1.E-07 1.E-06 1.E-05
0.1 1 10
r (µm)
dV
/d
r
7/8 (dust)
7/16 (back-ground & marine) 7/30 ( pollutted/smoke) 1.E-02
1.E-01 1.E+00 1.E+01 1.E+02 1.E+03 1.E+04 1.E+05
0.1 1 10
r(µm)
dn
/dr
7/8 (dust)
7/16 (background & marine) 7/30 (pollutted/smoke)
c) b)
Fig. 6. (a)AOD vs. λfor three selected days characterized by different aerosol loading: (∆)
dust, (×) back-ground and marine, (♦) pollutted/smoke. Alpha value for each curve is reported
in the graph. (b)Daily mean columnar number size distributions for the three selected days.
ACPD
9, 25565–25597, 2009Physical and optical properties of atmospheric aerosol
M. Calvello et al.
Title Page
Abstract Introduction
Conclusions References
Tables Figures
◭ ◮
◭ ◮
Back Close
Full Screen / Esc
Printer-friendly Version
Interactive Discussion
0.000 0.010 0.020 0.030 0.040 0.050 0.060 0.070
24/6 26/6 8/7 10/7 17/7 31/7 5/8 9/9
date
M1
, M
2
(m
g
/N
m
3)
M1 M2
a)
0 0.5 1 1.5 2 2.5
24/6 25/6 8/7 10/7 16/7 30/7 5/8 9/9
date
A
O
D
78
0n
m
, a
lp
h
a
<alpha> AOD_780
b)
Fig. 7. (a)Temporal variation ofM1andM2for days of contemporary measurements by DLPI
and radiometer.M1andM2correspond to the sum ofdm/dlog(D)(Eq. 1) values in the interval
EAD<1µm and EAD>1µm, respectively. Dates in the graph(a)refer to the second day of the
24 h impactor sampling.(b)Temporal variation of daily averaged values of AOD @ 780 nm and
ACPD
9, 25565–25597, 2009Physical and optical properties of atmospheric aerosol
M. Calvello et al.
Title Page Abstract Introduction Conclusions References Tables Figures ◭ ◮ ◭ ◮ Back Close
Full Screen / Esc
Printer-friendly Version Interactive Discussion 25/26 June 0.000 0.005 0.010 0.015 0.020 0.025
0.010 0.100 1.000 10.000
EAD(µm) nM (D )(mg /N m 3) 1.0E-07 1.0E-06 1.0E-05 1.0E-04 nV (D )(c m 3µ m 2)
▪ nM
◦nV
b) 23/24 June 0.000 0.005 0.010 0.015 0.020 0.025
0.010 0.100 1.000 10.000
EAD(µm) nM (D )(m g /N m 3) 1.E-07 1.E-06 1.E-05 1.E-04 nV (D )( c m -3µ m 2)
▪ nM
◦nV
a)
d)
▪ nM
◦nV1.
09/10 July 0.000 0.005 0.010 0.015 0.020 0.025
0.010 0.100 1.000 10.000
EAD(µm)
n M (D )( m g /N m 3) 1.E-07 E-06 1.E-05 1.E-04 n V (D )( c m -3µ m 2)
d) ▪ nM
◦nV
c) ▪ nM
◦nV
07/08 July 0.000 0.005 0.010 0.015 0.020 0.025
0.010 0.100 1.000 10.000
EAD(µm )
n M (D )( m g /N m 3) 1.E-07 1.E-06 1.E-05 1.E-04 nV (D )(c m -3µ m 2)
c) ▪
nM
◦nV
0. 1. 16/17 July 0.000 0.005 0.010 0.015 0.020 025
0.010 0.100 1.000 10.000
EAD(µm)
n M (D )(m g /N m 3) 1.E-07 1.E-06 1.E-05 E-04 n v (c m -3µ m 2) ▪ nM
◦nV
e) 30/31 July 0.000 0.005 0.010 0.015 0.020 0.025
0.010 0.100 1.000 10.000
EAD(µm)
n M (D ) (mg /N m -3) 1.E-07 1.E-06 1.E-05 1.E-04 nV (D )(c m -3µ m 2)
▪ nM
◦nV
f) 04/05 August 0.000 0.005 0.010 0.015 0.020 0.025
0.010 0.100 1.000 10.000
EAD(µm)
n M (D )( m g /N m 3) 1.E-07 1.E-06 1.E-05 1.E-04 nV (D )( c m -3µ m 2)
g) ▪nM
◦nV
08/09 September 0.000 0.005 0.010 0.015 0.020 0.025
0.010 0.100 1.000 10.000
EAD(µm)
n M (D ) (m g /N m 3) 1.E-07 1.E-06 1.E-05 1.E-04 nV (D )( c m -3µ m 2)
h) ▪ nM
◦nV
Fig. 8.Comparison of columnar volume size distributionsnV(D) (◦) and mass size distribution
at ground levelnM(D) () for 23/24 June(a), 25/26 June(b), 7/8 July(c), 9/10 July(d), 16/17
ACPD
9, 25565–25597, 2009Physical and optical properties of atmospheric aerosol
M. Calvello et al.
Title Page Abstract Introduction Conclusions References Tables Figures ◭ ◮ ◭ ◮ Back Close
Full Screen / Esc
Printer-friendly Version Interactive Discussion 0 500 1000 1500 2000 2500 3000 3500 4000 450 a) 0
27/5/08 0.00 28/5/08 0.00 29/5/08 0.00 30/5/08 0.00 31/5/08 0.00 1/6/08 0.00 2/6/08 0.00 3/6/08 0.00 4/6/08 0.00 5/6/08 0.00
date BC( n g /m 3)
UV blue green yellow red IR1 IR2
Tue Wed Thur Fri
Sat Sun
Mon (Holiday) Tue Wed
0 500 1000 1500 2000 2500 3000 3500 4000 18/6/08 0.00 19/6/08 0.00 20/6/08 0.00 21/6/08 0.00 22/6/08 0.00 23/6/08 0.00 24/6/08 0.00 25/6/08 0.00 26/6/08 0.00 27/6/08 0.00 28/6/08 0.00 29/6/08 0.00 30/6/08 0.00 1/7/08 0.00 date BC( n g /m 3) 4500
b) Wed Thur Fri
Sat Sun
Mon Tue Wed Thur
Fri Sat Sun Mon 0 500 1000 1500 2000 2500 3000 3500 000 500 29/7/08 0.00 30/7/08 0.00 31/7/08 0.00
1/8/08 0.00 2/8/08 0.00 3/8/08 0.00 4/8/08 0.00 5/8/08 0.00 6/8/08 0.00 7/8/08 0.00 8/8/08 0.00
date BC( n g /m 3) 4 4
c) Tue Wed Thur Fri
Sat Sun Mon Wed Thur
Fig. 9.Hourly averaged values of 7-wavelenghts (λ=370, 470, 520, 590, 660, 880, 950 nm) BC concentrations for three selected period between May 2008 to August 2008: 27 May–5 June
ACPD
9, 25565–25597, 2009Physical and optical properties of atmospheric aerosol
M. Calvello et al.
Title Page
Abstract Introduction
Conclusions References
Tables Figures
◭ ◮
◭ ◮
Back Close
Full Screen / Esc
Printer-friendly Version
Interactive Discussion
0.E+00 5.E+02 1.E+03 2.E+03 2.E+03 3.E+03
16/6 26/6 6/7 16/7 26/7 5/8 15/8 25/8 4/9 14/9
date
n1
(c
m
-3),
B
C
(n
g
/m
3)
0.000 0.010 0.020 0.030 0.040 0.050 0.060 0.070
M1
(m
g
/N
m
3)
n1
BC
M1
Fig. 10.Temporal variations ofn1(daily averaged columnar fine fraction particle concentration),
of BC (daily averaged surface black carbon concentration, 800 nm), and ofM1(daily averaged