ACPD
14, 20617–20646, 2014Aerosol composition and sources during the Chinese Spring
Festival
Q. Jiang et al.
Title Page
Abstract Introduction
Conclusions References
Tables Figures
◭ ◮
◭ ◮
Back Close
Full Screen / Esc
Printer-friendly Version Interactive Discussion
Discussion
P
a
per
|
Discus
sion
P
a
per
|
Discussion
P
a
per
|
Discussion
P
a
per
|
Atmos. Chem. Phys. Discuss., 14, 20617–20646, 2014 www.atmos-chem-phys-discuss.net/14/20617/2014/ doi:10.5194/acpd-14-20617-2014
© Author(s) 2014. CC Attribution 3.0 License.
This discussion paper is/has been under review for the journal Atmospheric Chemistry and Physics (ACP). Please refer to the corresponding final paper in ACP if available.
Aerosol composition and sources during
the Chinese Spring Festival: fireworks,
secondary aerosol, and holiday e
ff
ects
Q. Jiang1,3, Y. L. Sun1,2, Z. Wang1, and Y. Yin2,3 1
State Key Laboratory of Atmospheric Boundary Layer Physics and Atmospheric Chemistry, Institute of Atmospheric Physics, Chinese Academy of Sciences, Beijing 100029, China
2
Collaborative Innovation Center on Forecast and Evaluation of Meteorological Disasters, Nanjing University of Information Science & Technology, Nanjing 210044, China
3
Key Laboratory for Aerosol-Cloud-Precipitation of China Meteorological Administration, Nanjing University of Information Science & Technology, Nanjing 210044, China
Received: 12 June 2014 – Accepted: 4 August 2014 – Published: 11 August 2014
Correspondence to: Y. L. Sun ([email protected])
ACPD
14, 20617–20646, 2014Aerosol composition and sources during the Chinese Spring
Festival
Q. Jiang et al.
Title Page
Abstract Introduction
Conclusions References
Tables Figures
◭ ◮
◭ ◮
Back Close
Full Screen / Esc
Printer-friendly Version Interactive Discussion
Discussion
P
a
per
|
Discus
sion
P
a
per
|
Discussion
P
a
per
|
Discussion
P
a
per
|
Abstract
Aerosol particles were characterized by an Aerodyne Aerosol Chemical Speciation Monitor (ACSM) along with various collocated instruments in Beijing, China to inves-tigate the aerosol composition and sources during the Chinese Spring Festival, 2013. Three fireworks (FW) events exerting significant and short-term impacts on fine
par-5
ticles (PM2.5) were observed on the days of Lunar New Year, Lunar Fifth Day, and
Lantern Festival. The FW showed major impacts on non-refractory potassium, chlo-ride, sulfate, and organics in PM1, of which the FW organics appeared to be mainly
secondary with its mass spectrum resembling to that of secondary organic aerosol (SOA). Pollution events (PEs) and clean periods (CPs) alternated routinely throughout
10
the study. Secondary particulate matter (SPM=SOA+sulfate+nitrate+ammonium) dominated PM1 accounting for 63–82 % during the nine PEs observed. The elevated
contributions of secondary species during PEs resulted in a higher mass extinction effi -ciency of PM1(6.4 m
2
g−1) than that during CPs (4.4 m2g−1). The Chinese Spring Fes-tival also provides a unique opportunity to study the impacts of reduced anthropogenic
15
emissions on aerosol chemistry in the city. The primary species showed ubiquitous re-ductions during the holiday period with the largest reduction for cooking OA (69 %), ni-trogen monoxide (54 %), and coal combustion OA (28 %). The secondary sulfate, how-ever, remained minor change, and the SOA and the total PM2.5even slightly increased. These results have significant implications that controlling local primary source
emis-20
ACPD
14, 20617–20646, 2014Aerosol composition and sources during the Chinese Spring
Festival
Q. Jiang et al.
Title Page
Abstract Introduction
Conclusions References
Tables Figures
◭ ◮
◭ ◮
Back Close
Full Screen / Esc
Printer-friendly Version Interactive Discussion
Discussion
P
a
per
|
Discus
sion
P
a
per
|
Discussion
P
a
per
|
Discussion
P
a
per
|
1 Introduction
Air pollution caused by fine particles (PM2.5) is of great concern in densely populated
megacities because of its adverse effects on human health and regional air qual-ity (Molina and Molina, 2004; Chan and Yao, 2008). The health risk of air pollution is greater than expected leading to around 7 million people’s death in 2012
accord-5
ing to the latest report by World Health Organization (http://www.who.int/mediacentre/ news/releases/2014/air-pollution/en/). The Beijing metropolitan area is one of the most populous megacities in the world with the population reaching 20.69 million by the end of 2012 (Beijing Municipal Bureau of Statistics). According to Beijing Municipal Environmental Protection Bureau, the annual average concentration of PM2.5 was
10
89.5 µg m−3 in 2013, about 2.5 times the National Ambient Air Quality Standards of China (35 µg m−3 for annual average), which indicates severe fine particle pol-lution in Beijing. As a result, extensive studies have been made recently to inves-tigate the sources of PM2.5. The results showed that secondary inorganic aerosol
(SIA=sulfate+nitrate+ammonium), coal combustion, traffic emissions (gasoline and
15
diesel), biomass burning, cooking emissions and dust are the major sources of PM2.5 (Zheng et al., 2005; Song et al., 2006; Zhang et al., 2013), and the source contributions varied significantly among different seasons. Despite this, improving air quality in Bei-jing remains a great challenge due to the very complex sources and dynamic evolution processes of aerosol particles.
20
Fine particles from various source emissions can be either primary from direct emis-sions, e.g., fossil fuel combustion and biomass burning, or secondary from atmo-spheric oxidation of gas-phase species. The fireworks (FW) is one of the most im-portant primary source that can exert significant and short-time impacts on air quality. The fireworks burning emits a large amount of gaseous pollutants, e.g., sulfur dioxide
25
(SO2) and nitrogen oxide (NOx) (Vecchi et al., 2008; Huang et al., 2012), and also
ACPD
14, 20617–20646, 2014Aerosol composition and sources during the Chinese Spring
Festival
Q. Jiang et al.
Title Page
Abstract Introduction
Conclusions References
Tables Figures
◭ ◮
◭ ◮
Back Close
Full Screen / Esc
Printer-friendly Version Interactive Discussion
Discussion
P
a
per
|
Discus
sion
P
a
per
|
Discussion
P
a
per
|
Discussion
P
a
per
|
(Moreno et al., 2007; Wang et al., 2007; Li et al., 2013). The enhanced short-term air pollution by fireworks can substantially increase health risk levels (Godri et al., 2010; Yang et al., 2014) and reduce visibility for hours (Vecchi et al., 2008). However, previ-ous studies on chemical characterization of fireworks in China were mostly based on filter measurements with a time resolution of 12 h or 24 h (Wang et al., 2007; Zhang et
5
al., 2010; Feng et al., 2012; Huang et al., 2012; Cheng et al., 2014; Zhao et al., 2014), which may have large uncertainties in accurate quantification of chemical composition of FW particles. Drewnick et al. (2006) first conducted real-time size-resolved chemical composition measurements during the New Year’s period in Mainz, Germany using an Aerodyne Time-of-Flight Aerosol Mass Spectrometer (ToF-AMS). To our knowledge,
10
there are no such real-time measurements of chemical composition of aerosol parti-cles during fireworks events in China yet, which limits our understanding on the rapid formation and evolution of fireworks events, and also their impacts on air pollution.
Secondary aerosol is of more concern compared to primary aerosol because it is formed over regional scales and exerts impacts on air quality over wider areas.
There-15
fore, extensive studies have been conducted in recent years to characterize the sources and formation mechanisms of secondary aerosol (Yao et al., 2002; Duan et al., 2006; Sun et al., 2006, 2013b; Wang et al., 2006; Guo et al., 2010; Yang et al., 2011; Zhang et al., 2013; Zhao et al., 2013). SIA was observed to contribute a large fraction of PM2.5
and played an enhanced role during haze episodes due to the faster heterogeneous
20
reactions associated with higher humidity. While SIA was relatively well characterized, secondary organic aerosol (SOA) is poorly understood. The recent deployments of Aerodyne Aerosol Mass Spectrometers (AMS) greatly improved our understanding on sources and evolution processes of organic aerosol (OA) in China, and also primary organic aerosol (POA) and SOA by positive matrix factorization (PMF) of organic mass
25
ACPD
14, 20617–20646, 2014Aerosol composition and sources during the Chinese Spring
Festival
Q. Jiang et al.
Title Page
Abstract Introduction
Conclusions References
Tables Figures
◭ ◮
◭ ◮
Back Close
Full Screen / Esc
Printer-friendly Version Interactive Discussion
Discussion
P
a
per
|
Discus
sion
P
a
per
|
Discussion
P
a
per
|
Discussion
P
a
per
|
of SOA in fine particle pollution in Beijing is not well known, in particular during win-tertime, a season with frequent occurrences of pollution episodes (Sun et al., 2013b; Zhang et al., 2014). Of particular interest, this study took place in the month with the most important holiday in China, i.e., the Spring Festival. The source emissions (e.g., traffic and cooking) had significant changes due to a large reduction of population and
5
anthropogenic activities in the city. This provides a unique opportunity to investigate how source changes affect aerosol chemistry including primary emissions and sec-ondary formation in Beijing. Although Huang et al. (2012) investigated such a holiday effect on aerosol composition and optical properties in Shanghai, the data analyses were limited by daily average composition measurements and also the significantly
10
different meteorological conditions between holiday and non-holiday periods.
In this study, an Aerosol Chemical Speciation Monitor (ACSM) along with various collocated instruments was deployed in Beijing during February 2013. The chemical composition of PM1 from fireworks is first quantified in Beijing based on the high time resolution measurements of non-refractory submicron aerosol species (organics,
sul-15
fate, nitrate, ammonium, chloride, and potassium) and black carbon. The impact of fire-works on PM pollution during Chinese Lunar New Year (LNY), Lunar Fifth Day (LFD), and Lantern Festival (LF) are investigated, and the roles of secondary formation in PM pollution are elucidated. Further, the impacts of reduced anthropogenic emissions dur-ing the holiday on primary and secondary aerosols in the city are illustrated, which has
20
significant implications for making air pollution control strategies in Beijing.
2 Experimental
2.1 Sampling site
The measurements in this study were conducted at the Institute of Atmospheric Physics (IAP), Chinese Academy of Sciences (39◦58′28′′N, 116◦22′16′′E), an urban site
lo-25
ACPD
14, 20617–20646, 2014Aerosol composition and sources during the Chinese Spring
Festival
Q. Jiang et al.
Title Page
Abstract Introduction
Conclusions References
Tables Figures
◭ ◮
◭ ◮
Back Close
Full Screen / Esc
Printer-friendly Version Interactive Discussion
Discussion
P
a
per
|
Discus
sion
P
a
per
|
Discussion
P
a
per
|
Discussion
P
a
per
|
characterization was performed from 1 February to 1 March 2013, during which three episodes with significant influences of fireworks, i.e., Lunar New Year (LNY), Lunar Fifth Day (LFD), and Lantern Festival (LF), were observed (Fig. 1). The meteorolog-ical conditions during the measurement period are reported in Fig. 1. Winds at the ground surface were generally below 2 m s−1 and temperature averaged 0.6◦C.
Rel-5
ative humidity (RH) varied periodically with higher values generally associated with higher particulate matter (PM) pollution.
2.2 Aerosol sampling
The chemical composition of non-refractory submicron aerosol particles (NR-PM1)
in-cluding organics, sulfate, nitrate, ammonium, and chloride were measured on-line by an
10
Aerodyne Aerosol Chemical Speciation Monitor (ACSM) at an approximate 15 min time intervals (Ng et al., 2011b). The ACSM shares the same aerosol sampling, vaporiza-tion and ionizavaporiza-tion modules as previous versions of AMS (Jayne et al., 2000; DeCarlo et al., 2006). However, the ACSM has no size information and also a lower sensitivity due to the use of a commercial-grade quadrupole mass analyzer (Ng et al., 2011b).
15
The advantage of the ACSM is its robustness for long-term and routine aerosol parti-cle composition measurements. A two-wavelength Aethalometer (Model AE22, Magee Scientific Corp.) was used to measure refractory black carbon (BC) that the ACSM cannot detect.
The light extinction of fine particles (bext, M m− 1
, 630 nm) was measured by a Cavity
20
Attenuated Phase Shift Spectrometer particle extinction monitor, CAPS PMex(Massoli et al., 2010). The CAPS PMexwas measured at 1 s time resolution with a precision (3σ)
of 1 M m−1. The mass concentration of PM2.5was determined by a heated Tapered
El-ement Oscillating Microbalance, TEOM, and the collocated gaseous species (including CO, SO2, NO, NOxand O3) were measured by various gas analyzers (Thermo Scien-25
ACPD
14, 20617–20646, 2014Aerosol composition and sources during the Chinese Spring
Festival
Q. Jiang et al.
Title Page
Abstract Introduction
Conclusions References
Tables Figures
◭ ◮
◭ ◮
Back Close
Full Screen / Esc
Printer-friendly Version Interactive Discussion
Discussion
P
a
per
|
Discus
sion
P
a
per
|
Discussion
P
a
per
|
Discussion
P
a
per
|
2.3 ACSM data analysis
The ACSM data were analyzed for the mass concentrations and chemical composition of NR-PM1 using standard ACSM software (v. 1.5.3.2) written within Igor Pro
(Wave-Metrics, Inc., Oregon USA). A composition-dependent collection efficiency (CE) rec-ommended by Middlebrook et al. (2012), CE=max (0.45, 0.0833+0.9167×ANMF),
5
was used to account for the incomplete detection due to the particle bouncing effects (Matthew et al., 2008) and the influences caused by high mass fraction of ammonium nitrate (ANMF). The default relative ionization efficiencies (RIEs) were used in this study, except ammonium (RIE=6.5) that was determined from IE calibration.
Quantification of K+ is challenging for ACSM because of a large interference of
or-10
ganic C3H+3 atm/z39 and also uncertainties caused by surface ionization (Slowik et
al., 2010). In this work, we found thatm/z39 was tightly correlated with m/z43 that is completely organics during non-fireworks (NFW) periods (r2=0.87, slope=0.45, Fig. S1 in the Supplement). However, higher ratios of m/z39/43 during FW periods were observed due to the elevated K+ signal from burning of fireworks. Assuming that
15
m/z39 was primarily contributed by organics during NFW periods, the excessm/z39 signal, i.e., K+, can then be estimated asm/z39–43×0.45. The 41K+ (m/z41) was
calculated using its isotopic ratio of 0.0722, i.e., 41K+=0.0722×K+. The K+ signal
was converted to mass concentration with a RIE of 2.9 that was reported by Drewnick et al. (2006). The KCl+ (m/z74) and 41KCl+/K37Cl+ (m/z76) were estimated by the
20
differences between the measured and PMF modeledm/z74 (see Fig. S2 in the Sup-plement for details). Not surprisingly, the quantified KCl+ highly correlates with K+ (r2=0.82). The chloride concentration was also biased during some periods (e.g., LNY, Fig. S3 in the Supplement) mainly due to the inappropriate default fragment ra-tio atm/z35. Therefore, Cl+ (m/z35) was recalculated based on its correlation with
25
m/z36 (mainly HCl+ with negligible C+3 and 36Ar), i.e., m/z35=0.15×m/z36, and
37
com-ACPD
14, 20617–20646, 2014Aerosol composition and sources during the Chinese Spring
Festival
Q. Jiang et al.
Title Page
Abstract Introduction
Conclusions References
Tables Figures
◭ ◮
◭ ◮
Back Close
Full Screen / Esc
Printer-friendly Version Interactive Discussion
Discussion
P
a
per
|
Discus
sion
P
a
per
|
Discussion
P
a
per
|
Discussion
P
a
per
|
parison of the time series of default and recalculated chloride is shown in Fig. S3b in the Supplement.
The positive matrix factorization (PMF) with the algorithm of PMF2.exe in robust mode (Paatero and Tapper, 1994) was performed on organic aerosol (OA) mass spec-tra (m/z12–120) to resolve distinct OA components from different sources. The PMF
5
results were evaluated with an Igor Pro-based PMF Evaluation Tool (PET, v. 2.04) (Ul-brich et al., 2009) following the procedures detailed in Zhang et al. (2011). After a care-ful evaluation of the spectral profiles, diurnal variations and correlations with external tracers, a 6-factor solution with rotational forcing parameterfpeak=−1 (Q/Qexp=4.3)
was chosen, yielding a hydrocarbon-like OA (HOA), a cooking OA (COA), a coal
com-10
bustion OA (CCOA), and three oxygenated OA (OOA) components, which were re-combined into one OOA component. The four OA components show very similar mass spectral profiles (r2=0.86–0.99) and diurnal variations (Fig. S4 in the Supplement) to those observed during winter 2011–2012 (Sun et al., 2013b). A detailed summary of key diagnostic plots of the PMF solution are given in Figs. S5–S8 in the Supplement.
15
3 Results and discussion
3.1 Identification and quantification of fireworks events
Burning of fireworks has been found to emit a large amount of K+, which can be used to identify the FW events (Drewnick et al., 2006; Wang et al., 2007). As shown in Figs. 1 and S9 in the Supplement, three FW events with significantly elevated K+ were
ob-20
served on the days of Lunar New Year (LNY, 9–10 February), Lunar Fifth Day (LFD, 14 February), and Lantern Festival (LF, 24 February), respectively. All three FW events started approximately at 18:00 and ended at midnight except LNY with a continuous FW impact until 04:00 on the second day. Figure 1 shows that the relative humidity was generally below 30 % during LNY and LFD. While the wind speed at the ground
sur-25
ACPD
14, 20617–20646, 2014Aerosol composition and sources during the Chinese Spring
Festival
Q. Jiang et al.
Title Page
Abstract Introduction
Conclusions References
Tables Figures
◭ ◮
◭ ◮
Back Close
Full Screen / Esc
Printer-friendly Version Interactive Discussion
Discussion
P
a
per
|
Discus
sion
P
a
per
|
Discussion
P
a
per
|
Discussion
P
a
per
|
of 100 m. Also note that there was a wind direction change in the middle of the two events. The meteorological conditions during LF were stagnant with wind speed gen-erally below 2 m s−1across different heights. The relative humidity was∼50 % and the
temperature averaged 3.5◦C.
To estimate the contributions of fireworks, we first assume that the background
con-5
centration of each species has a linear variation during FW period. A linear fit is then performed on the 6 h data before and after FW events. The difference between the measured and the fitted value is then assumed as the contribution from FW. The typi-cal examples for estimating FW contributions are shown in Fig. S10 in the Supplement. It should be noted that this approach might significantly overestimate the FW
contribu-10
tions of primary species (e.g., HOA, COA, CCOA, and BC) that were largely enhanced during the typical FW periods (18:00–24:00) due to the increased local emissions (see Fig. S11 in the Supplement for diurnal variations). However, it should have a minor impact on secondary species (e.g., SO2−
4 , NO3-, and OOA) because of their relatively
stable variations between 18:00–24:00. As shown in Fig. 1, all aerosol species showed
15
substantial increases from 15:00 to 21:00 on the day of LNY which coincidently cor-responded to a gradual change of wind direction. Therefore, regional transport might have played dominant roles for the evolution of chemical species during this period. For these reasons, only the FW contributions between 23:30, 9 February and 03:30, 10 February when the meteorological conditions were stable were estimated. The FW
20
contributions during LFD might also be overestimated due to the influences of regional transport as suggested by the wind direction change in the middle. Considering above, the contributions estimated in this work would represent the upper limits of FW.
3.2 Mass concentration and chemical composition of FW aerosols
Figure 1 shows the time series of mass concentrations of PM1, PM2.5, and sub-25
ACPD
14, 20617–20646, 2014Aerosol composition and sources during the Chinese Spring
Festival
Q. Jiang et al.
Title Page
Abstract Introduction
Conclusions References
Tables Figures
◭ ◮
◭ ◮
Back Close
Full Screen / Esc
Printer-friendly Version Interactive Discussion
Discussion
P
a
per
|
Discus
sion
P
a
per
|
Discussion
P
a
per
|
Discussion
P
a
per
|
NR-PM1(=Org+SO 2−
4 +NO
−
3+NH
+
4+Chl+K++KCl)+BC. The PM2.5showed three
prominent FW peaks with the maximum concentration occurring at∼00:30 during LNY
and∼21:30 during LFD and LF, respectively. The peak concentration of PM2.5 during
LNY is more than 10 times higher than the China National Ambient Air Quality Stan-dard (75 µg m−3, 24 h average). The average FW-PM2.5 mass concentrations during 5
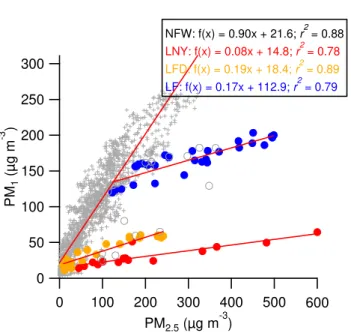
three FW events all exceeded 100 µg m−3. These results suggest that fireworks have large impacts on fine particle pollution, yet generally less than half day (approximately 10 h for LNY, and 6 h for LFD and LF). The PM1also showed increases during the FW periods, yet not as significant as PM2.5. In fact the correlation of PM1 versus PM2.5 shows much lower PM1/ PM2.5(0.08–0.19) ratios during three FW events than that ob-10
served during NFW periods (0.90) (Fig. 2). One of the reasons is likely due to the min-eral dust component and metals from fireworks that ACSM did not measure. However, the metals that were largely enhanced during FW periods generally contribute a small fraction of PM (Wang et al., 2007; Vecchi et al., 2008). Therefore, our results suggest that burning of fireworks has the most impact on aerosol particles in the size range of
15
1–2.5 µm. Consistently, Vecchi et al. (2008) found the best correlation between the fire-works tracer, Sr, and the particles between 700–800 nm (mobility diameter,Dm) which
is approximately equivalent to 1.9–2.2 µm inDva (vacuum aerodynamic diameter) with
a density of 2.7 g cm−3(Zhang et al., 2010).
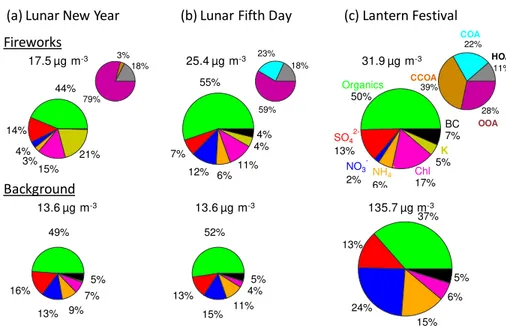
Figure 3 shows the average chemical composition of PM1 and OA from fireworks 20
and also the background composition during LNY, LFD and LF. The background PM1 during LNY and LFD showed typical characteristics of clean periods with high fraction of organics (>∼50 %), whereas that during LF was dominated by SIA (52 %). As a
comparison, organics constituted the major fraction of FW-PM1, contributing 44–55 % on average. During LNY, FW exerted large impacts on potassium and chloride whose
25
contributions were elevated to 21 % and 15 % of PM1, respectively, from less than
ACPD
14, 20617–20646, 2014Aerosol composition and sources during the Chinese Spring
Festival
Q. Jiang et al.
Title Page
Abstract Introduction
Conclusions References
Tables Figures
◭ ◮
◭ ◮
Back Close
Full Screen / Esc
Printer-friendly Version Interactive Discussion
Discussion
P
a
per
|
Discus
sion
P
a
per
|
Discussion
P
a
per
|
Discussion
P
a
per
|
sulfate, accounting for 7–14 % of PM1. Sulfate correlated strongly with SO2 during all three FW events (r2=0.49–0.92). Given that the relative humidity was low, < 30 % during LNY and LFD, and ∼50 % during LF, aqueous-phase oxidation of SO2 could
not play significant roles for the sulfate formation (Sun et al., 2013a). Therefore, sulfate in FW-PM1 was mainly from the direction emissions of FW. Compared to sulfate, FW
5
appeared to show minor impacts on nitrate, for example, 4 and 2 % during LNY and LF, respectively. Although nitrate contributed 12 % of FW-PM1 during LFD, most of
it was likely from local sources and/or regional transport as supported by the large contributions of local HOA and COA in OA (Fig. 3b) and also a wind direction change in the middle.
10
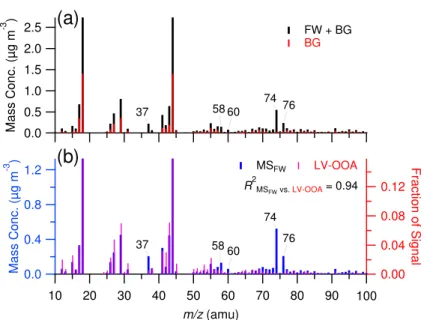
The OOA contributed dominantly to OA during LNY, which is 79 % on average (Fig. 3a). As shown in Fig. 4, the mass spectrum of FW-organics is highly similar to that of low-volatility OOA (LV-OOA,r2=0.94) (Ng et al., 2011a) indicating that the FW-organics is likely emitted in secondary. Consistently, Drewnick et al. (2006) also found large enhancements of OOA-relatedm/z’s (e.g.,m/z44) during New Year’s fireworks,
15
but HOA-relatedm/z’s (e.g.,m/z57) are not significant contributors to FW organics. OOA contributed a much smaller fraction of OA during LF (28 %) due to the large con-tributions of POA components (72 %). Although the OOA concon-tributions varied during three FW events, their absolute concentrations were relatively close ranging from 5.8 to 7.9 µg m−3. It should be noted that the POA components in FW-OA were likely from
20
the NFW sources that were overestimated by the approach in this work, in particu-lar during the FW period of LF when the local HOA, COA, and CCOA happened to have large increases. By excluding the POA components in FW-OA, FW on average contributed 15–19 µg m−3PM1during three FW events.
3.3 Secondary aerosol and PM pollution 25
The PM1(NR-PM1+BC) varied largely across the entire study with daily average mass
ACPD
14, 20617–20646, 2014Aerosol composition and sources during the Chinese Spring
Festival
Q. Jiang et al.
Title Page
Abstract Introduction
Conclusions References
Tables Figures
◭ ◮
◭ ◮
Back Close
Full Screen / Esc
Printer-friendly Version Interactive Discussion
Discussion
P
a
per
|
Discus
sion
P
a
per
|
Discussion
P
a
per
|
Discussion
P
a
per
|
was 80 (±68) µg m−3, which is approximately 20 % higher than that observed during
winter 2011–2012 (Sun et al., 2013b). Organics composed the major fraction of PM1,
accounting for 43 %, followed by nitrate (22 %), sulfate (14 %), ammonium (13 %), BC (5 %) and chloride (3 %). The OA composition was dominated by OOA (53 %) with the rest being POA. Compared to winter 2011–2012 (Sun et al., 2013b), this study showed
5
significantly enhanced OOA (53 % vs. 31 %) and secondary nitrate (22 % vs. 16 %), indicating that secondary formation have played important roles in the formation of pollution episodes.
Figure 1d shows that submicron aerosol species alternated routinely between pollu-tion events (PEs) and clean periods (CPs) throughout the entire study. The PEs
gener-10
ally lasted∼1–2 days except the one on 23–28 February that lasted more than 5 days,
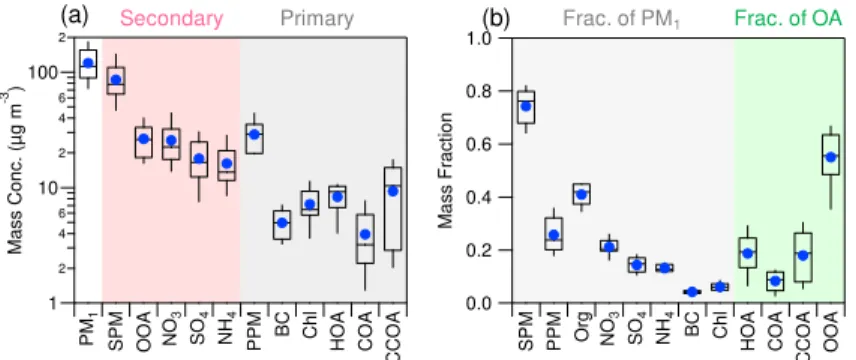
whereas the CPs were shorter, generally less than 1 day. In total, 9 PEs and 9 CPs were classified in this study (Fig. 1). A statistics of the mass concentrations and mass frac-tions of aerosol species during the 9 PEs is presented in Fig. 5. The average PM1mass
concentration ranged 68–179 µg m−3 during PEs with the total secondary particulate
15
matter (SPM=OOA+SO24−+NO−3+NH+4) accounting for 63–82 %. The average mass concentration of SPM for the 9 PEs was 86 (±32) µg m−3, which is nearly 3 times
pri-mary PM (PPM=HOA+COA+CCOA+BC+Chl) (30±9.5 µg m−3). SPM consistently
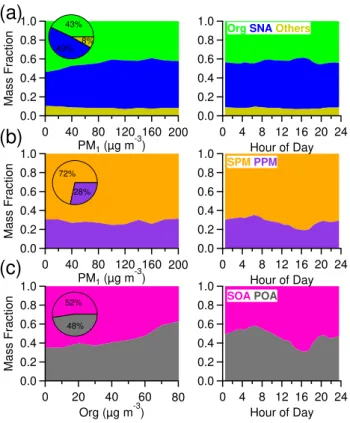
dominated PM1 across different PM levels (69–75 %), but generally with higher contri-butions (up to 81 %) during daytime (Fig. 6b). The diurnal cycle of SPM presented a
20
gradual increase from 50 to 70 µg m−3between 10:00–20:00, indicating evident photo-chemical production of secondary species during daytime. It should be also noted that all secondary species showed ubiquitously higher mass concentrations than those of primary species (Fig. 5a).
The SOA generally contributed more than 50 % to OA with an average of 55 % during
25
the PEs except the episode on 3 February (35 %). It’s interesting to note that the con-tribution of POA increased as a function of organic loadings which varied from∼35 to
ACPD
14, 20617–20646, 2014Aerosol composition and sources during the Chinese Spring
Festival
Q. Jiang et al.
Title Page
Abstract Introduction
Conclusions References
Tables Figures
◭ ◮
◭ ◮
Back Close
Full Screen / Esc
Printer-friendly Version Interactive Discussion
Discussion
P
a
per
|
Discus
sion
P
a
per
|
Discussion
P
a
per
|
Discussion
P
a
per
|
winter 2011–2012 (Sun et al., 2013b). These results suggest that POA played more im-portant roles than SOA in PM pollution during periods with high organic mass loadings. In fact, POA showed even higher concentrations than OOA at nighttime (00:00–08:00) due to the intensified local emissions, e.g., coal combustion for heating. Despite this, the role of POA in PM pollution was compensated by the elevated secondary inorganic
5
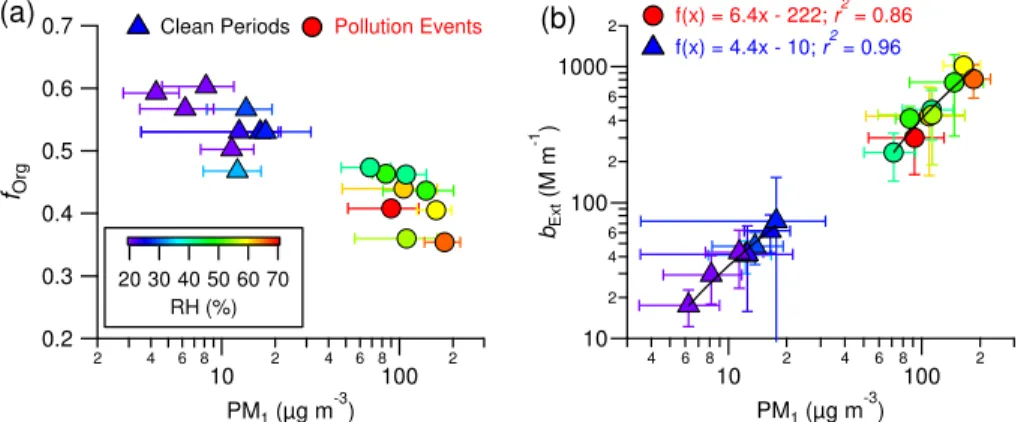
species as a function of PM loadings (Fig. 6a) leading to the consistently dominant SPM across different pollution levels. Figure 7a shows an evidently lower contribution of organics to PM1 during PEs than CPs. The elevated secondary inorganic species
during PEs were closely related to the increase of RH (Fig. 1). For example, during the pollution episode on 3 February, the sulfate concentration increased rapidly and
10
became the major inorganic species when RH was increased from∼60 to > 90 %. The
gaseous SO2 showed a corresponding decrease indicating aqueous-phase
process-ing of SO2to form sulfate, consistent with our previous conclusion that aqueous-phase
processing could contribute more than 50 % of sulfate production during winter 2011– 2012 (Sun et al., 2013a).
15
The compositional differences between PEs and CPs also led to different mass ex-tinction efficiency (MEE, 630 nm) of PM1(Fig. 7b). The higher MEE (6.4 m2g−1
) during PEs than CPs (4.4 m2g−1) is primarily due to the enhanced secondary species, and also likely the increases of aerosol particle sizes although we don’t have size data to support it. Similar increases of mass scattering efficiency from clean periods to
rela-20
tively polluted conditions were also observed previously in Beijing and Shanghai (Jung et al., 2009; Huang et al., 2013). It should be noted that the MEE of PM1in this study
refers to PM2.5bext/PM1. If assuming PM1 on average contributed 70 % of PM2.5, the
real MEE of PM1during PEs and CPs would be 4.5 and 3.1 m 2
g−1, respectively.
3.4 Holiday effects on PM pollution 25
hol-ACPD
14, 20617–20646, 2014Aerosol composition and sources during the Chinese Spring
Festival
Q. Jiang et al.
Title Page
Abstract Introduction
Conclusions References
Tables Figures
◭ ◮
◭ ◮
Back Close
Full Screen / Esc
Printer-friendly Version Interactive Discussion
Discussion
P
a
per
|
Discus
sion
P
a
per
|
Discussion
P
a
per
|
Discussion
P
a
per
|
iday for the Spring Festival was 9–15 February. However, we noted a large decrease of cooking aerosols from 7 February until 19 February (Fig. S4c in the Supplement), whose emissions were expected to be stable under similar meteorological conditions. The decrease of COA was likely due to the reduction of the number of population in Beijing, which agreed with the fact that most migrants from outside Beijing were
leav-5
ing for hometown before the official holiday. Therefore, 7–19 February was used as a longer holiday for a comparison. It was estimated that approximately half of population (9 million) left Beijing before Spring Festival (http://news.xinhuanet.com/local/2013-02/ 18/c_124355887.htm). Such a great reduction in human activities would exert a large impact on aerosol composition and sources in the city during holidays. To better
investi-10
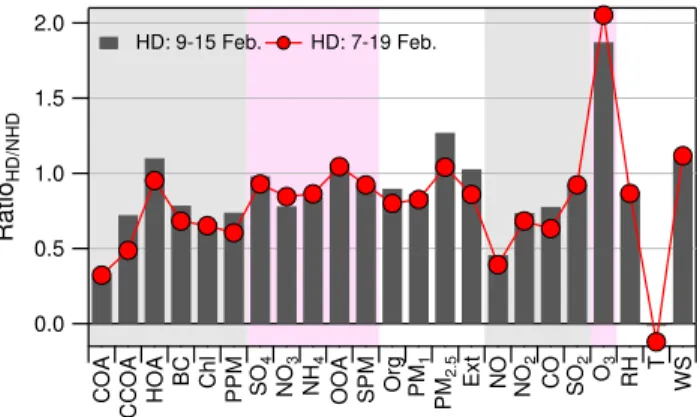
gate the HD effects on PM pollution, the data shown in Fig. 8 excluded the CPs marked in Fig. 1. The data with the CPs included are presented in Fig. S12 in the Supplement. The differences between HD and NHD for primary species varied largely among different species. COA showed the largest reduction (69 %) among aerosol species with the average concentration decreasing from 5.8 µg m−3 during NHD to 1.8 µg m−3
15
during HD. The contribution of COA to OA showed a corresponding decrease from 12 to 4 %. Given the similar meteorological conditions between HD and NHD, e.g., RH (46 % vs. 52 %) and wind speed (1.3 m s−1 vs. 1.2 m s−1), the reduction of COA clearly indicated a large decrease of population and the number of restaurants open during HD. The CCOA showed approximately 30 % reduction during HD, and its
con-20
tribution to OA decreased from 23 to 18 %. Not surprisingly, chloride showed a similar reduction as CCOA because it was primarily from coal combustion emissions during wintertime (Sun et al., 2013b). Figure 8 also shows a significant reduction (54 %) for NO, indicating much less traffic emissions in the city during HD. The HOA, however, even showed a slight increase during HD, which appeared to contradict with the
re-25
duction of two combustion-related tracers, BC and CO (∼20 %). The results might
ACPD
14, 20617–20646, 2014Aerosol composition and sources during the Chinese Spring
Festival
Q. Jiang et al.
Title Page
Abstract Introduction
Conclusions References
Tables Figures
◭ ◮
◭ ◮
Back Close
Full Screen / Esc
Printer-friendly Version Interactive Discussion
Discussion
P
a
per
|
Discus
sion
P
a
per
|
Discussion
P
a
per
|
Discussion
P
a
per
|
HOA showed a large peak on 9 February – the first day of the official holiday (Fig. S4 in the Supplement) when more traffic emissions were expected due to many people leaving for hometown. After that, HOA showed comparably lower concentration during 11–17 February than other periods indicating the holiday effects on HOA reduction. To-gether, the total primary aerosol species (PPM) showed an average reduction of 22 %
5
because of holiday effects.
Nitrate showed the largest reduction among secondary species by 22 % during HD, primarily due to a reduction of its precursors NO and NO2. Results here suggest that
reducing traffic emissions would help mitigate the nitrate pollution in the city. Compared to nitrate, sulfate showed minor changes (2 %) between HD and NHD, and OOA even
10
showed a slight increase (6 %) during HD. One of the reasons is that secondary sulfate and OOA were mainly formed over regional scale and less affected by local production, consistent with their relatively flat diurnal cycles (Fig. S11 in the Supplement). Ammo-nium showed a reduction between nitrate and sulfate because ammoAmmo-nium mainly ex-isted in the form of (NH4)2SO4and NH4NO3. Overall, secondary species showed gen-15
erally lower reductions than primary species with the total secondary species (SPM) showing an average reduction of 9 % during HD. The joint reductions of PPM and SPM led to an average reduction of 13 % for PM1 during HD. However, these reductions
did not help alleviate the fine particle pollution during HD. The PM2.5 excluding FW
impacts even showed 27 % increase from 96 µg m−3during NHD to 122 µg m−3 during
20
HD. The longer holiday (LHD, 7–19 February) showed similar influences on both pri-mary and secondary species as the official holiday (9–15 February). COA, CCOA, and NO are the three species with the largest reductions during LHD (> 50 %). However, HOA, SO24−, OOA, and PM2.5 showed rather small changes (<±7 %). Therefore,
re-sults in this study suggest that controlling the primary source emissions, e.g., cooking
25
ACPD
14, 20617–20646, 2014Aerosol composition and sources during the Chinese Spring
Festival
Q. Jiang et al.
Title Page
Abstract Introduction
Conclusions References
Tables Figures
◭ ◮
◭ ◮
Back Close
Full Screen / Esc
Printer-friendly Version Interactive Discussion
Discussion
P
a
per
|
Discus
sion
P
a
per
|
Discussion
P
a
per
|
Discussion
P
a
per
|
primary source emissions in local areas would have limited impacts on mitigation of air pollution in the city. Similarly, Guo et al. (2013) reported a large reduction of primary or-ganic carbon (OC) from traffic emissions and coal combustion during the 2008 Olympic Summer Games when traffic restrictions and temporary closure of factories were im-plemented. However, secondary OC was not statistically different between controlled
5
and non-controlled periods. Our results highlight the importance of implementing joint efforts over regional scales for air pollution control in north China.
4 Conclusions
We have characterized the aerosol particle composition and sources during the Chi-nese Spring Festival, 2013. The average PM1mass concentration was 80 (±68) µg m−3
10
for the entire study with organics being the major fraction (43 %). Nine pollution events and nine clean periods with substantial compositional differences were observed. The secondary particulate matter (=SOA+sulfate+nitrate+ammonium) played a domi-nant role for the PM pollution during the nine PEs. The contributions of SPM to PM1
varied from 63 to 82 % with SOA on average accounting for∼55 % of OA. As a result,
15
the average mass extinction efficiency of PM1during PEs (6.4 m2g−1) was higher than that during CPs (4.4 m2g−1). Three FW events, i.e., LNY, LFD, and LF, were identified, which showed significant and short-term impacts on fine particles, and non-refractory potassium, chloride, and sulfate in PM1. The FW also exerted a large impact on
or-ganics that presented mainly in secondary as indicated by its similar mass spectrum to
20
that of oxygenated OA. The holiday effects on aerosol composition and sources were also investigated by comparing the differences between holiday and non-holiday peri-ods. The changes of anthropogenic source emissions during the holiday showed large impacts on reduction of cooking OA (69 %), nitrogen monoxide (54 %), and coal com-bustion OA (28 %) in the city, yet presented minor influences on secondary species.
25
ACPD
14, 20617–20646, 2014Aerosol composition and sources during the Chinese Spring
Festival
Q. Jiang et al.
Title Page
Abstract Introduction
Conclusions References
Tables Figures
◭ ◮
◭ ◮
Back Close
Full Screen / Esc
Printer-friendly Version Interactive Discussion
Discussion
P
a
per
|
Discus
sion
P
a
per
|
Discussion
P
a
per
|
Discussion
P
a
per
|
emissions, e.g., cooking and traffic activities, might have limited effects on improving air quality during polluted days when SPM dominated aerosol composition for most of time. Our results also highlight the importance of implementing joint measures over regional scales for mitigation of air pollution.
The Supplement related to this article is available online at 5
doi:10.5194/acpd-14-20617-2014-supplement.
Acknowledgements. This work was supported by the National Key Project of Basic Research (2014CB447900), the Strategic Priority Research Program (B) of the Chinese Academy of Sciences (Grant No. XDB05020501), and the National Natural Science Foundation of China (41175108). We thank Huabin Dong, Hongyan Chen, and Zhe Wang’s help in data collection,
10
and also the Technical and Service Center, Institute of Atmospheric Physics, Chinese Academy of Sciences for providing meteorological data.
References
Chan, C. K. and Yao, X.: Air pollution in mega cities in China, Atmos. Environ., 42, 1–42, doi:10.1016/j.atmosenv.2007.09.003, 2008.
15
Cheng, Y., Engling, G., He, K. B., Duan, F. K., Du, Z. Y., Ma, Y. L., Liang, L. L., Lu, Z. F., Liu, J. M., Zheng, M., and Weber, R. J.: The characteristics of Beijing aerosol during two distinct episodes: Impacts of biomass burning and fireworks, Environ. Pollut., 185, 149–157, doi:10.1016/j.envpol.2013.10.037, 2014.
DeCarlo, P. F., Kimmel, J. R., Trimborn, A., Northway, M. J., Jayne, J. T., Aiken, A. C., Gonin, M.,
20
Fuhrer, K., Horvath, T., Docherty, K. S., Worsnop, D. R., and Jimenez, J. L.: Field-Deployable, High-Resolution, Time-of-Flight Aerosol Mass Spectrometer, Anal. Chem., 78, 8281–8289, 2006.
Drewnick, F., Hings, S. S., Curtius, J., Eerdekens, G., and Williams, J.: Measurement of fine particulate and gas-phase species during the New Year’s fireworks 2005 in Mainz, Germany,
25
ACPD
14, 20617–20646, 2014Aerosol composition and sources during the Chinese Spring
Festival
Q. Jiang et al.
Title Page
Abstract Introduction
Conclusions References
Tables Figures
◭ ◮
◭ ◮
Back Close
Full Screen / Esc
Printer-friendly Version Interactive Discussion
Discussion
P
a
per
|
Discus
sion
P
a
per
|
Discussion
P
a
per
|
Discussion
P
a
per
|
Duan, F. K., He, K. B., Ma, Y. L., Yang, F. M., Yu, X. C., Cadle, S. H., Chan, T., and Mulawa, P. A.: Concentration and chemical characteristics of PM2.5 in Beijing, China: 2001–2002, Sci. Total Environ., 355, 264–275, doi:10.1016/j.scitotenv.2005.03.001, 2006.
Feng, J., Sun, P., Hu, X., Zhao, W., Wu, M., and Fu, J.: The chemical composition and sources of PM2.5 during the 2009 Chinese New Year’s holiday in Shanghai, Atmos. Res., 118, 435–
5
444, doi:10.1016/j.atmosres.2012.08.012, 2012.
Godri, K. J., Green, D. C., Fuller, G. W., Dall’Osto, M., Beddows, D. C., Kelly, F. J., Harrison, R. M., and Mudway, I. S.: Particulate oxidative burden associated with firework activity, Environ. Sci. Technol., 21, 8295–8301, doi:10.1021/es1016284, 2010.
Guo, S., Hu, M., Wang, Z. B., Slanina, J., and Zhao, Y. L.: Size-resolved aerosol water-soluble
10
ionic compositions in the summer of Beijing: implication of regional secondary formation, Atmos. Chem. Phys., 10, 947–959, doi:10.5194/acp-10-947-2010, 2010.
Guo, S., Hu, M., Guo, Q., Zhang, X., Schauer, J. J., and Zhang, R.: Quantitative evaluation of emission controls on primary and secondary organic aerosol sources during Beijing 2008 Olympics, Atmos. Chem. Phys., 13, 8303–8314, doi:10.5194/acp-13-8303-2013, 2013.
15
Hayes, P. L., Ortega, A. M., Cubison, M. J., Froyd, K. D., Zhao, Y., Cliff, S. S., Hu, W. W., Toohey, D. W., Flynn, J. H., Lefer, B. L., Grossberg, N., Alvarez, S., Rappenglück, B., Taylor, J. W., Allan, J. D., Holloway, J. S., Gilman, J. B., Kuster, W. C., de Gouw, J. A., Massoli, P., Zhang, X., Liu, J., Weber, R. J., Corrigan, A. L., Russell, L. M., Isaacman, G., Worton, D. R., Kreisberg, N. M., Goldstein, A. H., Thalman, R., Waxman, E. M., Volkamer, R., Lin, Y.
20
H., Surratt, J. D., Kleindienst, T. E., Offenberg, J. H., Dusanter, S., Griffith, S., Stevens, P. S., Brioude, J., Angevine, W. M., and Jimenez, J. L.: Organic aerosol composition and sources in Pasadena, California during the 2010 CalNex campaign, J. Geophys. Res.-Atmos., 118, 9233–9257, doi:10.1002/jgrd.50530, 2013.
He, L. Y., Huang, X. F., Xue, L., Hu, M., Lin, Y., Zheng, J., Zhang, R., and Zhang, Y. H.:
Sub-25
micron aerosol analysis and organic source apportionment in an urban atmosphere in Pearl River Delta of China using high-resolution aerosol mass spectrometry, J. Geophys. Res., 116, D12304, doi:10.1029/2010jd014566, 2011.
Huang, K., Zhuang, G., Lin, Y., Wang, Q., Fu, J. S., Zhang, R., Li, J., Deng, C., and Fu, Q.: Impact of anthropogenic emission on air quality over a megacity – revealed from an intensive
30
ACPD
14, 20617–20646, 2014Aerosol composition and sources during the Chinese Spring
Festival
Q. Jiang et al.
Title Page
Abstract Introduction
Conclusions References
Tables Figures
◭ ◮
◭ ◮
Back Close
Full Screen / Esc
Printer-friendly Version Interactive Discussion
Discussion
P
a
per
|
Discus
sion
P
a
per
|
Discussion
P
a
per
|
Discussion
P
a
per
|
Huang, X.-F., He, L.-Y., Hu, M., Canagaratna, M. R., Sun, Y., Zhang, Q., Zhu, T., Xue, L., Zeng, L.-W., Liu, X.-G., Zhang, Y.-H., Jayne, J. T., Ng, N. L., and Worsnop, D. R.: Highly time-resolved chemical characterization of atmospheric submicron particles during 2008 Beijing Olympic Games using an Aerodyne High-Resolution Aerosol Mass Spectrometer, Atmos. Chem. Phys., 10, 8933–8945, doi:10.5194/acp-10-8933-2010, 2010.
5
Huang, Y., Li, L., Li, J., Wang, X., Chen, H., Chen, J., Yang, X., Gross, D. S., Wang, H., Qiao, L., and Chen, C.: A case study of the highly time-resolved evolution of aerosol chemical and optical properties in urban Shanghai, China, Atmos. Chem. Phys., 13, 3931–3944, doi:10.5194/acp-13-3931-2013, 2013.
Jayne, J. T., Leard, D. C., Zhang, X., Davidovits, P., Smith, K. A., Kolb, C. E., and Worsnop,
10
D. R.: Development of an aerosol mass spectrometer for size and composition analysis of submicron particles, Aerosol Sci. Tech., 33, 49–70, 2000.
Jung, J., Lee, H., Kim, Y. J., Liu, X., Zhang, Y., Hu, M., and Sugimoto, N.: Optical properties of atmospheric aerosols obtained by in situ and remote measurements during 2006 Campaign of Air Quality Research in Beijing (CAREBeijing-2006), J. Geophys. Res., 114, D00G02,
15
doi:10.1029/2008jd010337, 2009.
Li, W., Shi, Z., Yan, C., Yang, L., Dong, C., and Wang, W.: Individual metal-bearing particles in a regional haze caused by firecracker and firework emissions, Sci. Total Environ., 443, 464–469, doi:10.1016/j.scitotenv.2012.10.109, 2013.
Massoli, P., Kebabian, P. L., Onasch, T. B., Hills, F. B., and Freedman, A.: Aerosol Light
Ex-20
tinction Measurements by Cavity Attenuated Phase Shift (CAPS) Spectroscopy: Laboratory Validation and Field Deployment of a Compact Aerosol Particle Extinction Monitor, Aerosol Sci. Tech., 44, 428–435, doi:10.1080/02786821003716599, 2010.
Massoli, P., Fortner, E. C., Canagaratna, M. R., Williams, L. R., Zhang, Q., Sun, Y., Schwab, J. J., Trimborn, A., Onasch, T. B., Demerjian, K. L., Kolb, C. E., Worsnop, D. R., and Jayne,
25
J. T.: Pollution Gradients and Chemical Characterization of Particulate Matter from Vehicular Traffic Near Major Roadways: Results from the 2009 Queens College Air Quality Study in NYC, Aerosol Sci. Tech., 46, 1201–1218, doi:10.1080/02786826.2012.701784, 2012. Matthew, B. M., Middlebrook, A. M., and Onasch, T. B.: Collection Efficiencies in an
Aero-dyne Aerosol Mass Spectrometer as a Function of Particle Phase for Laboratory Generated
30
ACPD
14, 20617–20646, 2014Aerosol composition and sources during the Chinese Spring
Festival
Q. Jiang et al.
Title Page
Abstract Introduction
Conclusions References
Tables Figures
◭ ◮
◭ ◮
Back Close
Full Screen / Esc
Printer-friendly Version Interactive Discussion
Discussion
P
a
per
|
Discus
sion
P
a
per
|
Discussion
P
a
per
|
Discussion
P
a
per
|
Middlebrook, A. M., Bahreini, R., Jimenez, J. L., and Canagaratna, M. R.: Evaluation of Composition-Dependent Collection Efficiencies for the Aerodyne Aerosol Mass Spectrom-eter using Field Data, Aerosol Sci. Tech., 46, 258–271, 2012.
Molina, M. J. and Molina, L. T.: Megacities and atmospheric pollution, J. Air Waste Manage. Assoc., 54, 644–680, 2004.
5
Moreno, T., Querol, X., Alastuey, A., Cruz Minguillón, M., Pey, J., Rodriguez, S., Vicente Miró, J., Felis, C., and Gibbons, W.: Recreational atmospheric pollution episodes: In-halable metalliferous particles from firework displays, Atmos. Environ., 41, 913–922, doi:10.1016/j.atmosenv.2006.09.019, 2007.
Ng, N. L., Canagaratna, M. R., Jimenez, J. L., Zhang, Q., Ulbrich, I. M., and Worsnop, D. R.:
10
Real-Time Methods for Estimating Organic Component Mass Concentrations from Aerosol Mass Spectrometer Data, Environ. Sci. Technol., 45, 910–916, doi:10.1021/es102951k, 2011a.
Ng, N. L., Herndon, S. C., Trimborn, A., Canagaratna, M. R., Croteau, P. L., Onasch, T. B., Sueper, D., Worsnop, D. R., Zhang, Q., Sun, Y. L., and Jayne, J. T.: An Aerosol Chemical
15
Speciation Monitor (ACSM) for Routine Monitoring of the Composition and Mass Concentra-tions of Ambient Aerosol, Aerosol Sci. Tech., 45, 770–784, 2011b.
Paatero, P. and Tapper, U.: Positive matrix factorization: A non-negative factor model with opti-mal utilization of error estimates of data values, Environmetrics, 5, 111–126, 1994.
Slowik, J. G., Stroud, C., Bottenheim, J. W., Brickell, P. C., Chang, R. Y.-W., Liggio, J., Makar,
20
P. A., Martin, R. V., Moran, M. D., Shantz, N. C., Sjostedt, S. J., van Donkelaar, A., Vlasenko, A., Wiebe, H. A., Xia, A. G., Zhang, J., Leaitch, W. R., and Abbatt, J. P. D.: Characterization of a large biogenic secondary organic aerosol event from eastern Canadian forests, Atmos. Chem. Phys., 10, 2825–2845, doi:10.5194/acp-10-2825-2010, 2010.
Song, Y., Zhang, Y., Xie, S., Zeng, L., Zheng, M., Salmon, L. G., Shao, M., and Slanina, S.:
25
Source apportionment of PM2.5 in Beijing by positive matrix factorization, Atmos. Environ., 40, 1526–1537, doi:10.1016/j.atmosenv.2005.10.039, 2006.
Sun, J., Zhang, Q., Canagaratna, M. R., Zhang, Y., Ng, N. L., Sun, Y., Jayne, J. T., Zhang, X., Zhang, X., and Worsnop, D. R.: Highly time- and size-resolved characterization of submicron aerosol particles in Beijing using an Aerodyne Aerosol Mass Spectrometer, Atmos. Environ.,
30
44, 131–140, 2010.
ACPD
14, 20617–20646, 2014Aerosol composition and sources during the Chinese Spring
Festival
Q. Jiang et al.
Title Page
Abstract Introduction
Conclusions References
Tables Figures
◭ ◮
◭ ◮
Back Close
Full Screen / Esc
Printer-friendly Version Interactive Discussion
Discussion
P
a
per
|
Discus
sion
P
a
per
|
Discussion
P
a
per
|
Discussion
P
a
per
|
Sun, Y. L., Wang, Z., Dong, H., Yang, T., Li, J., Pan, X., Chen, P., and Jayne, J. T.: Character-ization of summer organic and inorganic aerosols in Beijing, China with an Aerosol Chemi-cal Speciation Monitor, Atmos. Environ., 51, 250–259, doi:10.1016/j.atmosenv.2012.01.013, 2012.
Sun, Y. L., Wang, Z., Fu, P., Jiang, Q., Yang, T., Li, J., and Ge, X.: The Impact of Relative
5
Humidity on Aerosol Composition and Evolution Processes during Wintertime in Beijing, China, Atmos. Environ., 77, 927–934, doi:10.1016/j.atmosenv.2013.06.019, 2013a.
Sun, Y. L., Wang, Z. F., Fu, P. Q., Yang, T., Jiang, Q., Dong, H. B., Li, J., and Jia, J. J.: Aerosol composition, sources and processes during wintertime in Beijing, China, Atmos. Chem. Phys., 13, 4577–4592, doi:10.5194/acp-13-4577-2013, 2013b.
10
Ulbrich, I. M., Canagaratna, M. R., Zhang, Q., Worsnop, D. R., and Jimenez, J. L.: Interpreta-tion of organic components from Positive Matrix FactorizaInterpreta-tion of aerosol mass spectrometric data, Atmos. Chem. Phys., 9, 2891–2918, doi:10.5194/acp-9-2891-2009, 2009.
Vecchi, R., Bernardoni, V., Cricchio, D., D’Alessandro, A., Fermo, P., Lucarelli, F., Nava, S., Piazzalunga, A., and Valli, G.: The impact of fireworks on airborne particles, Atmos. Environ.,
15
42, 1121–1132, doi:10.1016/j.atmosenv.2007.10.047, 2008.
Wang, Y., Zhuang, G., Sun, Y., and An, Z.: The variation of characteristics and formation mech-anisms of aerosols in dust, haze, and clear days in Beijing, Atmos. Environ., 40, 6579–6591, 2006.
Wang, Y., Zhuang, G., Xu, C., and An, Z.: The air pollution caused by the
burn-20
ing of fireworks during the lantern festival in Beijing, Atmos. Environ., 41, 417–431, doi:10.1016/j.atmosenv.2006.07.043, 2007.
Yang, F., Tan, J., Zhao, Q., Du, Z., He, K., Ma, Y., Duan, F., Chen, G., and Zhao, Q.: Charac-teristics of PM2.5 speciation in representative megacities and across China, Atmos. Chem. Phys., 11, 5207–5219, doi:10.5194/acp-11-5207-2011, 2011.
25
Yang, L., Gao, X., Wang, X., Nie, W., Wang, J., Gao, R., Xu, P., Shou, Y., Zhang, Q., and Wang, W.: Impacts of firecracker burning on aerosol chemical characteristics and human health risk levels during the Chinese New Year Celebration in Jinan, China, Sci. Total Environ., 476–477, 57–64, doi:10.1016/j.scitotenv.2013.12.110, 2014.
Yao, X., Chan, C. K., Fang, M., Cadle, S., Chan, T., Mulawa, P., He, K., and Ye, B.: The
water-30
ACPD
14, 20617–20646, 2014Aerosol composition and sources during the Chinese Spring
Festival
Q. Jiang et al.
Title Page
Abstract Introduction
Conclusions References
Tables Figures
◭ ◮
◭ ◮
Back Close
Full Screen / Esc
Printer-friendly Version Interactive Discussion
Discussion
P
a
per
|
Discus
sion
P
a
per
|
Discussion
P
a
per
|
Discussion
P
a
per
|
Zhang, J. K., Sun, Y., Liu, Z. R., Ji, D. S., Hu, B., Liu, Q., and Wang, Y. S.: Characterization of submicron aerosols during a month of serious pollution in Beijing, 2013, Atmos. Chem. Phys., 14, 2887–2903, doi:10.5194/acp-14-2887-2014, 2014.
Zhang, M., Wang, X., Chen, J., Cheng, T., Wang, T., Yang, X., Gong, Y., Geng, F., and Chen, C.: Physical characterization of aerosol particles during the Chinese New Year’s firework events,
5
Atmos. Environ., 44, 5191–5198, doi:10.1016/j.atmosenv.2010.08.048, 2010.
Zhang, Q., Jimenez, J., Canagaratna, M., Ulbrich, I., Ng, N., Worsnop, D., and Sun, Y.: Under-standing atmospheric organic aerosols via factor analysis of aerosol mass spectrometry: a review, Anal. Bioanal. Chem., 401, 3045–3067, doi:10.1007/s00216-011-5355-y, 2011. Zhang, R., Jing, J., Tao, J., Hsu, S. C., Wang, G., Cao, J., Lee, C. S. L., Zhu, L., Chen, Z., Zhao,
10
Y., and Shen, Z.: Chemical characterization and source apportionment of PM2.5in Beijing: seasonal perspective, Atmos. Chem. Phys., 13, 7053–7074, doi:10.5194/acp-13-7053-2013, 2013.
Zhao, S., Yu, Y., Yin, D., Liu, N., and He, J.: Ambient particulate pollution during Chinese Spring Festival in urban Lanzhou, Northwestern China, Atmospheric Pollution Research, 5, 335–
15
343, doi:10.5094/APR.2014.039, 2014.
Zhao, X. J., Zhao, P. S., Xu, J., Meng„ W., Pu, W. W., Dong, F., He, D., and Shi, Q. F.: Analysis of a winter regional haze event and its formation mechanism in the North China Plain, Atmos. Chem. Phys., 13, 5685–5696, doi:10.5194/acp-13-5685-2013, 2013.
Zheng, M., Salmon, L. G., Schauer, J. J., Zeng, L., Kiang, C. S., Zhang, Y., and Cass, G. R.:
20
ACPD
14, 20617–20646, 2014Aerosol composition and sources during the Chinese Spring
Festival
Q. Jiang et al.
Title Page Abstract Introduction Conclusions References Tables Figures ◭ ◮ ◭ ◮ Back Close
Full Screen / Esc
Printer-friendly Version Interactive Discussion Discussion P a per | Discus sion P a per | Discussion P a per | Discussion P a per |
2/1 2/4 2/7 2/10 2/13 2/16 2/19 2/22 2/25 2/28
Date & Time
360 270 180 90 0 WD ( °) 600 400 200 0 M a s s C onc. ( µ g m -3 ) 100 80 60 40 20 0 RH (% ) 10 0 -10 T ( °c ) 12 8 4 0 WS ( m s -1 ) 3000 2000 1000 0 b ext (M m -1 ) 120 100 80 60 40 20 0
PM2.5 NR-PM1+BC bext Lunar New Year Lantern Festival Lunar Fifth Day
Org SO4NO3 NH4Chl BC K
(a)
(b)
(c)
(d)
HD: 9-15 Feb. HD: 7-19 Feb.
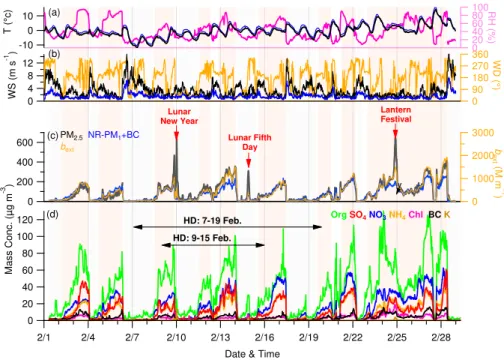
Figure 1.Time series of meteorological parameters(a)relative humidity (RH) and temperature
(T);(b)wind direction (WD) and wind speed (WS) at the height of 100 m; mass concentrations of(c)PM2.5and NR-PM1+BC and(d)submicron aerosol species. Also shown in(a)and(b)is the temperature and wind speed at the height of 8 m which are in blue. The extinction coefficient (bext) at 630 nm is shown in(c). Three events, i.e., Lunar New Year (LNY), Lunar Fifth Day (LFD) and Lantern Festival (LF) with significant influences of fireworks are marked in(c). In addition, the classified clean periods (CPs) and polluted events (PEs) are marked as shaded gray and pink areas, respectively.
ACPD
14, 20617–20646, 2014Aerosol composition and sources during the Chinese Spring
Festival
Q. Jiang et al.
Title Page
Abstract Introduction
Conclusions References
Tables Figures
◭ ◮
◭ ◮
Back Close
Full Screen / Esc
Printer-friendly Version Interactive Discussion
Discussion
P
a
per
|
Discus
sion
P
a
per
|
Discussion
P
a
per
|
Discussion
P
a
per
|
300
250
200
150
100
50
0
PM
1
(µ
g
m
-3 )
600 500 400 300 200 100 0
PM2.5 (µg m -3
)
NFW: f(x) = 0.90x + 21.6; r2 = 0.88
LNY: f(x) = 0.08x + 14.8; r2 = 0.78 LFD: f(x) = 0.19x + 18.4; r2 = 0.89 LF: f(x) = 0.17x + 112.9; r2 = 0.79
Figure 2.Correlation of PM1 vs. PM2.5 with the data segregated into three fireworks events
(LNY, LFD, and LF) and non-fireworks periods (NFW). The blank circles represent FW data between 18:00–23:30 on 9 February which had large influences from NFW sources.
ACPD
14, 20617–20646, 2014Aerosol composition and sources during the Chinese Spring
Festival
Q. Jiang et al.
Title Page
Abstract Introduction
Conclusions References
Tables Figures
◭ ◮
◭ ◮
Back Close
Full Screen / Esc
Printer-friendly Version Interactive Discussion
Discussion
P
a
per
|
Discus
sion
P
a
per
|
Discussion
P
a
per
|
Discussion
P
a
per
|
Organics
50%
SO4
2-13%
NO3
-2% NH4
+
6%
Chl
17%
K
5% BC 7% 55%
7%
12% 6% 11% 4%
4%
52%
13%
15% 11% 4%
5% 49%
16%
13% 9% 7%
5% 44%
14%
4% 3%
15% 21%
37%
13%
24%
15% 6%
5%
11%
28% 22%
39% 18%
59% 23% 18%
79% 3%
17.5 µg m-3 25.4 µg m-3 31.9 µg m-3
(a) Lunar New Year (b) Lunar Fifth Day (c) Lantern Festival
13.6 µg m-3 13.6 µg m-3 135.7 µg m-3
Fireworks
Background
COA
CCOA
HOA
OOA
Figure 3.Average chemical composition of PM1and OA from fireworks and background during
three FW events.
ACPD
14, 20617–20646, 2014Aerosol composition and sources during the Chinese Spring
Festival
Q. Jiang et al.
Title Page
Abstract Introduction
Conclusions References
Tables Figures
◭ ◮
◭ ◮
Back Close
Full Screen / Esc
Printer-friendly Version Interactive Discussion
Discussion
P
a
per
|
Discus
sion
P
a
per
|
Discussion
P
a
per
|
Discussion
P
a
per
|
2.5
2.0
1.5
1.0
0.5
0.0
Mass
Co
nc
. (µ
g m
-3 )
1.2
0.8
0.4
0.0
Mass
C
o
nc. (µ
g m
-3 )
100 90 80 70 60 50 40 30 20 10
m/z (amu)
0.12
0.08
0.04
0.00
F
ra
c
ti
on o
f S
igna
l
FW + BG
BG
MSFW LV-OOA
R2MS
FW vs. LV-OOA = 0.94
74 76
74
76
37 58 60
37 58 60
(a)
(b)
Figure 4. (a)Average mass spectra (MS) of OA during the firework period of Lunar New Year
(23:30, 9 February–03:30, 10 February) and the period of background (BG, 04:30–11:00, 10 February). (b) Comparison of the difference spectrum from (a), i.e., MSFW+BG – MSBG, with the average LV-OOA spectrum in Ng et al. (2011a). Fivem/z’s, 37 (37Cl+), 58 (NaCl+), 60 (Na37Cl+), 74 (KCl+), and 76 (K37Cl+/ 41KCl+) with significant influences of fireworks are marked.
ACPD
14, 20617–20646, 2014Aerosol composition and sources during the Chinese Spring
Festival
Q. Jiang et al.
Title Page
Abstract Introduction
Conclusions References
Tables Figures
◭ ◮
◭ ◮
Back Close
Full Screen / Esc
Printer-friendly Version Interactive Discussion
Discussion
P
a
per
|
Discus
sion
P
a
per
|
Discussion
P
a
per
|
Discussion
P
a
per
|
1 2 4 6 10
2 4 6 100
2
M
a
ss Conc.
(µ
g
m
-3 )
PM
1
SP
M
OO
A
NO
3
SO
4
NH
4
PP
M BC
Chl
HO
A
CO
A
CCO
A
1.0
0.8
0.6
0.4
0.2
0.0
M
a
s
s
F
rac
ti
on
SP
M
PP
M
Org NO
3
SO
4
NH
4
BC Chl
HO
A
CO
A
CCO
A
OO
A
(a) Secondary Primary (b) Frac. of PM1 Frac. of OA
Figure 5. Box plots of(a)mass concentrations and(b)mass fractions of aerosol species for
9 pollution events marked in Fig. 1. The mean (cross), median (horizontal line), 25th and 75th percentiles (lower and upper box), and 10th and 90th percentiles (lower and upper whiskers) are shown for each box.
ACPD
14, 20617–20646, 2014Aerosol composition and sources during the Chinese Spring
Festival
Q. Jiang et al.
Title Page Abstract Introduction Conclusions References Tables Figures ◭ ◮ ◭ ◮ Back Close
Full Screen / Esc
Printer-friendly Version Interactive Discussion Discussion P a per | Discus sion P a per | Discussion P a per | Discussion P a per | 1.0 0.8 0.6 0.4 0.2 0.0 Mass Fraction 200 160 120 80 40 0
PM1 (µg m
-3 ) 1.0 0.8 0.6 0.4 0.2 0.0 Mass Fraction 80 60 40 20 0
Org (µg m-3) 1.0 0.8 0.6 0.4 0.2 0.0 Mass Fraction 200 160 120 80 40 0
PM1 (µg m
-3 ) 1.0 0.8 0.6 0.4 0.2 0.0 24 20 16 12 8 4 0
Hour of Day 1.0 0.8 0.6 0.4 0.2 0.0 24 20 16 12 8 4 0
Hour of Day 1.0 0.8 0.6 0.4 0.2 0.0 24 20 16 12 8 4 0
Hour of Day 52%
48% 72%
28% 43%
49% 8%
Org SNA Others
SOA POA
SPM PPM
(a)
(c)
(b)
Figure 6.Left: variations of chemical composition of (a) organics, SNA (=sulfate+nitrate+
ammonium), and others (the rest species in PM1);(b)SPM and PPM; and(c)SOA and POA as a function of PM1and organics loadings, respectively. Right panels show their corresponding diurnal compositions.
ACPD
14, 20617–20646, 2014Aerosol composition and sources during the Chinese Spring
Festival
Q. Jiang et al.
Title Page
Abstract Introduction
Conclusions References
Tables Figures
◭ ◮
◭ ◮
Back Close
Full Screen / Esc
Printer-friendly Version Interactive Discussion
Discussion
P
a
per
|
Discus
sion
P
a
per
|
Discussion
P
a
per
|
Discussion
P
a
per
|
0.7
0.6
0.5
0.4
0.3
0.2
fOrg
2 4 6 8
10 2 4 6 8100 2
PM1 (µg m
-3
) 70 60 50 40 30 20
RH (%)
Clean Periods Pollution Events
10
2 4 6
100
2 4 6
1000
2
bEx
t
(M m
-1 )
4 6 8
10 2 4 6 8100 2
PM1 (µg m
-3
) f(x) = 6.4x - 222; r2 = 0.86
f(x) = 4.4x - 10; r2 = 0.96
(a) (b)
Figure 7. (a)Average mass fraction of organics (fOrg) as a function of PM1mass, and(b)
corre-lations of extinction coefficients (PM2.5) vs. PM1for 9 pollution events (PEs) and 9 clean periods (CPs) marked in Fig. 1. The error bar represents one standard deviations of the average for each event.