www.atmos-meas-tech.net/8/3315/2015/ doi:10.5194/amt-8-3315-2015
© Author(s) 2015. CC Attribution 3.0 License.
Retrieval and validation of carbon dioxide, methane and water
vapor for the Canary Islands IR-laser occultation experiment
V. Proschek1, G. Kirchengast1, S. Schweitzer2,1, J. S. A. Brooke3, P. F. Bernath4,3, C. B. Thomas3, J.-G. Wang3, K. A. Tereszchuk5,3, G. González Abad6,3, R. J. Hargreaves4,3, C. A. Beale4,3, J. J. Harrison3, P. A. Martin7, V. L. Kasyutich8,7, C. Gerbig9, O. Kolle9, and A. Loescher10
1Wegener Center for Climate and Global Change (WEGC) and Institute for Geophysics,
Astrophysics and Meteorology/Institute of Physics, University of Graz, Graz, Austria
2Institute for Surface Technologies and Photonics, Joanneum Research Forschungsgesellschaft mbH, Weiz, Austria 3Department of Chemistry, University of York, York, UK
4Department of Chemistry and Biochemistry, Old Dominion University, Norfolk, Virginia, USA 5Environment Canada, Toronto, Ontario, Canada
6Harvard-Smithsonian Center for Astrophysics, Cambridge, Massachusetts, USA
7School of Chemical Engineering and Analytical Science, University of Manchester, Manchester, UK 8Servomex, Jarvis Brook, Crowborough, UK
9Biogeochemical Systems Department, Max Planck Institute for Biogeochemistry, Jena, Germany 10Earth Observation Future Missions Division, ESA/ESTEC, Noordwijk, the Netherlands
Correspondence to:V. Proschek ([email protected])
Received: 19 May 2014 – Published in Atmos. Meas. Tech. Discuss.: 21 November 2014 Revised: 1 July 2015 – Accepted: 24 July 2015 – Published: 14 August 2015
Abstract. The first ground-based experiment to prove the concept of a novel space-based observation technique for mi-crowave and infrared-laser occultation between low-Earth-orbit satellites was performed in the Canary Islands be-tween La Palma and Tenerife. For two nights from 21 to 22 July 2011 the experiment delivered the infrared-laser differential transmission principle for the measurement of greenhouse gases (GHGs) in the free atmosphere. Such global and long-term stable measurements of GHGs, accom-panied also by measurements of thermodynamic parameters and line-of-sight wind in a self-calibrating way, have become very important for climate change monitoring. The experi-ment delivered promising initial data for demonstrating the new observation concept by retrieving volume mixing ra-tios of GHGs along a ∼144 km signal path at altitudes of
∼2.4 km. Here, we present a detailed analysis of the mea-surements, following a recent publication that introduced the experiment’s technical setup and first results for an example retrieval of CO2. We present the observational and validation data sets, the latter simultaneously measured at the
transmit-ter and receiver sites; the measurement data handling; and the differential transmission retrieval procedure. We also deter-mine the individual and combined uncertainties influencing the results and present the retrieval results for12CO
2,13CO2,
C18OO, H
2O and CH4. The new method is found to have
a reliable basis for monitoring of greenhouse gases such as CO2, CH4, and H2O in the free atmosphere.
1 Introduction
Several in situ and remote-sensing measurement principles have already been applied for long-term greenhouse gas (GHG) monitoring from ground-based stations, airplanes, and even satellites. The most widely known long-term in situ, ground-based CO2 measurements have been made at the Mauna Loa Observatory (Keeling, 1970). Measurements have been ongoing for some decades now, recording the an-thropogenically induced increases in atmospheric CO2levels
com-NOT Telescope
OGS Telescope
NOT Telescope
Tx on parking lot
OGS Telescope
Rx
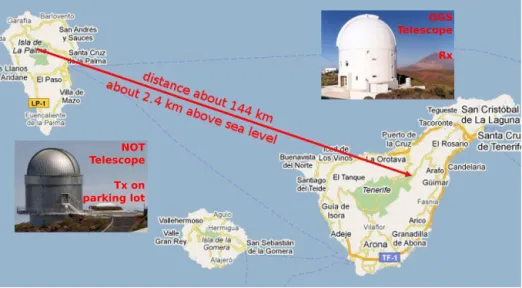
Figure 1.Schematic view of the∼144 km long-range infrared-laser link between La Palma (Tx) and Tenerife (Rx) and illustrative pictures
of the NOT parking lot location and the OGS telescope.
plementary ground-based (Yang et al., 2002; Brailsford et al., 2012; Messerschmidt et al., 2012) or airborne (Desjardins et al., 1989; Gurk et al., 2008; Vadrevu and Choi, 2011) CO2
measurement campaigns have been conducted for validation and calibration purposes, e.g., the Total Carbon Column Ob-serving Network (TCCON; Wunch et al., 2010).
Instruments on satellites – e.g., IASI (Infrared Atmo-spheric Sounding Interferometer; Chalon et al., 2001) on MetOp, AIRS (Atmospheric InfraRed Sounder; Chahine et al., 2006) on Aqua or SCIAMACHY (SCanning Imag-ing Absorption spectroMeter for Atmospheric CHartogra-phY; Bovensmann et al., 1999) on Envisat until 2012 – and missions like GOSAT (Greenhouse gas Observing SATellite; Hamazaki et al., 2004; Yokota et al., 2009; Yoshida et al., 2011) measure GHGs remotely from space on a long-term basis, albeit with significant limitations in altitude resolution, geographic coverage and accuracy due to the use of passive radiometry techniques that are challenging to calibrate.
Very precise and accurate measurements of GHG concen-trations and atmospheric parameters, including line-of-sight wind in the free atmosphere, self-calibrating and independent from external parameters, are needed for climate change ob-servations. In order to serve as climate benchmark measure-ments, these observations need to be made over long time periods in very stable and concise ways meeting high qual-ity standards. The new low-Earth-orbit (LEO) satellite obser-vation concept LEO-LEO Microwave and Infrared-laser Oc-cultation (LMIO), introduced by Kirchengast and Schweitzer (2011), provides such a measurement technique.
This active remote-sensing method uses the differential transmission principle (Kursinski et al., 2002; Gorbunov and Kirchengast, 2007; Kirchengast et al., 2010; Kirchengast and Schweitzer, 2011; Schweitzer et al., 2011a) for accurately measuring GHG concentrations. In particular, each GHG is
retrieved by the use of two closely spaced frequencies within the 2.0–2.5 µm spectral range “between” the solar and ter-restrial emission spectra. The broadband effects of the at-mosphere – such as Rayleigh and aerosol scattering, scin-tillation, and even subvisible cirrus cloud absorption – are removed by subtracting a nearby reference infrared-laser sig-nal outside the GHG absorption lines (“off sigsig-nal”) from an absorption signal located on a targeted GHG absorption line (“on signal”). In several studies – including Kirchengast et al. (2010), Schweitzer (2010), Schweitzer et al. (2011a, b), Proschek et al. (2011, 2014), Plach et al. (2015) and Synder-gaard and Kirchengast (2015) – detailed insight is given into the mission concept, the scientific objectives, the retrieval process, and examples of retrievals that were performed.
The first proof-of-concept experiment, which is described by Brooke et al. (2012) (referred to as Betal2012 here-after) and gives a technical overview of the ground-based ex-periment with preliminary results on CO2, was performed
between La Palma and Tenerife in the Canary Islands in July 2011 (see Fig. 1). These sites enabled the realization of a long-path ground link (∼144 km), with both transmitter (Tx) and receiver (Rx) locations at an altitude of∼2.4 km. The Tx platform at La Palma was mounted in the parking lot next to the Nordic Optical Telescope (NOT) and pointed towards the Rx telescope located at the Optical Ground Sta-tion (OGS) from ESA in Tenerife. At the OGS, a telescope with an aperture of 1 m in diameter was used to capture the infrared-laser signals, which were afterwards guided to a Rx breadboard.
The main part of the transmitter breadboard consisted of four tunable single-mode distributed feedback (DFB) lasers emitting in the shortwave infrared (SWIR) spectral range. Absorption lines of the main CO2 isotopes (12CO2,13CO2,
and the other two lasers covered CH4absorption in the spec-tral range near 2.3 µm. For the latter case, only one laser was used for the retrieval calculations in this study, since the other one was measuring at a reference-signal location somewhat away from suitable absorption lines. Both spectral windows used within 2.0–2.4 µm are generally insensitive to H2O sat-uration, and the signals were sufficiently strong for long-path absorption by the targeted GHGs, even with relatively low-power lasers (between 4 and 10 mW).
From the Tx side, infrared spectral scans over periods of up to about 20 min, with 4 s subperiods and spectral ranges of up to 2 nm from each of the IR lasers, were transmit-ted into the atmosphere. The infrared signals experienced molecular absorption and further broadband atmospheric ef-fects, such as scintillation, aerosol and Rayleigh scattering. We could visually confirm during the experiment that these free-atmosphere and cloud-free conditions prevailed along the laser link; nevertheless we experienced variable mete-orological conditions both near the Tx and Rx sites (e.g., changing wind conditions) and along the link (e.g., signif-icant moisture changes), which we needed to take into ac-count in the analysis and interpretation of results. The propa-gation beam path, for brevity termed ray path hereafter in this paper, was at all times running in the free atmosphere above the marine boundary layer, such that no low liquid clouds obscured the signals.
On the Rx side, the infrared-laser signals were captured by the OGS telescope. The signals were directed along the optical path of 39 m focal length into the Coudé room of the OGS, where they were focused onto the InGaAs photodiode detectors of the Rx breadboard assembly. A more detailed description of the setup and recording process is given by Betal2012.
In addition to the infrared spectra measured at the Rx, data sets for validation were recorded. The validation measure-ment instrumeasure-ments were located close to the Tx and Rx sites as listed in Table 1, where the (GPS-derived) positions of all measurement instruments used during the campaign are listed in terms of their latitude, longitude and altitude. To-gether, the IR-laser spectra and the validation data from these locations provided the basis for the detailed GHG retrieval analysis and measurement performance assessment for CO2,
CH4, and H2O in this study.
The study is organized as follows. Based on the observed data sets summarized in Sect. 2 and on the related data pro-cessing and GHG retrieval described in Sect. 3, a detailed un-certainty analysis is conducted (Sect. 4) and finally the GHG retrieval results are discussed (Sect. 5). Summary and con-clusions are given in Sect. 6.
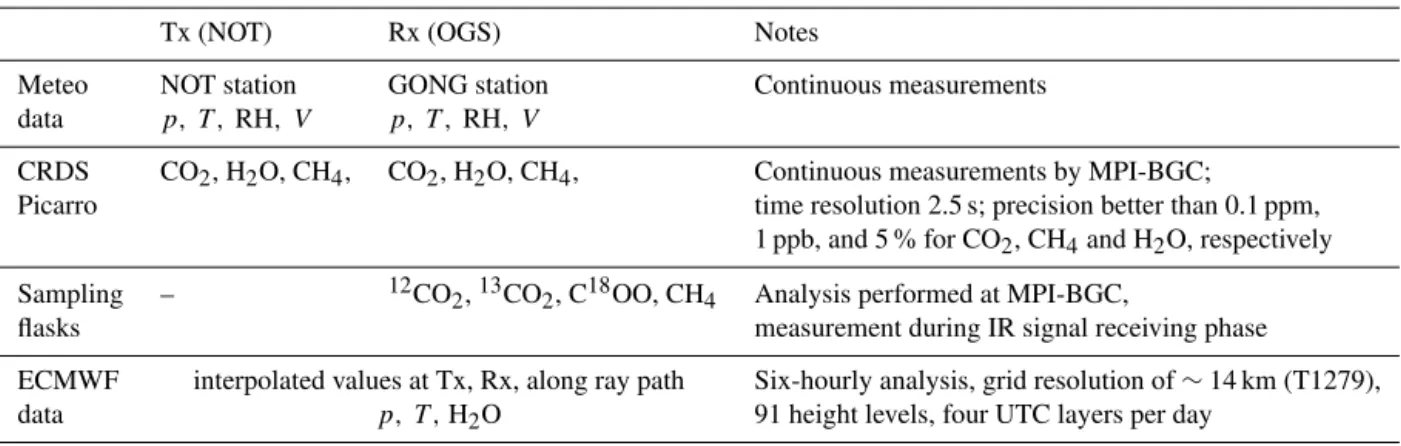
Table 1.GPS-derived positions of the telescopes/parking lot and the validation stations at the transmitter (Tx) and receiver (Rx) sites. The meteorological station near the OGS is named GONG (its customary local name) and the cavity ring-down spectrometer for in situ GHG measurements of the company Picarro is named CRDS. Table 3 provides more details on the data sets themselves.
Site Name Latitude Longitude Altitude
[deg] [deg] [m]
Tx NOT parking lot 28.75720 −17.88502 2390 NOT meteo station 28.75690 −17.88498 2398 CRDS Picarro 28.75660 −17.88505 2390
Rx OGS telescope 28.30097 −16.51183 2393 GONG meteo 28.30058 −16.51218 2393 station
CRDS Picarro 28.30103 −16.51192 2393 Sampling flasks 28.30103 −16.51192 2393
2 Observational and validation data sets 2.1 Observational data set
In the course of the field campaign, we effectively recorded useful data sets of infrared-laser transmission spectra during two nights, 21 and 22 July 2011. We applied a “fast scan” mode (400 Hz native scan rate) for narrow (∼1 cm−1) or
broadband (∼3–4 cm−1) spectral ranges. The raw data
con-sist of alternative records of the two active lasers (L1+L2 or L3+L4), which were alternatively activated for 4 s at any one time within the whole measurement period (of up to ∼20 min). The spectral ranges covered by the two ac-tive lasers typically were different, but they also overlapped in some cases as some lasers were able to scan the same spectral regions. In a preprocessing, these raw data were averaged over 4 s. A detailed description of the scanning– recording process is given by Betal2012, Sect. 2 and Ap-pendix A therein.
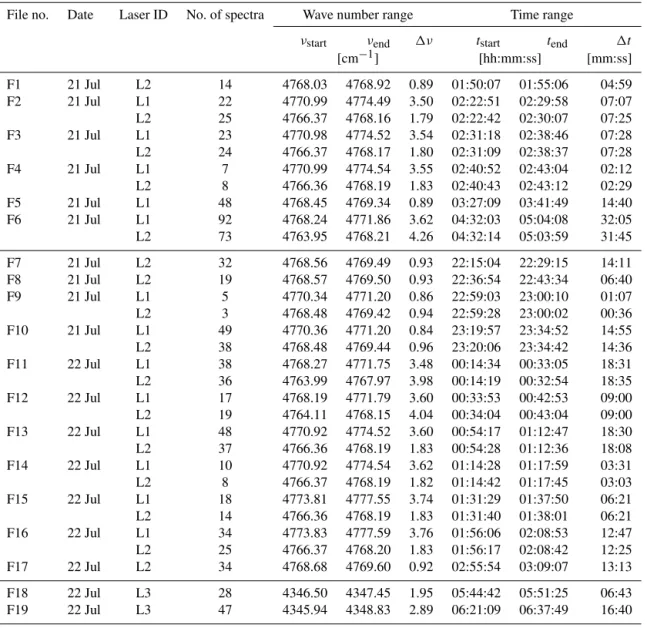
The recorded set of measurements, summarized in Ta-ble 2, was deemed suitaTa-ble for data retrieval as the mea-surements contained adequate absorption lines, a sufficient spectral range, and an acceptable signal-to-noise ratio (SNR). This set contains 19 data files, measured in the two nights of 21 and 22 July. At the bottom of the table, the two CH4
spec-tral range measurements are listed which were recorded at the end of the campaign during the night of 22 July. As can be seen from the third column of Table 2, three lasers (L1, L2, L3) effectively yielded useful absorption spectra; laser L4 covered no adequate CH4absorption lines (see also the discussion below in Sect. 3).
Table 2.Preprocessed infrared-laser link data sets available for the GHG retrieval. For description see Sect. 2.1. File no. Date Laser ID No. of spectra Wave number range Time range
νstart νend 1ν tstart tend 1t
[cm−1] [hh:mm:ss] [mm:ss]
F1 21 Jul L2 14 4768.03 4768.92 0.89 01:50:07 01:55:06 04:59
F2 21 Jul L1 22 4770.99 4774.49 3.50 02:22:51 02:29:58 07:07
L2 25 4766.37 4768.16 1.79 02:22:42 02:30:07 07:25
F3 21 Jul L1 23 4770.98 4774.52 3.54 02:31:18 02:38:46 07:28
L2 24 4766.37 4768.17 1.80 02:31:09 02:38:37 07:28
F4 21 Jul L1 7 4770.99 4774.54 3.55 02:40:52 02:43:04 02:12
L2 8 4766.36 4768.19 1.83 02:40:43 02:43:12 02:29
F5 21 Jul L1 48 4768.45 4769.34 0.89 03:27:09 03:41:49 14:40
F6 21 Jul L1 92 4768.24 4771.86 3.62 04:32:03 05:04:08 32:05
L2 73 4763.95 4768.21 4.26 04:32:14 05:03:59 31:45
F7 21 Jul L2 32 4768.56 4769.49 0.93 22:15:04 22:29:15 14:11
F8 21 Jul L2 19 4768.57 4769.50 0.93 22:36:54 22:43:34 06:40
F9 21 Jul L1 5 4770.34 4771.20 0.86 22:59:03 23:00:10 01:07
L2 3 4768.48 4769.42 0.94 22:59:28 23:00:02 00:36
F10 21 Jul L1 49 4770.36 4771.20 0.84 23:19:57 23:34:52 14:55
L2 38 4768.48 4769.44 0.96 23:20:06 23:34:42 14:36
F11 22 Jul L1 38 4768.27 4771.75 3.48 00:14:34 00:33:05 18:31
L2 36 4763.99 4767.97 3.98 00:14:19 00:32:54 18:35
F12 22 Jul L1 17 4768.19 4771.79 3.60 00:33:53 00:42:53 09:00
L2 19 4764.11 4768.15 4.04 00:34:04 00:43:04 09:00
F13 22 Jul L1 48 4770.92 4774.52 3.60 00:54:17 01:12:47 18:30
L2 37 4766.36 4768.19 1.83 00:54:28 01:12:36 18:08
F14 22 Jul L1 10 4770.92 4774.54 3.62 01:14:28 01:17:59 03:31
L2 8 4766.37 4768.19 1.82 01:14:42 01:17:45 03:03
F15 22 Jul L1 18 4773.81 4777.55 3.74 01:31:29 01:37:50 06:21
L2 14 4766.36 4768.19 1.83 01:31:40 01:38:01 06:21
F16 22 Jul L1 34 4773.83 4777.59 3.76 01:56:06 02:08:53 12:47
L2 25 4766.37 4768.20 1.83 01:56:17 02:08:42 12:25
F17 22 Jul L2 34 4768.68 4769.60 0.92 02:55:54 03:09:07 13:13
F18 22 Jul L3 28 4346.50 4347.45 1.95 05:44:42 05:51:25 06:43
F19 22 Jul L3 47 4345.94 4348.83 2.89 06:21:09 06:37:49 16:40
the starting (νstart) and ending (νend) wave numbers and
asso-ciated range widths (1ν) are given as well. Furthermore, the duration of each of the recorded measurements is shown in the last three columns of Table 2. These columns represent the start time of the first 4 s scan (tstart), the end 4 s scan (tend)
and the total time (1t) for each laser in the associated file. Since the spectra were preprocessed and underwent basic quality control (Betal2012, Appendix A therein), the record-ing time per data file varied from approximately∼1 min up to nearly 30 min, depending on the stability of the conditions during the measurements. Hence, the files contain from just 3 up to more than 90 successfully processed 4 s spectra. Putting the SNR achieved for this basic 4 s averaging period of the experiment into context with the actual spaceborne LMIO method, the latter still achieves higher SNR with its 2 ms av-eraging period during the fast vertical scan through the
atmo-sphere, since its Tx-to-Rx link power budget is more favor-able (Schweitzer et al., 2011a, Sect. 3.7 therein).
2.2 Validation data set
A crucial complementary part of the measurement campaign was the recording of validation data to support the proof of concept of the GHG retrieval results from the long-range infrared-laser link. Two different measurement instrument sources on the Tx site and three on the Rx site enabled a val-idation of the GHG concentrations retrieved from the mea-sured IR-laser data. Therefore it is important to take into ac-count also limitations of the representativeness of these local measurements for the concentrations averaged over the IR-laser link. The data sources are listed in Table 3.
sta-Table 3.Validation data set taken, or used from available sources, during the measurement campaign. For description see Sect. 2.2.
Tx (NOT) Rx (OGS) Notes
Meteo NOT station GONG station Continuous measurements
data p, T ,RH, V p, T ,RH, V
CRDS CO2, H2O, CH4, CO2, H2O, CH4, Continuous measurements by MPI-BGC;
Picarro time resolution 2.5 s; precision better than 0.1 ppm,
1 ppb, and 5 % for CO2, CH4and H2O, respectively
Sampling – 12CO2,13CO2, C18OO, CH4 Analysis performed at MPI-BGC,
flasks measurement during IR signal receiving phase
ECMWF interpolated values at Tx, Rx, along ray path Six-hourly analysis, grid resolution of∼14 km (T1279),
data p, T ,H2O 91 height levels, four UTC layers per day
tion, containing the pressure (p)in Pa, temperature(T )in K, relative humidity (RH) in percent, and the wind speed (V )in m s−1. Additionally, a CRDS (cavity ring-down spec-trometer, model G1301-m, Picarro Inc., CA, USA) continu-ously recorded the CO2, H2O, and CH4dry-air mole
frac-tion in parts per million (ppm), at a time resolufrac-tion of 2.5 s. CRDS measurement accuracy was within the compatibil-ity targets of 0.1 ppm (CO2), 2 ppb (CH4), and 5 % (H2O)
(WMO, 2012). The CRDS was calibrated before and after the campaign against ambient air standards traceable to the re-spective WMO scales for CH4and CO2, and against a NIST traceable dewpoint mirror for H2O; no significant drift was observed. In this paper we refer to volume mixing ratio(V) in parts per million by volume (ppmv), since this is the unit given for our retrieval results, rather than to mole fraction (the differences being not relevant for the limited accuracy needed here). The inlet of the CRDS was installed about 2 m above the roof of the NOT service building, aiming at locally undisturbed and clean air conditions.
At the Rx site, the same set of meteorological observables as at the Tx site was available from the weather station of the Global Oscillation Network Group (GONG), comprising p, T, RH andV again as 1 min sampled data. A second CRDS instrument installed at the Rx site recorded the same set of GHGs as at the Tx site, and with the same time resolution and accuracy. In this case, the inlet was mounted 2 m over the ground and about 4 m from the dome of the OGS, again aiming to ensure undisturbed and clean air conditions. In ad-dition, we collected air sample flasks at the Rx site. The inlet for these flasks was placed next to the CRDS inlet. The sam-ple flasks were filled roughly every 3 h during the measure-ment times and were analyzed 4 months after the campaign at the gas analytics and isotope laboratories of the Max Planck Institute for Biogeochemistry (MPI-BGC) in Jena, Germany, determining the isotope ratiosδ13CO2andδC18OO as well as the dry-air mole fractions of CH4with an accuracy that lies
well within the compatibility goals recommended by WMO (2012) of 0.01 and 0.05 ‰, and 2 ppb, respectively.
Additionally, auxiliary three-dimensional meteorological analysis field data from the European Centre for Medium-Range Weather Forecasts (ECMWF) were acquired over a 330 km×330 km area comprising the Canary Islands, provid-ing high-resolution six-hourly analyses of the local pressure, temperature, and humidity conditions during the campaign period. These ECMWF analysis fields were used for (co-located) cross-check of the local meteorological data from the weather stations at the Tx and Rx sites, for providing the meteorological information for realistic ray tracing along the Tx-to-Rx signal propagation path, and for providing the needed ray-path-averaged meteorological parameters to de-termine the GHG volume mixing ratios from differential transmissions during the iteration calculations of the retrieval process (see Sect. 3.2 for details).
In Fig. 2, the validation data sets are illustrated, spanning the time of the measurement campaign during which useful transmission data were acquired. In particular, the data over the 48 h from 12:00 UTC on 20 July to 12:00 UTC on 22 July are shown. The vertical dotted lines indicate the three infrared-laser measurement time windows within which all measurement files summarized in Table 2 were acquired.
In the top panel of Fig. 2, where temperature and pressure are illustrated, the gray shadings indicate a+1 % temperature deviation and a−1 % pressure deviation, respectively. These percentage deviations correspond to the deviations of the weather station values from the co-located ECMWF values, which were found to occur in a rather stable manner from cross-checking the data during the times of infrared-laser link measurements at both the Tx and Rx locations. During the measurement times, both temperature and pressure evidently undergo rather weak fluctuations of up to about 2 K and 2 hPa only; i.e., the thermodynamic conditions were fairly stable during these nights.
In the upper-middle panel, where the H2O volume
meteoro-Figure 2.Time series of meteorological weather data and GHG validation data spanning the infrared-laser link measurements periods, which are delimited by dotted vertical lines (cf. times in Table 2). Top panel: 10 min averaged temperature (triangles) and pressure (circles) data from the weather stations at the Tx (green) and Rx (blue) sites; the gray-shaded areas indicate the respective deviations of the co-located ECMWF data at the Tx and Rx sites. Upper-middle panel: 10 min averaged H2O volume mixing ratio (V) from the meteorological weather stations
(triangles), the CRDS instruments (circles), and co-located ECMWF data (stars; those interpolated to infrared-laser link measurement times) at the Tx and Rx sites. Lower-middle panel: 10 min averaged CRDSVdata for CO2(triangles) and CH4(circles) at the Tx and Rx sites.
logical equations applicable in moist air. It is evident that a significant negative deviation of the meteorological sta-tion data to the CRDS data exists at the Tx site, while a significant positive deviation occurs at the Rx site. These longer-timescale deviations seem to be systematic, while the smaller-timescale fluctuation patterns of the CRDS and the weather station data resemble each other fairly well.
Therefore, we interpret the deviations as primarily being a bias of the weather station data since the CRDS mea-surements underwent calibrations before and after the cam-paign, confirming their high accuracy as stated above. Possi-bly the humidity sensor of the weather station provides low accuracy, though no clarification could be found from local weather station operators. Thus, the CRDS data are consid-ered more trustworthy. They are also in better overall agree-ment with the comparatively smooth ECMWF data, which show weak sensitivity regarding the local moisture varia-tions. The reason is that the ECMWF grid resolution (about 14 km) and time resolution (6 h) are much coarser than the local variability, so local variations are strongly smoothed.
In inspection of the moisture conditions during the IR-laser link measurement times, theVH2Odata indicate a strong difference of up to about 0.8 % between the Tx and Rx site. This significant horizontal variation from La Palma to Tener-ife suggests assuming conservative bounds of representativ-ity of the in situ values for the along-ray conditions. We will therefore assume a rather high relative uncertainty (of
∼50 %) for the knowledge of H2O concentration from the
validation data, as seen below in Sect. 4.
The lower-middle panel of Fig. 2 shows the CRDS data for CO2 and CH4, which generally exhibit somewhat stronger variability at the Tx site, indicating more capacity for local-scale meteorological and composition fluctuations at this site. Furthermore, an anti-correlated link between the CO2 and CH4 variations, and also a link to the H2O variations (upper-middle panel), is clearly visible; i.e., CO2 increases are associated with CH4 decreases and H2O increases. The
magnitude of the variations is small, however, both over time and regarding the differences between the Tx and Rx sites, amounting to relative changes of only about 1–2 % in these well-mixed GHG volume mixing ratios.
For completeness, the bottom panel shows the wind speeds at both the Tx and Rx sites. The wind speeds at the Tx site are systematically stronger by a factor of 2 to 3. This is pri-marily due to the specific topographical conditions at the Tx site at La Palma around the NOT parking lot, where a rather steep outer hillslope on the one side meets with a steep wall down into the volcanic crater not far away on the other side. The surroundings of the OGS telescope at Tenerife at the Rx site are much smoother; this location is characterized by an extended gentle hillslope in the surroundings. The stronger dynamics at the Tx site is also reflected in the stronger GHG dynamics noticed in the panels above, in particular during the night. The Tx wind speeds were persistently above 10 m s−1,
and frequently up to about 15 m s−1, which posed challenges
-17.8 -17.6 -17.4 -17.2 -17.0 -16.8 -16.6
Longitude [deg]
0.0
0.1
0.2
0.3
0.4
0.5
0.6
H
2O
Vo
lum
e M
ixi
ng
Ra
tio
[%
]
21st: 01:5021st: 02:2221st: 02:31 21st: 02:40 21st: 03:27 21st: 04:32 21st: 22:14 21st: 22:36 21st: 22:59 21st: 23:19 22nd: 00:14 22nd: 00:33 22nd: 00:54 22nd: 01:14 22nd: 01:31 22nd: 01:56 22nd: 02:55 22nd: 05:44 22nd: 06:21
2.0
2.1
2.2
2.3
2.4
2.5
2.6
Altit
ude
[km
]
Rx (OGS)
Tx (NOT)
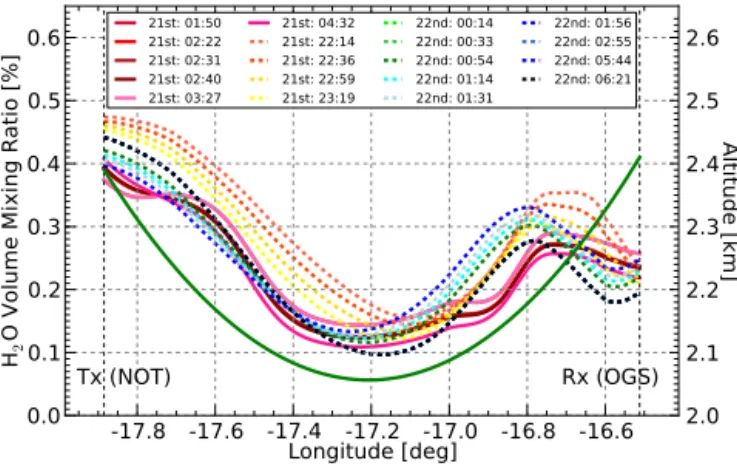
Figure 3.H2O volume mixing ratio along the Tx-to-Rx ray path
(longitude coordinate shown) based on interpolated ECMWF anal-ysis fields, for ray-tracing performed at the starting time of each IR-laser link data file (Table 2). In addition, the altitude of the ray path above mean sea level is indicated (thick green line; right-hand-side axis), which, due to Earth’s curvature over the 144 km distance, is more than 300 m lower at mid-distance than the altitudes of the Tx and Rx sites.
to the stability of the Tx telescope pointing towards the OGS during the IR-laser link measurement sometimes, such that occasional re-adjustments were necessary (Betal2012).
In order to provide context information for water vapor, the most variable species along the Tx-to-Rx ray path, Fig. 3 vi-sualizes the H2O volume mixing ratio (VH2O) variation along
the ray path based on ECMWF analysis data. TheVH2O val-ues vary considerably between about 0.1 and 0.5 %, whereby the spread is smaller during the first measurement night than during the second night. The high horizontal variability in-dicated here further underscores the necessity to assign a conservative uncertainty range to the water vapor knowledge available from the validation data.
3 Data processing setup and retrieval algorithm 3.1 Data processing setup
Table 4. Absorption line center frequencies and corresponding reference frequency allocations used in the retrieval, complemented by information on spectroscopic parameter uncertainties from HITRAN08 for the two most relevant line parameters, line intensity and air-broadened half width.
Species peak ID Abs. line Ref. line 1(Abs-Ref) 1S 1γair
[cm−1] [cm−1] [cm−1] [%] [%]
12CO2-1 4767.37 4767.20 0.17 ≥10 and<20 ≥5 and<10 12CO
2-2 4772.63 4772.82 −0.19 ≥10 and<20 ≥5 and<10
13CO2-1 4766.64 4766.40 0.24 ≥10 and<20 ≥5 and<10
C18OO-1 4767.04 4767.20 −0.16 ≥10 and<20 ≥5 and<10 C18OO-2 4768.79 4768.90 0.11 ≥10 and<20 ≥5 and<10 C18OO-3 4770.53 4770.20 0.33 ≥10 and<20 ≥5 and<10 H2O-1 4768.40 4768.68 −0.28 ≥ 5 and<10 <1 H2O-2 4776.59 4776.75 −0.16 ≥ 5 and<10 ≥1 and< 2
CH4-1 4346.73 4346.95 −0.22 ≥ 2 and< 5 ≥20
CH4-2 4348.16 4348.33 −0.17 ≥ 2 and< 5 ≥2 and< 5
the more recent HITRAN 2012 database (Rothman et al., 2013) and found that any changes are small for our wave number ranges of interest and would not lead to any relevant changes in results. We therefore kept using the HITRAN08 database, which was also used by Betal2012.
As a simple model for expected GHG concentrations, we invoked the Fast Atmospheric Signature Code model (FAS-CODE, 2008). More specifically, we adopted a basic set of volume mixing ratiosVfor four GHGs, namely 380 ppmv of CO2, 1.7 ppmv of CH4, 0.32 ppmv of N2O, and 0.13 ppmv
of CO, all assumed to be homogeneously mixed in the atmo-sphere, i.e., with no volume mixing ratio changes in the ray path domain. For H2O, we used the variable concentrations from the ECMWF analysis fields, and pressure and tempera-ture were also taken from these fields.
3.1.1 Absorption and reference line allocation
The first important step was to find adequate absorption lines of GHGs in the available IR-laser-scanned spectral regions for the following set of GHGs:X={12CO2,13CO2, C18OO,
CH4H2O}. The last two are meant to be the main isotopes of
methane and water vapor. All isotopes of a GHG make up a certain ratio of the total concentration of this GHG, with the isotopic abundance factors taken from HITRAN08. Given all the uncertainties involved in this basic IR-laser demonstra-tion experiment (discussed further below), more recent fac-tors or more refined mole fraction values are not needed.
The setXof GHGs and the corresponding absorption line center frequencies, plus the chosen reference frequencies, are listed in Table 4. We selected 10 usable absorption lines, in-cluding 2 for12CO
2, 1 for13CO2, 3 for C18OO, 2 for H2O,
and 2 for CH4. In order to avoid broadband effects, the ref-erence frequencies are selected close by, as in the satellite-based IR-laser occultation concept, within a spectral distance of 0.15–0.35 cm−1. The rightmost two columns of Table 4
additionally show the HITRAN08 uncertainty estimates of
the two spectroscopic parameters found to be of primary rel-evance to the overall uncertainty in our context here, the line intensity uncertainty 1S and the air-broadened half-width uncertainty1γair. The impact of these two (considerable)
un-certainties will be discussed in Sect. 4.
In Fig. 4 we illustrate a subset of simulated and measured IR-laser link transmission spectra to facilitate the under-standing of the spectral characteristics and the measurement conditions. Individual absorption contributions of the tar-geted GHGs are well distinguished, as is the spectral broad-ening of the measured spectra, which is due to suboptimal de-tector gain settings during the spectral scanning. A high gain setting was necessary due to the strong atmospheric losses (in particular from beam divergence and molecular absorp-tion), which limited the bandwidth and thus the response of the detector to rapid changes in laser power (for more tech-nical detail see Betal2012; correction of this broadening for our purpose is discussed below).
The simulated total transmission spectra take all GHGs of setX into account, in addition to the absorption due to N2O and CO. However, these two GHGs are found to have
no relevant absorption contribution within the wave number ranges of interest; potential influences of such foreign GHGs on the absorption and reference channel transmissions will be discussed in Sect. 4. The chosen pairs of absorption and reference channels, marked by dotted lines, evidently ful-fill well the requirements for the IR-laser occultation dif-ferential transmission principle and therefore allow the basic demonstration of this principle based on the long-path inter-island transmission data. It is evident that a correction for the suboptimal-detector-gain-related spectral broadening of the measured spectra will be needed, which will add also to the uncertainty budget.
The bottom panel of Fig. 4 illustrates that the CH4
mea-surements by laser L3 in the 4346–4349 cm−1 wave
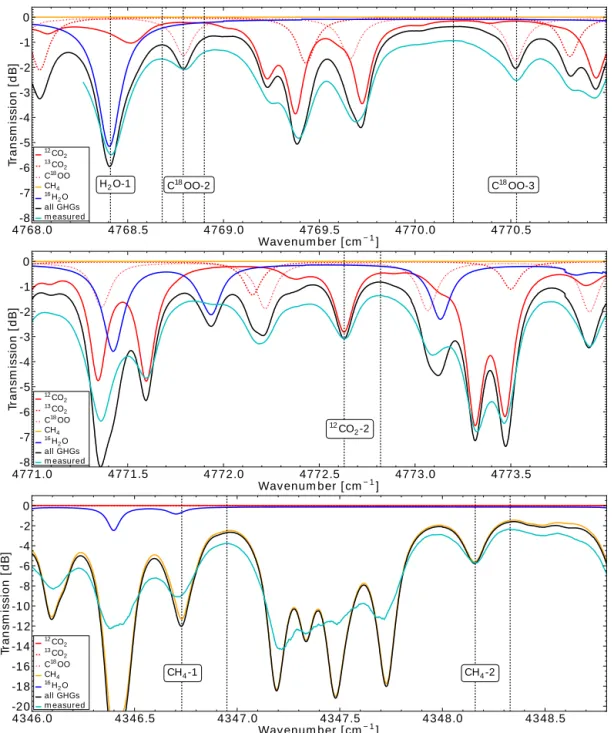
Figure 4.Examples of simulated transmission spectra of targeted GHG isotopes (see in-panel legends; for H2O and CH4the main isotopes
are utilized), of corresponding total transmission spectra from all GHGs (black curves), and of associated measured spectra (cyan curves). The respective absorption line center frequencies and nearby reference frequencies, according to Table 4, are marked by dash-dotted vertical lines, and the corresponding target GHGs are noted below the respective absorption line peaks. Three example wave number ranges are illustrated: one containing lines for H2O-1, C18OO-2, and C18OO-3 (top panel); one for12CO2-2 (middle panel); and the two lines chosen for CH4(bottom panel). The transmission alignment of the measured and simulated spectra is done in these panels for the C18OO-2,12CO2-2
and CH4-2 absorption peaks, respectively.
needs to be expected to be of degraded quality compared to the CO2isotope retrievals.
In the spectra of Fig. 4 we can furthermore clearly see the broadband contribution of all GHGs to the total absorp-tion and reference channel transmissions of a targeted GHG.
An example is the weak influence of H2O on the12CO 2-2
channels (middle panel) such that the fairly uncertain H2O concentration need not be simulated accurately in this case. On the other hand, an example for a noticeable influence is provided by the two C18OO-2 channels (top panel); the
ad-jacent H2O-1 absorption line will leave some residual error in the differential transmission of the C18OO-2 absorption–
reference channel pair. Careful quantification and effec-tive correction of such foreign GHG influences in the self-calibrating IR-laser occultation retrieval procedure have been worked out by Schweitzer et al. (2011a) and Proschek et al. (2011). In the context of the experiment data analysis psented here, the quantification of such influences on the re-trieval results will be given in Sect. 4.
3.1.2 Spectral broadening correction
The above-mentioned experiment-specific fact of suboptimal detector gain settings while scanning and recording the spec-tra (Betal2012, details in Appendix A5 therein) led to some artificial broadening of the measured spectral lines, as could already be seen in Fig. 4 and as is more specifically shown in Fig. 5 for three example GHG absorption lines.
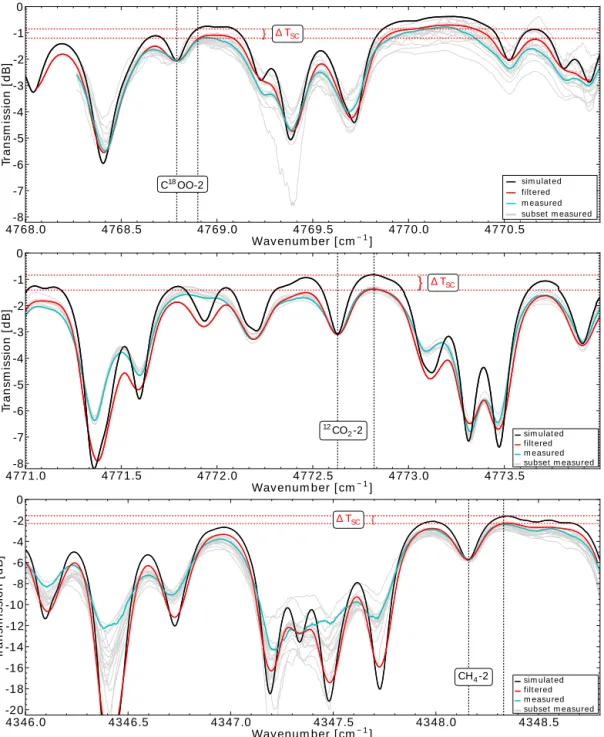
In aligning measured and forward-modeled (simulated) transmissions at the absorption channel, the broadening in the measured spectrum becomes visible in the form of a de-creased differential transmission between absorption and ref-erence channel in comparison to the forward-modeled spec-trum; this difference is marked in Fig. 5 as1TSCand serves as a spectral correction term in the retrieval to achieve a proper match of forward-modeled and measured differen-tial transmissions. In other words,1TSCcompensates for the suboptimal detector gain settings during acquisition of the IR-laser link data files (Table 2) in the course of the experi-ment. We emphasize that in actual IR-laser occultation mea-surements such a correction term would not occur; it is just an inadvertent additional effect of this first demonstration ex-periment (Betal2012).
The spectral correction term 1TSC clearly needs to be taken into account in the retrieval process of the campaign data, as it would otherwise bias the GHG results. In order to practically determine1TSCfor the chosen absorption lines (Table 4), we applied a box-car moving average filter to the forward-modeled (simulated) spectra such that the resulting filtered and therefore broadened simulated absorption line best matches the measured absorption line of interest. The difference between the original simulated transmission and the filtered–simulated transmission at the reference channel then determines the spectral correction term, as marked in the panels of Fig. 5.
For example, for the C18OO-2 absorption line (upper panel
of Fig. 5) a1TSC of ∼0.33 dB is estimated, which results from best matching the C18OO-2 absorption line of a
sured spectrum, randomly drawn from the subset of mea-sured 4 s spectra (gray lines) in a given IR-laser link data file,
by the broadened C18OO-2 absorption line of the filtered–
simulated spectrum. Different absorption lines in different IR-laser link data files (where adjustments of measurement settings may have occurred between acquisitions) may have received different broadening and therefore can lead to dif-ferent correction terms1TSCas is also illustrated by the dif-ferent panels in Fig. 5.
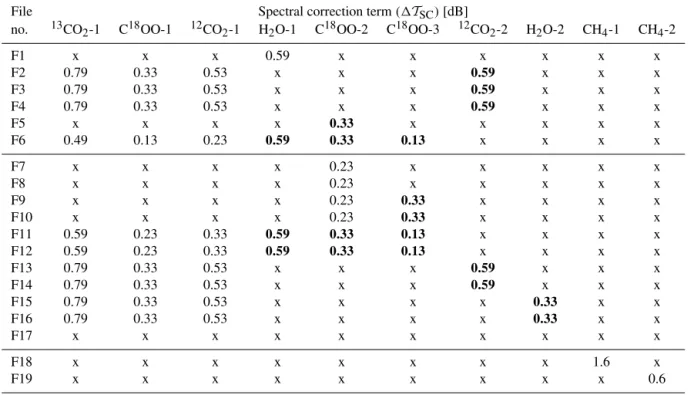
In practice, the estimation and application of a specific spectral correction term was necessary for all IR-laser link data files and all chosen absorption lines, not only because of the changing measurement settings but also because of the broadband wave number ranges where the broadening of ab-sorption lines was uneven over the scanned range (for tech-nical details on data acquisition and raw spectra, wavelength calibration, and detector gain and offset issues see Betal2012, Appendix A therein). Table 5 lists all applicable spectral cor-rection terms1TSCdetermined for the 19 available data files (Table 2) and the 10 chosen absorption lines (Table 4).
The elaborate matching analysis of filtered–simulated and measured spectra, accompanied by comprehensive sensitiv-ity tests for rough but robust estimation of uncertainties, revealed a reasonable systematic behavior of the spectral broadening effects in the different IR-laser link data files and their different lasers and wave number scan ranges. The dif-ferent1TSC values result from the inadvertent broadening process due to detector gain issues having influenced narrow and deep absorption lines in a stronger way than broad and shallow lines. In addition, this “natural” behavior of the filter-ing can be somewhat perturbed by close neighbor absorption lines as well as near the margins of the scanned wavelength ranges.
In general, as Table 5 shows, the correction terms1TSC appear to be stable over data file acquisitions with the same lasers and the same wavelength scan ranges, i.e., when the measurement settings evidently have been (largely) the same. A good example is the files F2–F4 and F13–F16, regarding the three CO2 isotope absorption lines scanned by laser L2
(first three species columns) as well as the12CO2absorption
line scanned by laser L1 (seventh species column).
Other data files show similar patterns, also those including narrow wave number scan ranges that support a single ab-sorption line only with each given laser, such as files F7–F10 (cf. Table 2). The1TSCuncertainties listed in the caption of Table 5 have been estimated from the spread of the1TSC values obtained from using the many individual 4 s spectra in the various data files.
As a specific case, the CH4-1|2 correction term values of 1.6 and 0.6 dB were found to be fairly high, given the nar-rowness and depth of the respective absorption lines. This is because of the quality of the two CH4data files taken towards the very end of the campaign (files F18 and F19), which is clearly degraded compared to all other data files as men-tioned above and as reported by Betal2012. Therefore, the CH4 retrieval results have to be treated with caution. More
Figure 5.Examples of simulated spectra (black), filtered–simulated spectra (red), and measured spectra (cyan) from a typical set of measured
spectra (gray), illustrating the spectral broadening, are aligned and marked in the same way as in Fig. 4. The wave number ranges illustrated in the three panels are the same as in Fig. 4, and the absorption lines illustrating the spectral broadening correction are marked in the same way as in Fig. 4.1TSCmarks the increment of differential transmission that is missing due to the line broadening in the measured data and
that is therefore to be corrected for. The bundle of measured spectra shown in gray illustrates that any correction term1TSCwill also bring
in some added uncertainty.
3.2 Retrieval algorithm
The aim of the GHG retrieval in this study is to demonstrate the differential transmission principle, which is the core of the IR-laser occultation processing part of the LMIO method (e.g., Proschek et al., 2011). Therefore, no full spectral fit of
Table 5.Spectral correction terms1TSCestimated for the 10 chosen GHG absorption lines of the 19 IR-laser link data files available for
retrieval processing. An uncertainty of±0.1 dB was co-estimated for the1TSCbest-estimate values of 0.79, 0.59 and 0.53, of±0.09 dB for
0.49, of±0.08 dB for 0.33 and 0.23, and of±0.07 dB for 0.13, respectively. The CH41TSCvalues were estimated as 1.6 and 0.6, with an
uncertainty of±0.13 dB. The numbers in bold represent the measurements with laser L1, and the upright numbers those with laser L2; the CH4measurements were performed with laser L3.
File Spectral correction term(1TSC)[dB]
no. 13CO2-1 C18OO-1 12CO2-1 H2O-1 C18OO-2 C18OO-3 12CO2-2 H2O-2 CH4-1 CH4-2
F1 x x x 0.59 x x x x x x
F2 0.79 0.33 0.53 x x x 0.59 x x x
F3 0.79 0.33 0.53 x x x 0.59 x x x
F4 0.79 0.33 0.53 x x x 0.59 x x x
F5 x x x x 0.33 x x x x x
F6 0.49 0.13 0.23 0.59 0.33 0.13 x x x x
F7 x x x x 0.23 x x x x x
F8 x x x x 0.23 x x x x x
F9 x x x x 0.23 0.33 x x x x
F10 x x x x 0.23 0.33 x x x x
F11 0.59 0.23 0.33 0.59 0.33 0.13 x x x x
F12 0.59 0.23 0.33 0.59 0.33 0.13 x x x x
F13 0.79 0.33 0.53 x x x 0.59 x x x
F14 0.79 0.33 0.53 x x x 0.59 x x x
F15 0.79 0.33 0.53 x x x x 0.33 x x
F16 0.79 0.33 0.53 x x x x 0.33 x x
F17 x x x x x x x x x x
F18 x x x x x x x x 1.6 x
F19 x x x x x x x x x 0.6
event, would not provide spectra but rather accurately mea-sured “monochromatic” data for selected absorption and ref-erence channels (Kirchengast and Schweitzer, 2011).
Given the limited accuracy of the wavemeter and the wave-length calibration in the experiment (Betal2012), the absorp-tion line center frequencies of the campaign data do fairly well but not exactly match the nominal line center wave num-ber values according to Table 4. The first step of the retrieval was therefore, for each chosen absorption line, to search in the measured spectra at the Rx site for the wave number of the peak of the targeted absorption line, starting from the nominal wave number of the simulated absorption line cen-ter, and to extract the corresponding signal amplitude in the Tx and Rx signal,AAbs,TxandAAbs,Rx.
This was followed by the search for the associated refer-ence channel wave number, chosen to be the wave number of minimum absorption in the nominal wave number inter-val between the respective reference and absorption channel (cf. Table 4), and by extracting at this wave number the cor-responding signal amplitude,ARef,TxandARef,Rx. Typically, these minimum-absorption wave numbers were found just near the nominal reference wave numbers since the nomi-nal wave numbers had been selected to approximately corre-spond to the first absorption minimum (“valley”) adjacent to the targeted absorption line maximum (“peak”) (cf. Fig. 5).
The signal amplitude and wave number values (close to the nominal values) extracted in this way were used in the further retrieval procedure. The relative amplitudeAvalues, available in units [V/V] in the data files, were converted into units [dB] and used to determine the measured differential transmission for any targeted absorption line,1Ttgt,Meas, in the form
1Ttgt,Meas= [AAbs,Rx−AAbs,Tx] − [ARef,Rx−ARef,Tx]. (1) The corresponding simulated differential transmissions, 1Ttgt,Sim, computed at the wave numbers determined above (doing so at the nominal wave numbers would not apprecia-bly change the results), were prepared to match these mea-sured transmissions. This was done by employing the RFM model (Dudhia, 2008) within an iterative process to finally determine the desired volume mixing ratios of the target GHGs. The algorithm works as follows.
the ray path for 4 s spectra individually since the variations in pressure (p) and temperature (T) are very small over the short time frame of a data file, such that the initial ray path does not change appreciably (for more information on the estimated uncertainty inpandT themselves see Sects. 2.2, and 4.4). The ECMWF values of p,T, and H2O (derived from the humidity) obtained along the ray path were then stored for later usage in the iterative GHG retrieval, which was done for all 4 s spectra of a file.
The iterative retrieval needs reasonable initial values for the targeted GHGs as well as for some background GHGs that may have a small influence on the selected absorption and reference channels. We chose the along-ray-averaged H2O value from ECMWF as the initial/background value
for H2O, and the CO2, CH4, N2O, and CO values from
FASCODE (FASCODE, 2008), as quoted in Sect. 2, as initial/background values for these well-mixed GHGs. The foreign-species influence of CO is only relevant to CH4and and very small (transmission affected within 0.01 dB), so the somewhat less well mixed character of this species is not relevant here and we can as well use the fixed FASCODE value for its initialization. All target GHGs, determined as ray-path-averaged volume mixing ratiosVtgt, are utilized in units of parts per million by volume (ppmv).
The iteration process uses the atmospheric parameters and initial/background GHG values and – for any chosen GHG absorption line (Table 4) in a data file – includes at each it-eration stepi the simulation of along-ray transmissions for absorption and reference channel,TAbs,Sim;iandTRef,Sim;i, as well as of the ray-averaged absorption cross section,σ¯tgt,
em-ploying the RFM model (Dudhia, 2008). The iteration itself is a simple and robust Newton iteration over target GHG vol-ume mixing ratio,Vtgt;i, starting with an initial valueVtgt;0 and being iteratively updated proportional to a residual dif-ferential transmission increment1[1Ttgt;i]. In particular, the algorithm is formulated as
Vtgt;i+1=Vtgt;i− cdB2 %·R·T·1[1Ttgt;i] p· ¯σtgt T ,¯ p,¯ Vtgt;i
·LTxRx
, (2)
where
1[1Ttgt;i] =1Ttgt,Sim;i−1Ttgt,Meas, (3) with
1Ttgt,Sim;i=TAbs,Sim;i T , p,Vtgt;i (4)
−TRef,Sim;i T , p,Vtgt;i
−1TSC,tgt.
In this set of equations, 1TSC,tgt (in dB) is the spec-tral correction term that accounts for the specspec-tral broaden-ing explained in Sect. 3.1.2. It enables the simulated target GHG differential transmission 1Ttgt,Sim;i (in dB) to nomi-nally match the measured differential transmission1Ttgt,Meas (in dB), in order to produce an adequate residual increment
11Ttgt;i (in dB).
T (in K) and p (in Pa) are the ray-averaged temperature and pressure, respectively, cdB2 %=
23.026 % dB−1is the conversion factor from units dB to units %,R=8.3145 J K−1mol−1 is the molar gas constant,σtgt (in m2mol−1) is the target GHG molar cross section at the
absorption line center, andLTxRx(in m) is the ray path length
from Tx to Rx.
We found that this iterative algorithm converges fast within a few iterations (seven at most); we terminated it when the residual relative change in the volume mixing ratio, 100·|Vtgt;i+1−Vtgt;i|
Vtgt;i , was smaller than 0.05 % or when 10 it-eration steps did not lead to convergence (the latter occurred only in rare cases of problematic spectra, however, for which the results generally ended as outliers). The final iteration re-sults forVtgtwere stored as the retrieved GHG values. They are discussed in terms of their uncertainty and their consis-tency with the independent validation data in the next sec-tions.
4 Retrieval uncertainty analysis
We now discuss the uncertainties estimated for the retrieval results, the GHG volume mixing ratiosV, and their different origins. There are several influences which are of a mixed systematic and random nature. Table 6 lists all of them for the 10 selected absorption species peaks. The estimated un-certainties1Vinclude uncertainties due to the limited accu-racy of the spectral correction term1TSCand of the spectro-scopic parameters as well as due to the limited knowledge of atmospheric water vapor (H2O) concentration and of pres-sure and temperature (Table 6). The underlying sources of these four types of uncertainty are essentially independent, so the resulting combined uncertainty can be computed as a root-mean-square sum of the four uncertainties.
The combined uncertainties (rightmost column of Table 6) for the CO2isotopes amount to about 11–14 % and are
domi-nated by the spectroscopic uncertainties. For comparison, the initial example CO2 retrieval performed by Betal2012 led
to an uncertainty estimate of about 4 %, but this value in-cluded neither the spectroscopic uncertainty (even if it was discussed in the text) nor the spectral-correction-term uncer-tainty (as they did a spectral-fit retrieval rather than a differ-ential transmission retrieval from absorption–reference chan-nel pairs). If we excluded these two uncertainty sources, the current uncertainty estimate from our differential transmis-sion retrieval process would still be somewhat more conser-vative (about 6 %), since we found somewhat higher values for the uncertainties due to H2O concentration, p, and T from our more detailed analysis.
The combined H2O uncertainty is about 51 %, strongly
governed by the uncertain H2O knowledge from the
val-idation data. Finally, the combined CH4-1 uncertainty is
Table 6.Estimated uncertainties1Vin retrieved GHG volume mixing ratiosV, for the 10 selected species absorption lines. The estimates
include uncertainties inVdue to spectral-correction-term uncertainty, spectroscopic uncertainty, water vapor uncertainty, and pressure and
temperature uncertainty. The resulting combined uncertainty is shown as well.
Species peak ID 1TSCuncert. Spectr. uncert. H2O uncert. p, T uncert. Combined uncert.
±1V[%] ±1V[%] ±1V[%] ±1V[%] ±1V[%]
12CO
2-1 4.6 10 2.3 6.0 12.7
12CO2-2 4.4 10 0.5 6.0 12.5
13CO
2-1 4.5 10 1.5 0.5 11.1
C18OO-1 8.2 10 6.0 1.0 14.3
C18OO-2 7.6 10 4.0 1.0 13.2
C18OO-3 6.5 10 0.5 1.0 12.0
H2O-1 4 8 50 3.5 50.9
H2O-2 2 8 50 3.5 50.8
CH4-1 8.4 20 4.3 1.0 22.1
CH4-2 8.3 5 0.3 1.0 9.7
the combined CH4-2 uncertainty is about 10 %, dominated
by the uncertainty in the spectral correction term.
The individual uncertainty contributions are briefly ex-plained separately in the following subsections, followed by a discussion of the complementary estimation of the statis-tical uncertainty from the measurements. The latter was es-timated, within averaging periods of about 10 min, based on the ensemble of retrieved GHG values (from the individual 4 s spectra) falling into each such period.
4.1 Uncertainty due to the spectral correction term
The uncertainty1Vin the spectral correction term takes into account the uncertainty transferred into the volume mixing ratio from the uncertainty (spread) of the 1TSC values ob-tained when best matching individual 4 s spectra within an IR-laser link data file to the corresponding filtered–simulated spectrum of the file. Details of the 1TSC estimation have been described in Sect. 3.1.2 above, and the best-estimate values and their corresponding uncertainties1(1TSC)have been listed in Table 5 and its caption. These uncertainties 1(1TSC)are the basis for estimating the corresponding un-certainties1Vfor all targeted absorption lines, shown in Ta-ble 6.
The relation between 1V and1(1TSC) is essentially a linear one as visible from the right-hand-side term of Eq. (2) above, where one subterm within1(1Ttgt)is1(1TSC). We used this right-hand-side term of Eq. (2) to estimate the lin-ear transfer function from 1(1TSC)to1V for all species’ absorption peaks. Figure 6 shows example results for CO2 isotope lines, where the linear solid lines indicate the relation that somewhat varies due to the different underlying atmo-spheric conditions and absorption cross sections of different spectra (spread of lines with same color). Cross-check with real GHG retrieval results based on Eqs. (2)–(4), using inten-tional relative changes1(1TSC)of +20,+30, and+40 %
0.00 0.05 0.10 0.15 0.20 0.25 ∆(∆TSC) [ dB]
0 2 4 6 8 10 12 14 16
∆
(V
o
lu
m
e
M
ix
in
g
R
a
ti
o
)
[%
]
C18OO-1
C18OO-2
C18OO-3
+ 20 %∆TSC
+ 30 %∆TSC
+ 40 %∆TSC
0.000 0.05 0.10 0.15 0.20 0.25 2
4 6 8 10 12 14 16
∆
(V
o
lu
m
e
M
ix
in
g
R
a
ti
o
)
[%
]
12CO
2-1
12CO
2-2
+ 20 %∆TSC
+ 30 %∆TSC
+ 40 %∆TSC
Figure 6.Examples for the linear dependence of volume mixing ratio uncertainty1(V)(%) on spectral correction term uncertainty
1(1TSC)(dB), for the12CO2-1|2 peaks (upper panel; blue and
red) and the C18OO-1|2|3 peaks (lower panel; blue, red, cyan). The
linear transfer functions (bundles of colored solid lines per species peak) and the cross-check results for the1(V)[1(1TSC)] relation
against the best-estimate1TSC, quite well confirmed the lin-ear relation and the spread (color-filled circles in Fig. 6).
Therefore, we used these linear transfer functions to con-servatively estimate1Vfrom1(1TSC), in the sense that we used, for any absorption peak of Table 6, the highest appli-cable1(1TSC)value from the caption of Table 5 (vertical dotted lines in Fig. 6) and then estimated the corresponding 1V value to be the one associated with the steepest linear transfer function among the bundle of functions evaluated for a given peak (horizontal dotted lines in Fig. 6, indicating the resulting1Von theyaxis).
The spectral-correction-term uncertainties summarized in Table 6 (second column) were all estimated in this way, and their typical range is from about 4 to 8 %. Clearly, a follow-on experiment should aim at avoiding this uncertainty com-ponent by optimized control and documentation of experi-ment settings and an improved signal-to-noise ratio at the re-ceiver.
4.2 Uncertainty due to spectroscopic parameters The uncertainty in the spectroscopic parameters is estimated on the basis of the uncertainties given by the HITRAN08 database (Rothman et al., 2009). The most relevant contribut-ing uncertainties have been shown in Table 4 and include the uncertainty in the line intensity,1S, and in the air-broadened half width, 1γair. Their contribution to the computation of
simulated absorption lines can be seen from the detailed equations in Appendix A2 of Rothman et al. (1998), which shows that these two uncertainties dominate (see also the re-sults of Harrison et al., 2011). We therefore use these two uncertainties1Sand1γairas the basis for the spectroscopic
uncertainty, which will also contribute to the combined vol-ume mixing ratio uncertainty1V.
Based on the results of and experience from the sensitivity studies in Harrison et al. (2011), we assume a roughly lin-ear relation between the spectroscopic uncertainty and1V, reflecting also that the uncertainties in line intensity and air-broadened half width generally do not add linearly but do partially compensate each other in1V. On the basis of these assumptions, we adopted as spectroscopic uncertainty esti-mates in Table 6 (third column) a reasonable trade-off value of the upper and lower margin uncertainty estimates from HITRAN08 according to Table 4.
In particular, for the CO2isotopes we adopted an uncer-tainty of 10 % (the1S lower and1γairupper margin), and
for H2O 8 % (near the 1S upper margin, given that 1γair is quoted to be accurate to within 1–2 % for these lines in HITRAN08). For CH4-1 we adopted an uncertainty of 20 % (dominated by the respective1γairuncertainty quoted in HI-TRAN08 to be at least 20 %) and for CH4-2 5 % (upper mar-gin of1Sand1γairfor this line).
It is clear that these uncertainty estimates are educated guesses only rather than detailed quantitative estimates. However, given the coarseness of the uncertainty
specifica-tions in HITRAN and the unknown sign of the errors in the spectroscopic parameters as well as the first-time nature of the IR-laser link experiment evaluated in this study, we do not consider it worthwhile to explore this uncertainty in a more refined manner for the current purpose. Rather we strongly recommend, underscoring the conclusions of Harri-son et al. (2011), that the current spectroscopic knowledge on the selected lines for the “ACCURATE – climate bench-mark profiling of greenhouse gases and thermodynamic vari-ables and wind from space”/LMIO mission concept should be substantially improved by new highly accurate laboratory spectroscopy in order to meet the ACCURATE spectroscopic accuracy requirements (Kirchengast and Schweitzer, 2011; Harrison et al., 2011). As discussed by Harrison et al. (2011), this could reduce spectroscopic uncertainty in a follow-on experiment to smaller than 0.2 %.
4.3 Uncertainty due to water vapor
In Sect. 2.2 and Fig. 2 we showed that the water vapor vol-ume mixing ratio in the CRDS validation data exhibited a comparatively small variation of ∼0.1 % during the mea-surement times at the Rx site, while it varied from about 0.2 to 0.8 % at the Tx site. Furthermore, the along-ray water va-por from ECMWF showed volume-mixing-ratio variations within about 0.1–0.5 % (Fig. 3), which is comparable with the CRDS ranges. In order to account for these considerable variations, we adopted a large uncertainty of±50 % regard-ing the knowledge of H2O along the IR-laser link (reflecting
a “2σ range” from<0.1 to 0.6 % when assuming a central value of 0.3 %, roughly covering the variability).
Table 6 (fourth column) shows that this limited knowl-edge available on H2O from the campaign (uncertainty 50 %) strongly governs the combined uncertainty conservatively at-tributed to the H2O volume mixing ratio. The validation for this highly variable species will therefore only allow for very broadly checking of the consistency of the retrieved data with the validation data.
On the other hand, despite the need to assume such a high uncertainty on the H2O volume mixing ratio, the absorption
lines of the CO2 isotopes and of CH4are found to be very
weakly sensitive to this uncertainty, since the H2O
foreign-species influence on these absorption lines is very small (see Table 6 fourth column). Moreover, the effect of H2O on the
IR refractivity is smaller than 0.1 % (e.g., Schweitzer et al., 2011a), so the ray path knowledge is essentially not influ-enced by the H2O uncertainty either.
Retrieval computations for sensitivity testing that assume an H2O uncertainty of±50 % confirm that the uncertainties 1V induced in retrieved CO2 isotopes and CH4 are gener-ally in the range of about 0.5–4 % only, much smaller than the spectral-correction-term and spectroscopic uncertainties. The estimates in Table 6 (fourth column) for the CO2 and
CH4 lines are from such computations. The least-sensitive
The latter line well illustrates that the major source of this un-certainty is the residual differential foreign-species influence of H2O on the absorption and reference channels (compare the H2O spectrum in Fig. 4, upper panel, near the C18OO-2
peak).
Related to a follow-on experiment we can learn from these uncertainty estimates that an effort to provide H2O
valida-tion data to within an accuracy of 5 % (representative along the IR-laser link, e.g., from a co-aligned microwave link with suitable frequencies near 23 GHz, as part of the LMIO method; Schweitzer et al., 2011a) would enable this uncer-tainty component to be constrained to less than 0.2 and 0.5 % in CO2 and CH4 retrievals, respectively. This reduction of
uncertainty in CO2and CH4by an order of magnitude (from
order 1 % to order 0.1 %) would arise from the reduction of the H2O uncertainty from 50 to 5 %.
4.4 Uncertainty due to pressure and temperature Since atmospheric pressure and temperature play a role in the ray path simulation and the iteration process to calculate V (Eqs. 2–4), the contribution of their measurement uncer-tainty, estimated to be 1 % (see Sect. 2.2, Fig. 2), to the re-trieval uncertainty1Vmust also be investigated.
Regarding their influence on the ray path trajectory, we found that the effects of the 1 % uncertainty inpandT are essentially negligible; the induced deviation of ray paths at the tangent point altitude (midway along the ray from Tx to Rx) is smaller than 2 m. To estimate their influence on V within the iterative retrieval process (Eqs. 2–4), we per-formed sensitivity testing by retrievals with all combinations of±1 %perror and±1 %T error. Taking for each species peak the highest (most conservative) uncertainties from these results yielded the estimates1Vsummarized in Table 6 (fifth column).
It can be seen that13CO
2, C18OO, and CH4are only
lin-early sensitive and therefore exhibit a p/T-induced uncer-tainty1V of no more than 1 %, while the12CO2and H2O
lines react more sensitively with 6 and 3.5 %, respectively. These differentp/T sensitivities of different lines are mainly related to the quantum-mechanical state transitions of the lines (Schweitzer, 2010; Kirchengast and Schweitzer, 2011). For a follow-on experiment it will be desirable to constrain thepandT knowledge along the ray to∼1 hPa and∼0.3 K (e.g., by complementing the Tx, Rx,p, andT measurements by several high-accuracy radiosonde launches beneath the ray path or balloon measurements near the ray path). This would reduce this uncertainty component to less than 0.2– 0.5 % in the GHG retrievals.
4.5 Statistical uncertainty in the measurements
We now discuss statistical uncertainties estimated from the retrieved GHG data, including outlier rejection as a qual-ity control process, in order to get a complementary view
of the consistency of our results, i.e., complementary to the component-wise uncertainty estimation discussed above that aims at providing an “outer envelope” to all systematic and random uncertainties. The statistical uncertainties estimated here for the various species aim at finding out, under the assumption of random errors that can be reduced by aver-aging over individual retrieval results, how well the median and percentile estimates obtained can represent the valida-tion data. In particular, we used averaging periods of about 10 min and determined medians and percentiles based on the ensemble of retrieved GHG values from the individual 4 s spectra falling into any such period.
More precisely, the first step of our statistical analysis is a quality control and outlier rejection; i.e., we aim to iso-late those individually retrieved GHG values from the en-semble in any averaging period that derive from 4 s spec-tra of bad quality. To this end, we performed a first lation of the median (representing the “mean”), and a calcu-lation of the 16th and 84th percentiles (representing a 68 % “±1σ” range), from all individual retrievals of an IR-laser link data file over a period of at least 10 min if possible (max-imum 15 min; less if the data file or the rest of data file is shorter than 10 min). Based on this output, all individual re-trievals outside of the “2.5·(±1σ )” range were rejected. Sub-sequently, as second step, we recalculated the median and the 16th and 84th percentiles from the remaining subset of indi-vidual retrievals, providing the final estimates of the mean and the±1σ range for the given∼10 min period.
Figure 7 illustrates this method for a couple of example
∼10 min periods for several 12CO2, H2O, and CH4 lines;
the characteristics of all other retrieval ensembles look simi-lar. The retrieval results are shown as a function of the under-lying measured differential transmission values (Eq. 1) that flow into the retrieval algorithm (Eqs. 2–4). Given the near linearity of the algorithm, the resulting individual retrievals exhibit a near-linear dependence on the size of the measured 1T values.
All panels of Fig. 7 confirm that the retrieval ensembles in each∼10 min period clearly cluster around a certain aver-age and are associated with a certain spread (±1σrange) that arises from measurement errors in the individual 4 s spectra and influences of other uncertainties discussed above. As-suming the deviations from the average to be random, the measurement uncertainty of the ∼10 min averages is esti-mated by the “±σ/√n” range. The degree of consistency of this comparatively narrow uncertainty with the validation data is of particular interest as a pointer to potential biases in the data (e.g., from spectroscopic parameter uncertainties or technical measurement biases; Betal2012).
The12CO
2data clustering and average indicate a nearly
uncer-tainty estimates above, which is meaningful as this spread does not reflect systematic uncertainties and validation-data uncertainties (in case of H2O).
The clustering and the average of the CH4ensemble (bot-tom panel) indicate that these measurement data had bias problems since both clusters (red and blue) appear to be lo-cated systematically below the “true” CRDS reference value (green line). This is consistent with the CH4 measurement
problems pointed out by Betal2012. While Betal2012 re-frained for this reason from any CH4retrieval attempts, this
result here still indicates that the CH4spectra from the
long-path measurements were also basically physically sound, al-beit not of sufficient quality for quantitative consistency with accurate validation data.
The results from all ∼10 min periods, based on all data files and inspecting all species analyzed, are discussed in the next section, where only the combined uncertainties and the measurement uncertainty of the∼10 min averages are visu-alized together with the reference data in order to enable a synthesis view.
5 Retrieval results and validation
The results from the analysis of the entire measured data set from all available data files, as summarized in Table 2, turn out to provide a successful first proof of concept of long-path IR-laser occultation measurements using the differential transmission principle as applied in the ACCURATE/LMIO mission concept. Figures 8 and 9 show the complete set of results from the two successful campaign nights 20–21 July and 21–22 July 2011. Reliable results have been obtained for all three targeted CO2isotopes (12CO
2,13CO2, C18OO),
H2O, and CH4.
The retrieval results for the three CO2 isotopes (upper three panels of Fig. 8, one per isotope) exhibit reliable re-peatability of the retrieval results, for all species absorption lines exploited (Table 4). The average (median) values of the
∼10 min periods are generally found to lie within 2 % of
the CRDS reference data, which themselves are consistent with narrow uncertainty of <1 % with the sampling flask cross-check measurements. We note that the isotopic abun-dance factors for calculating the isotope concentrations from the total CO2concentration were taken from the HITRAN08
database, both for the retrieval results and the CRDS and flask reference data shown (for more information on up-to-date mole fractions and isotopic abundance factors for CO2 isotopes see Coplen et al., 2002 and Chen et al., 2010; the differences to the HITRAN08 values are negligible for the purposes of this study).
The combined uncertainties (red error bars) are shown ac-cording to Table 6 and indicate that, within the uncertainty, all CO2retrieval results are consistent with the CRDS
refer-ence data (green-filled circles). The statistical uncertainty of the averages (black error bars) is significantly smaller than
1.0 1.5 2.0 2.5 3.0 3.5 4.0 4.5 ∆(Transm ission) [ dB] 0.05 0.10 0.15 0.20 0.25 H2 O V o lu m e M ix in g R a ti o [ % ]
F6 H2O-1, n= 89(92) F11 H2O-1, n= 36(38)
1.4 1.5 1.6 1.7 1.8 1.9 2.0 2.1 2.2 ∆(Transm ission) [ dB] 320 340 360 380 400 420 440 1 2C O2 V o lu m e M ix in g R a ti o [ p p m v
] F212CO2-2, n= 22(22) F1312CO2-2, n= 44(48)
2.0 3.0 4.0 5.0 6.0 7.0 8.0 9.0 ∆(Transm ission) [ dB] 1.0 1.5 2.0 2.5 3.0 C H4 V o lu m e M ix in g R a ti o [ p p m v
] F18 CH4-1, n= 26(28) F19 CH4-2, n= 42(47)
Figure 7.Examples of retrieved ensembles of volume mixing ratios
within∼10 min periods for absorption lines of12CO2(top panel,
data from files F2 and F13), H2O (middle panel, data from files F6
and F11), and CH4(bottom panel, data from files F18 and F19) as a function of the measured1T (Eq. 1). Individual retrievals are
shown (color-filled circles, one red and one blue example ensemble per panel) together with markers (horizontal lines and shaded areas) of the Tx/Rx-averaged CRDS reference value (green line, except for H2O), the CRDS reference data uncertainty range (gray-shaded
area, almost covering the H2O panel and almost invisibly small for12CO2and CH4), the median value of the retrievals (red/blue solid lines, partially overlapping), the±1σ range of the retrievals (red/blue dotted lines about median, partially overlapping), and the