ACPD
13, 17253–17297, 2013High levels of ultraviolet radiation
G. Bernhard et al.
Title Page
Abstract Introduction
Conclusions References
Tables Figures
◭ ◮
◭ ◮
Back Close
Full Screen / Esc
Printer-friendly Version
Interactive Discussion
Discussion
P
a
per
|
D
iscussion
P
a
per
|
Discussion
P
a
per
|
Discuss
ion
P
a
per
|
Atmos. Chem. Phys. Discuss., 13, 17253–17297, 2013 www.atmos-chem-phys-discuss.net/13/17253/2013/ doi:10.5194/acpd-13-17253-2013
© Author(s) 2013. CC Attribution 3.0 License.
Atmospheric Chemistry and Physics
Open Access
Discussions
Geoscientiic Geoscientiic
Geoscientiic Geoscientiic
This discussion paper is/has been under review for the journal Atmospheric Chemistry and Physics (ACP). Please refer to the corresponding final paper in ACP if available.
High levels of ultraviolet radiation
observed by ground-based instruments
below the 2011 Arctic ozone hole
G. Bernhard1, A. Dahlback2, V. Fioletov3, A. Heikkilä4, B. Johnsen5, T. Koskela4, K. Lakkala6, and T. M. Svendby7
1
Biospherical Instruments, San Diego, California, USA
2
Department of Physics, University of Oslo, Norway
3
Environment Canada, Toronto, Ontario, Canada
4
Finnish Meteorological Institute, Helsinki, Finland
5
Norwegian Radiation Protection Authority, Østerås, Norway
6
Finnish Meteorological Institute, Arctic Research Centre, Sodankylä, Finland
7
Norwegian Institute for Air Research, Kjeller, Norway
Received: 23 May 2013 – Accepted: 10 June 2013 – Published: 28 June 2013
Correspondence to: G. Bernhard ([email protected])
ACPD
13, 17253–17297, 2013High levels of ultraviolet radiation
G. Bernhard et al.
Title Page
Abstract Introduction
Conclusions References
Tables Figures
◭ ◮
◭ ◮
Back Close
Full Screen / Esc
Printer-friendly Version
Interactive Discussion
Discussion
P
a
per
|
D
iscussion
P
a
per
|
Discussion
P
a
per
|
Discuss
ion
P
a
per
|
Abstract
Greatly increased levels of ultraviolet (UV) radiation were observed at thirteen Arctic and sub-Arctic ground stations in the spring of 2011 when the ozone abundance in the Arctic stratosphere dropped to the lowest amounts on record. Measurements of the noontime UV Index (UVI) during the low-ozone episode exceeded the climatological 5
mean by up to 77 % at locations in the western Arctic (Alaska, Canada, Greenland) and by up to 161 % in Scandinavia. The UVI measured at the end of March at the Scandinavian sites was comparable to that typically observed 15–60 days later in the year when solar elevations are much higher. The cumulative UV dose measured during the period of the ozone anomaly exceeded the climatological mean by more than two 10
standard deviations at 11 sites. Enhancements beyond three standard deviations were observed at seven sites and increases beyond four standard deviations at two sites. At the western sites, the episode occurred in March when the Sun was still low in the sky, limiting absolute UVI anomalies to less than 0.5 UVI units. At the Scandinavian sites, absolute UVI anomalies ranged between 1.0 and 2.2 UVI units. For example, at Finse, 15
Norway, the noontime UVI on 30 March was 4.7 while the climatological UVI is 2.5. Although a UVI of 4.7 is still considered moderate, UV levels of this amount can lead to sunburn and photokeratitis during outdoor activity when radiation is reflected upward by snow towards the face of a person or animal. At the western sites, UV anomalies can be well explained with ozone anomalies of up to 41 % below the climatological mean. 20
At the Scandinavian sites, low ozone can only explain a UVI increase by 50–60 %. The remaining enhancement was mainly caused by the absence of clouds during the low-ozone period.
1 Introduction
Ozone amounts in the Arctic stratosphere during spring of 2011 were the lowest since 25
av-ACPD
13, 17253–17297, 2013High levels of ultraviolet radiation
G. Bernhard et al.
Title Page
Abstract Introduction
Conclusions References
Tables Figures
◭ ◮
◭ ◮
Back Close
Full Screen / Esc
Printer-friendly Version
Interactive Discussion
Discussion
P
a
per
|
D
iscussion
P
a
per
|
Discussion
P
a
per
|
Discuss
ion
P
a
per
|
eraged over the equivalent latitude band 63–90◦N was 297 Dobson Units (DU), which
is 18 DU below the previous record-low observed in 2000, and 100 DU (25 %) below the average for 1979–1988 (Bernhard et al., 2012). While the monthly mean total ozone column observed in the Arctic was also abnormally low in March 1997 (Fioletov et al., 1997; Newman et al., 1997; Weber et al., 2012), the total ozone loss was much greater 5
in 2011 than in 1997 (Manney et al., 2011). At some locations and times, total ozone amounts observed between February and April 2011 were more than 50 % below the climatological mean (Balis et al., 2011). The fraction of the Arctic vortex with total ozone below 275 DU is typically near zero for March, but reached nearly 45 % in March 2011 (Manney et al., 2011). Minimum total ozone in spring 2011 was continuously below 10
250 DU for about 27 days, and values between 220 and 230 DU were reached for about one week in late March 2011. The winter/spring ozone mass deficit in 2011 reached an extreme value of 2700 Mt (Balis et al., 2011).
The record ozone loss in 2011 was the result of an unusually prolonged cold period in the lower stratosphere and an anomalously strong Arctic vortex, which may have 15
partly been caused by positive sea surface temperature anomalies in the North Pacific (Hurwitz et al., 2011). The low temperatures and the strong polar vortex weakened transport of ozone from middle latitudes (Isaksen et al., 2012) and facilitated the for-mation of polar stratospheric clouds (PSC), which provide surfaces for heterogeneous reactions that activate stratospheric chlorine. Temperatures below the threshold tem-20
perature for PSC formation of about−77◦C existed between December 2010 and early April 2011. The PSC volume in 2011 was the largest on record and, in early January, the detected PSCs reached altitudes above 30 km where they have not been previously observed in the Arctic stratosphere (Arnone et al., 2012). Under these conditions, over 80 % of the ozone present in January from about 18 to 20 km altitude had been chemi-25
ACPD
13, 17253–17297, 2013High levels of ultraviolet radiation
G. Bernhard et al.
Title Page
Abstract Introduction
Conclusions References
Tables Figures
◭ ◮
◭ ◮
Back Close
Full Screen / Esc
Printer-friendly Version
Interactive Discussion
Discussion
P
a
per
|
D
iscussion
P
a
per
|
Discussion
P
a
per
|
Discuss
ion
P
a
per
|
chemistry and transport anomalies for 2011 stand out as extreme, greater than two-sigma events, while the total anomaly is nearly three-two-sigma (Isaksen et al., 2012).
The amount of ozone loss and the chemistry of the Arctic stratosphere in the spring of 2011 was remarkably similar to that commonly observed in Antarctica, justifying the conclusion that there was an Arctic ozone hole in 2011 (Garcia, 2011).
5
Based on the anti-correlation between total ozone and surface UV radiation (e.g., ACIA, 2005), it can be expected that ultraviolet (UV) radiation in the Arctic was ab-normally large in the spring of 2011. It is the objective of this paper to quantify these anomalies using measurements of thirteen ground-based instruments (scanning spec-troradiometers and multifilter instruments) located throughout the Arctic and Scandi-10
navia. The analysis is based on the UV Index (UVI), which is a measure of the ability of UV radiation to cause erythema (sunburn) in human skin (WHO, 2002). The UVI is a di-mensionless number and calculated by weighting the spectral UV irradiance from Sun and sky that is received on a horizontal surface with the action spectrum for erythema (McKinlay and Diffey, 1987), integrating the weighted spectrum over the wavelength
15
range 290–400 nm, and multiplying the result by 40 m2W−1. Because filter radiometers have a better time resolution than spectroradiometers (e.g., 1 measurement per minute versus 1–4 scans per hour), the study also addresses the effect of sampling rates on
derived UVI anomalies.
In addition to the ozone column, UV radiation at the ground depends on many fac-20
tors such as the solar zenith angle (SZA), surface albedo, and amount and type of clouds (ACIA, 2005). These factors also affect the change in UVI for a given change in
ozone (Micheletti et al., 2003). The UV response during noon hours may therefore be different from that earlier or later in the day. Our analysis recognizes this dependency
by assessing several data products, namely anomalies in the noontime UVI averaged 25
ACPD
13, 17253–17297, 2013High levels of ultraviolet radiation
G. Bernhard et al.
Title Page
Abstract Introduction
Conclusions References
Tables Figures
◭ ◮
◭ ◮
Back Close
Full Screen / Esc
Printer-friendly Version
Interactive Discussion
Discussion
P
a
per
|
D
iscussion
P
a
per
|
Discussion
P
a
per
|
Discuss
ion
P
a
per
|
Compared to estimates of the surface UVI from satellite observations (e.g., Krotkov et al., 1998, 2001), ground-based measurements have the advantage of better tempo-ral resolution and are more accurate under cloudy conditions, in particular at high lati-tudes where the surface is frequently covered by snow. At these sites, satellite-based estimates can be too low by up to 50 % when high albedo from snow and ice cover 5
– which can increase the UVI by up to 55 % (Bernhard et al., 2007) – is misinterpreted as clouds (Tanskanen et al., 2007).
Because the Sun is low in the sky at high latitudes, Arctic UVIs are considerably smaller compared to lower latitudes, which may lead to the notion that UV radiation in the Arctic is not important. This impression is not accurate for two reasons: (i) the 10
day length in the Arctic can be as long as 24 h. UV doses received over 24 h periods, which are relevant for organisms that cannot escape the Sun, are comparable to those observed at lower latitudes (Bernhard et al., 2010). (ii) UV reflections from snow cov-ered surfaces can lead to considerable UV exposure to a person’s face (Cockell et al., 2001) or the eyes of an animal. In the years since ozone depletion was first observed 15
over the Arctic, UV radiation effects such as sunburn have been reported in regions
where they were not previously observed (Fox, 2000). Large increases in surface UV radiation at Arctic locations caused by low ozone amounts have been reported in the past (Kerr and McElroy, 1993; Jokela et al., 1993; Taalas et al., 1996; Gurney, 1998; Kaurola et al., 2000; Lakkala et al., 2003). Changes in Arctic UV radiation are therefore 20
a reason for concern for human health (De Fabo, 2005) and nature (Crutzen, 1992).
2 Locations
Ground-based data from thirteen Arctic and Scandinavian locations (Fig. 1) were used in this analysis. Sorted by decreasing latitude, the thirteen sites are Alert, Eureka, Ny-Ålesund, Resolute, Barrow, Summit, Andøya, Sodankylä, Trondheim, Finse, Jokioinen, 25
ACPD
13, 17253–17297, 2013High levels of ultraviolet radiation
G. Bernhard et al.
Title Page
Abstract Introduction
Conclusions References
Tables Figures
◭ ◮
◭ ◮
Back Close
Full Screen / Esc
Printer-friendly Version
Interactive Discussion
Discussion
P
a
per
|
D
iscussion
P
a
per
|
Discussion
P
a
per
|
Discuss
ion
P
a
per
|
instrumentation is provided in Table 1. Climatic conditions are briefly discussed below with additional information available from the literature cited.
Alert is located on Ellesmere Island, Nunavut, close to the northern-most point of Canada, and about 800 km from the North Pole. The surface is snow-covered for 10 months of the year. Eureka is also located on Ellesmere Island, about 480 km south-5
west of Alert, and has the lowest average annual temperature and least precipitation of any weather station in Canada with mean temperatures between−38◦C in Febru-ary and+5◦C in July (http://climate.weatheroffice.gc.ca/climate_normals/index_1961_
1990_e.html). Resolute is located on Cornwallis Island, Nunavut, about 600 km South of Eureka.
10
Ny-Ålesund is at the west side of the Svalbard archipelago, north of Norway. Despite its high northern latitude, the climate is relatively mild with mean temperatures between −14◦C in February and 5◦C in July because of the influence of the Gulf Stream. Sum-mit is located near the top of the Greenland ice cap with a surface albedo larger than 0.97 yr-round (Bernhard et al., 2008a). Barrow is close to the northern-most point of 15
Alaska, at the coast of the Chukchi Sea, which is typically covered by ice between November and July. Snow cover extends roughly from October to June. The effective
surface albedo is 0.83±0.08 (±1σ) during March and April and below 0.15 in the sum-mer (Bernhard et al., 2007).
Andøya is located on the Norwegian coast north of the Arctic Circle. Winters are fairly 20
mild and snow cover is thin. Sodankylä is located in northern Finland and surrounded by Boreal pine forests and peatlands. Snow cover typically persists from November until the end of May (Lakkala et al., 2003). Trondheim is located close the coast of central Norway and has a predominantly hemiboreal Oceanic climate. The instrument at Finse is located at an alpine site in south-central Norway at 1210 m above sea-level 25
ACPD
13, 17253–17297, 2013High levels of ultraviolet radiation
G. Bernhard et al.
Title Page
Abstract Introduction
Conclusions References
Tables Figures
◭ ◮
◭ ◮
Back Close
Full Screen / Esc
Printer-friendly Version
Interactive Discussion
Discussion
P
a
per
|
D
iscussion
P
a
per
|
Discussion
P
a
per
|
Discuss
ion
P
a
per
|
Snow cover extends from December to March. The Instrument at Østerås is located in a suburb about 9 km north west of the center of Oslo. Blindern is the main campus of the University of Oslo, located about 6 km east of Østerås and 3 km north of Oslo. Measurements of the last two sites present the opportunity to assess variations in UV on a regional scale. Additional information on the Norwegian climate is provided at 5
http://www.yr.no/klima/.
3 Instruments and measurement protocols
Measurements at the three Canadian sites (Alert, Eureka, Resolute) are performed with single-monochromator Brewer spectrophotometers (Kerr et al., 1985), which mea-sure global spectral irradiance between 290 and 325 nm with a bandpass of approx-10
imately 0.55 nm full width at half maximum (FWHM). Because the erythemal action spectrum (McKinlay and Diffey, 1987) is defined for wavelengths up to 400 nm, an
ad-justment is required to correct for the instruments’ limited wavelength range: the UVI is based on actual measurements up to 325 nm plus an additional contribution to account for radiation in the 325–400 nm interval, which is estimated from actual measurements 15
at 324 nm. The extrapolation method has been tested on many occasions and the as-sociated error is typically less than 2 % (Fioletov et al., 2004). The instruments have temperature stabilization and are calibrated once every 1–2 yr with DHX 1000 W tung-sten halogen lamps, which are traceable to the US National Institute of Standards and Technology (NIST). The wavelength calibration is tested several times per day with 20
a mercury discharge lamp. The wavelength uncertainty is±0.05 nm (±2σ). Measure-ments are corrected for spikes (i.e., an anomalous high or low measurement at a single wavelength of a measured spectrum), the dark current, dead time of the instruments’ photomultiplier tube, stray light (Fioletov et al., 2000), changes of responsivity between calibrations as well as angular response (or cosine) errors (Fioletov et al., 2002). The 25
ACPD
13, 17253–17297, 2013High levels of ultraviolet radiation
G. Bernhard et al.
Title Page
Abstract Introduction
Conclusions References
Tables Figures
◭ ◮
◭ ◮
Back Close
Full Screen / Esc
Printer-friendly Version
Interactive Discussion
Discussion
P
a
per
|
D
iscussion
P
a
per
|
Discussion
P
a
per
|
Discuss
ion
P
a
per
|
operating at Alert and Resolute (Table 1). When this was the case, data of both instru-ments were used.
The six Norwegian sites (Ny-Ålesund, Andøya, Trondheim, Finse, Østerås, and Blin-dern) are part of the Norwegian UV monitoring network operated by the Norwegian Radiation Protection Authority (NRPA) and the Norwegian Institute for Air Research 5
(NILU) (Aalerud and Johnsen, 2006). At all sites but Blindern, measurements are per-formed with GUV-541 multi-filter radiometers from Biospherical Instruments Inc (BSI), which measure spectral irradiance at 305, 313, 320, 340, and 380 nm with a band-width of approximately 10 nm. At Blindern, a GUV-511 is installed, which does not have a channel at 313 nm. The instruments return a data set every minute, which is the 10
average of samples taken at a frequency of approximately 1 Hz during the preceding minute. The UVI is calculated via a linear combination of measurements at the five channels. Corrections are applied for the instruments’ cosine error and for systematic errors that depend on SZA (Johnsen et al., 2008, 2009). Instruments are inspected daily.
15
The absolute calibration of the network instruments is traceable to the European travelling reference spectroradiometer QASUME (Quality Assurance of Spectral Ultra-violet Measurements in Europe; Gröbner et al., 2006). Calibrations were established during the international solar intercomparison campaign FARIN (Factors Controlling UV Radiation In Norway), which took place in Oslo in 2005 (Johnsen et al., 2008). All 20
network instruments were co-located during this campaign with the reference spectro-radiometer and also characterized in the laboratory, resulting in a homogenization of their irradiance scales. The maintenance of a stable irradiance scale for the 1995–2011 period is based on annual site visits with the network’s travelling reference GUV instru-ment (TRI). The assessinstru-ment of drift of the TRI itself is based on relative measureinstru-ments 25
ACPD
13, 17253–17297, 2013High levels of ultraviolet radiation
G. Bernhard et al.
Title Page
Abstract Introduction
Conclusions References
Tables Figures
◭ ◮
◭ ◮
Back Close
Full Screen / Esc
Printer-friendly Version
Interactive Discussion
Discussion
P
a
per
|
D
iscussion
P
a
per
|
Discussion
P
a
per
|
Discuss
ion
P
a
per
|
The expanded uncertainty (coverage factork=2) of the GUV’s UVI measurements
is 6 % (Aalerud and Johnsen, 2006). This value takes into account the uncertainty of measurements of the Bentham spectroradiometer, the Bentham-to-GUV transfer un-certainty, and drifts of the GUV sensitivities between calibrations. Blind test intercom-parisons between the TRI and the QASUME spectroradiometer visiting Ny-Ålesund in 5
2009 and Oslo in 2010 showed average agreement in UVI measurements to within ±1 % for the two campaigns (Gröbner et al., 2010 and http://www.pmodwrc.ch/euvc/ euvc.php?topic=qasume_audit). Results of these campaigns confirmed the accuracy
specifications.
Instruments at Barrow and Summit are operated by BSI and have been part of the 10
National Science Foundations (NSF) Spectral Irradiance Monitoring Network until 2009 (Booth et al., 1994). Both instruments are now affiliated with NSF’s Arctic Observing
Network (http://www.arcus.org/search/aon). The instrument at Summit is an SUV-150B spectroradiometer from BSI. It was installed in 2004 and measures spectral global irradiance between 280 and 600 nm with a resolution of 0.63 nm FWHM at a rate of 15
four spectra per hour (Bernhard et al., 2008a). The instrument’s irradiance collector consists of a polytetrafluoroethylene (PTFE) diffuser covering the entrance port of an
integrating sphere, resulting in a cosine error of less than 2 % for incidence angles smaller than 75◦. The instrument took part in the fifth North American Interagency Intercomparison for UV Spectroradiometers in 2003 (Wuttke et al., 2006; Lantz et al., 20
2008). The instrument at Barrow is an SUV-100 spectroradiometer from BSI and was installed in 1991 (Bernhard et al., 2007). The system provides similar measurements as the instrument at Summit but has a larger resolution of 1.0 nm. Its sampling rate is typically four spectra per hour (one spectrum per hour before 1997, two spectra per hour in 2011). The reduced sampling rate in 2011 has little consequences because the 25
area surrounding Barrow was snow covered during the time of the low-ozone event. The high snow albedo reduces UV variability introduced by variations in cloud cover (Bernhard et al., 2007) and, in turn, the effect of the low sampling rate. Instruments are
ACPD
13, 17253–17297, 2013High levels of ultraviolet radiation
G. Bernhard et al.
Title Page
Abstract Introduction
Conclusions References
Tables Figures
◭ ◮
◭ ◮
Back Close
Full Screen / Esc
Printer-friendly Version
Interactive Discussion
Discussion
P
a
per
|
D
iscussion
P
a
per
|
Discussion
P
a
per
|
Discuss
ion
P
a
per
|
are traceable to the source-based spectral irradiance scale realized by NIST in 1990 (Walker et al., 1987; Yoon et al., 2002). Additional information on calibration and quality control is published annually in Network Operations Reports (e.g., Bernhard et al., 2008b). Data from Summit and Barrow used in this study are part of the “Version 2” NSF network data edition (Bernhard et al., 2004), which have been corrected for drifts 5
in responsivity, wavelength alignment errors (by means of Fraunhofer line correlation), and cosine errors. The expanded uncertainty (coverage factork=2) of UVI data varies
between 5.8 and 6.2 %, depending on sky condition (Bernhard et al., 2007, 2008a). Measurements at the two Finnish sites (Sodankylä and Jokioinen) are overseen by the Finnish Meteorological Institute (FMI). The instrument at Sodankylä is a sin-10
gle monochromator Brewer (model MKII) measuring the solar spectrum between 290 and 325 nm, while the Jokioinen uses a double-monochromator Brewer (model MKIII) covering the wavelength range of 286.5–365 nm (Lakkala et al., 2008). Both instru-ments have a spectral bandwidth of 0.6 nm FWHM, are inspected daily, and are cal-ibrated monthly with DXW 1000 W irradiance standards, which are traceable to the 15
scale of irradiance provided by the Aalto University, Finland (AALTO). Measurements are corrected for spikes (Meinander et al., 2003), the dark current and dead time of the instruments’ photomultiplier tube, stray light, the temperature-dependence of the responsivity, changes of responsivity between calibrations, wavelength shifts, and the cosine error of the fore optics (Lakkala et al., 2008). To calculate the UVI, measure-20
ments are extrapolated out to 400 nm with a “Relative Spectrum” method by generat-ing the non-measured spectral irradiances as E(λ)=R(λ)E(λ
ref) where E(λref) is the
actual measured irradiance at the reference wavelengthλref(324 or 361 nm for Brewer
MKII and MKIII, respectively) andR(λ) is the mean ratio E(λ)/E(λref) calculated from a large set of full-range UV spectra under clear sky. The combined measured and 25
ACPD
13, 17253–17297, 2013High levels of ultraviolet radiation
G. Bernhard et al.
Title Page
Abstract Introduction
Conclusions References
Tables Figures
◭ ◮
◭ ◮
Back Close
Full Screen / Esc
Printer-friendly Version
Interactive Discussion
Discussion
P
a
per
|
D
iscussion
P
a
per
|
Discussion
P
a
per
|
Discuss
ion
P
a
per
|
also regularly compared with the QASUME reference spectroradiometer (Bais et al., 2003). Results indicate that measurements from the two Brewer instruments are con-sistently high by 1–6 % compared to measurements of the QASUME instrument. Data of both sites are regularly submitted to the European Database of UV radiation (EU-VDB; http://uv.fmi.fi/uvdb/) where they undergo an automated quality flagging process 5
that includes checking for wavelength scale errors, spikes, and anomalous high or low measurements. The expanded uncertainty, however, has not been quantified.
Total ozone data used in this studies were measured by Total Ozone Mapping Spec-trometers (TOMS) on onboard the Nimbus-7 (1991–1992), Meteor-3 (1993–1994), and Earth Probe (1996–2004) NASA satellites. Ozone data of the years 2005–2012 were 10
measured by the Ozone Monitoring Instrument (OMI) on NASA’s Aura satellite. TOMS data are version 8 and were downloaded from ftp://toms.gsfc.nasa.gov/pub/; OMI data are version 8.5, collection 3 and acquired from http://avdc.gsfc.nasa.gov/index.php? site=1593048672&id=28. TOMS overpass data files include only one measurement
per day. OMI overpass files include ozone data for every orbit. The daily average was 15
calculated from these measurements. For all sites but Summit, Trondheim, and Finse, the climatological mean and range shown in the bottom panel of Fig. 3 was calculated from overpass data of the years 1991–2010. For Summit, Nimbus-7 and Meteor-3 over-pass data are not available and only Earth Probe and OMI data of the years 1996– 2011 were used. Earth Probe overpass data for Trondheim, Finse, and Oslo were in-20
terpolated from gridded TOMS measurements and combined with OMI overpass data, resulting in a times series of 1996–2011.
4 Data processing
From the UVI data discussed in Sect. 3, several data products were calculated, includ-ing (1) the UVI measurement closest to local solar noon; (2) the UVI averaged over 25
ACPD
13, 17253–17297, 2013High levels of ultraviolet radiation
G. Bernhard et al.
Title Page
Abstract Introduction
Conclusions References
Tables Figures
◭ ◮
◭ ◮
Back Close
Full Screen / Esc
Printer-friendly Version
Interactive Discussion
Discussion
P
a
per
|
D
iscussion
P
a
per
|
Discussion
P
a
per
|
Discuss
ion
P
a
per
|
discussed below. Data products (1), (2), and (3) were only calculated for days when there were at least two measurements within the two-hour period around noon and at least 10 measurements per day. This criterion reduces, for example, the risk that the calculated daily maximum is biased low if measurements during the noon hours are missing. The erythemal daily dose was calculated by integrating measurements over 5
24 h periods, centered at local solar noon. Data gaps were filled with spline interpola-tion and days with gaps longer than 7300 s (8500 for Jokioinen; 11 000 s for Resolute) were excluded from further analysis. For every single measurement, the associated SZA was calculated and the minimum SZA was determined from these data for each day. If this data-based minimum SZA exceeded the actual SZA at noon by more than 10
1◦, daily dose data of that day were also not used.
The selection of the low-ozone periods used for data product (5) is based on total ozone measurements. For each site, the period is defined as the range of days when OMI total ozone measurements in 2011 were below the 10th percentile, calculated from TOMS and OMI observations of all available years, excluding 2011. The start of 15
the periods for Alert, Eureka, Ny-Ålesund, and Resolute was based on UV measure-ments because ozone was already depleted before the day when solar elevation be-came large enough for OMI measurements. The low-ozone periods used in this study are indicated in Table 1. Cumulative erythemal doses (CED) for these periods were calculated by adding up the daily doses. Missing days were filled-in by linear interpola-20
tion. If daily dose data were missing for more than two consecutive days or more than 3 days in total, CEDs were not determined. The calculation was repeated for all years to allow a comparison of the CEDs of 2011 with those of prior years.
5 Effect of subsampling
The Norwegian site provide UVI data in one-minute intervals while data of the other 25
ACPD
13, 17253–17297, 2013High levels of ultraviolet radiation
G. Bernhard et al.
Title Page
Abstract Introduction
Conclusions References
Tables Figures
◭ ◮
◭ ◮
Back Close
Full Screen / Esc
Printer-friendly Version
Interactive Discussion
Discussion
P
a
per
|
D
iscussion
P
a
per
|
Discussion
P
a
per
|
Discuss
ion
P
a
per
|
the effect of resolution on the calculation of the noontime average or daily maximum.
For example, high UV levels beyond the clear-sky limit can sometimes be observed when the disk of the Sun is visible and additional radiation is scattered towards the observer by cumulous clouds (Mims and Frederick, 1994). Because of the transient nature of these events, they can more likely be observed by instruments with a high 5
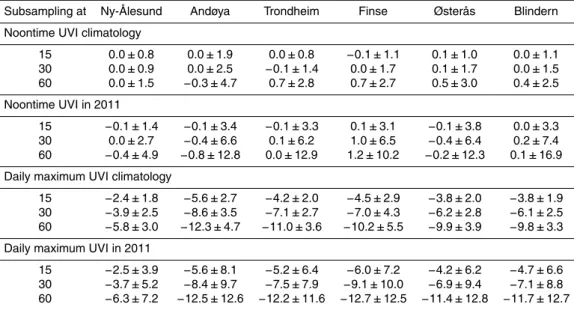
temporal resolution. The daily maximum UVI measured by the Norwegian instruments should therefore be biased high compared to measurements of the other sites. To test this hypothesis, data from the Norwegian sites were subsampled at 15, 30, and 60 min intervals, indexed at the top of the hour; the noontime UVI (data product (2)) and daily maximum UVI (data product (3)) were calculated from these data; and compared with 10
similar data products calculated from the native, 1 min data. The analysis focuses on four data “classes,” namely (a) the climatology of the daily noontime UVI, calculated by averaging data of all years but 2011; (b) the noontime UVI for 2011; (c) the climatology of the daily maximum UVI, calculated again by averaging data of all years but 2011; and (d) the daily maximum UVI for 2011. The average bias and standard deviation 15
were calculated from these data and are provided in Table 2. Figure 2 shows the bias of subsampled data relative to the 1 min data for Ny-Ålesund and Blindern. Figure 2 and Table 2 support the following conclusions:
– As can be expected, data that are subsampled at 15 min intervals have the small-est bias and standard deviation relative to the 1 min data, followed by data sub-20
sampled at 30 and 60 min intervals.
– Standard deviations of the daily biases tend to be lowest at Ny-Ålesund. This is likely attributable to the fact that snow cover and stratiform clouds are prevailing at this site for most of the year. The snow’s high albedo reduces the variability introduced by clouds (Nichol et al., 2003) and, in turn, the effect of subsampling.
25
The smallest difference between subsampled and 1 min data is observed between
ACPD
13, 17253–17297, 2013High levels of ultraviolet radiation
G. Bernhard et al.
Title Page
Abstract Introduction
Conclusions References
Tables Figures
◭ ◮
◭ ◮
Back Close
Full Screen / Esc
Printer-friendly Version
Interactive Discussion
Discussion
P
a
per
|
D
iscussion
P
a
per
|
Discussion
P
a
per
|
Discuss
ion
P
a
per
|
– For the “noontime UVI climatology” data class, the average bias introduced by subsampling is always smaller than 1 % (Table 2): the maximum bias is 0.7 %, ob-served for 60 min subsampling at Trondheim and Finse. This result suggests that the comparatively low sampling rate of scanning spectroradiometers has little ef-fect for establishing a noontime UVI climatology at sites where these instruments 5
are deployed.
– Subsampling has a large influence on measurements of individual days. This is evident, for example, from the large standard deviations of the “noontime UVI in 2011” data class provided in Table 2, and the large scatter in Fig. 2. Despite the large variability, the average bias is small. For example, the average biases of the 10
“noontime UVI for 2011” data class are typically smaller than 1 %; the maximum bias is 1.2 % (subsampling at 60 min interval at Finse).
– Subsampling causes a large bias for daily maxima. For subsampling at 15 min intervals average biases range between−2.4 and−6.0 % and increase to up to −12.7 % for subsampling at 60 min intervals. Comparing daily maximum mea-15
surements of two sites with different sampling protocols can therefore lead to
erroneous conclusions. Of note, average biases calculated from measurements of a single year (i.e., 2011) are only slight larger than those of the “daily maximum UVI” climatology.
– Østerås and Blindern are only 6 km apart. Statistics for the two sites are similar, 20
but not identical, suggesting that cloud patterns at the two sites are somewhat dif-ferent. This observation is further supported by the fact that UVI measurements at Blindern are on average 2.5 % lower than at Østerås, suggesting greater cloudi-ness and less and earlier disappearing snow cover at Blindern.
In summary, subsampling has little influence on the calculation of a noontime UVI cli-25
ACPD
13, 17253–17297, 2013High levels of ultraviolet radiation
G. Bernhard et al.
Title Page
Abstract Introduction
Conclusions References
Tables Figures
◭ ◮
◭ ◮
Back Close
Full Screen / Esc
Printer-friendly Version
Interactive Discussion
Discussion
P
a
per
|
D
iscussion
P
a
per
|
Discussion
P
a
per
|
Discuss
ion
P
a
per
|
6 Results
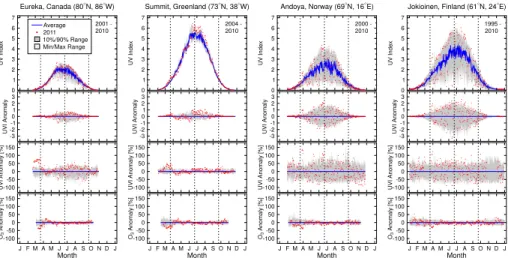
Figure 3 compares measurements of the noontime UVI (data product (2)) in 2011 with the climatological mean at Eureka, Summit, Andøya, and Jokioinen. Similar figures for other sites and data products, including results for all subsampling regimes, are avail-able as supplements. These figures are provided as high-definition PDF files, allowing 5
to compare the different datasets in detail, for example, by flipping back and forth two
different graphs on a computer screen.
Figure 3 and the supplement figures are composed of four panels for each site. The top (first) panel compares noontime UVI measurements performed in 2011 (red dots) with the average (i.e., climatological mean) noontime UVI (blue line), the range between 10
the 10th and 90th percentile (dark shading), and the range of historical minima and maxima (light shading). The climatological mean and the two ranges were calculated from measurements of the years indicated in the top-right corner of the panel. Data from Andøya were subsampled at 15 min intervals, data of the three other sites are based on their native time resolution. The second panel shows the 2011 UVI anomaly 15
in absolute terms, calculated as difference between measurements in 2011 and the
climatological mean. The third panel shows the relative UVI anomaly, calculated as the percentage departure from the climatological mean. The fourth panel shows a similar anomaly analysis for total ozone derived from the TOMS and OMI measurements.
Figure 3 and the associated supplements support the following conclusions: 20
– Total ozone was abnormally low (i.e., below the minimum calculated from data of the years 1991–2010) during most of March at Eureka and Summit, and late March at Andøya and Jokioinen. Maximum anomalies are between −31 % (Bar-row) and−43 % (Resolute). The median anomaly was−36 %.
– Periods of low ozone coincide with periods of elevated UVI. This is particularly 25
ACPD
13, 17253–17297, 2013High levels of ultraviolet radiation
G. Bernhard et al.
Title Page
Abstract Introduction
Conclusions References
Tables Figures
◭ ◮
◭ ◮
Back Close
Full Screen / Esc
Printer-friendly Version
Interactive Discussion
Discussion
P
a
per
|
D
iscussion
P
a
per
|
Discussion
P
a
per
|
Discuss
ion
P
a
per
|
Fig. 3, the low-ozone event was between 25 March and 3 April. During this period, the UVI exceed the climatological mean by up to 135 % at Andøya and 124 % at Jokioinen. Both increases were well beyond the largest UVI anomalies observed historically.
– While the magnitude of relative UVI increases was unprecedented at the four 5
sites, the absolute increases in UV levels were either insignificant (Eureka) or modest (1.0 UVI units at Andøya and 1.9 UVI units at Jokioinen).
– The range of UVI anomalies derived from historical measurements (gray shad-ing in Fig. 3) is much smaller for Summit than Andøya and Jokioinen. The small variability at Summit is due the fact that the influence of clouds at this site is very 10
limited for two reasons (Bernhard et al., 2008): first, low temperatures over the ice cap lead to low atmospheric water content and optically thin clouds. Second, the surface albedo at Summit is about 97 % all year, which greatly reduces the effect
of clouds (Nichol et al., 2003). The average attenuation by clouds at Summit is 3.5 % in spring (1 March and 21 June) and 5.8 % in summer (22 June–12 Octo-15
ber) (Bernhard et al., 2008). Attenuation by clouds by more than 17 % is observed in only 1.2 % of all measurements in spring and 2.9 % in summer. Enhancement by clouds is less than 10 %, with few (<0.5 %) exceptions. A similar analysis has not been performed for Andøya and Jokioinen. The effect of clouds during times
when the surface is snow free is instead discussed with data from Barrow, where 20
snow cover roughly extends until June (Bernhard et al., 2007). Similar to Summit, the effect of clouds is small in spring when the surface albedo is high (e.g., the
av-erage attenuation by clouds during the first two weeks of March is 3±7 % (±1σ)). In contrast, the average attenuation during the last two weeks in August (no snow cover) is 41±22 %, and reductions by more than 80 % are being observed. En-25
ACPD
13, 17253–17297, 2013High levels of ultraviolet radiation
G. Bernhard et al.
Title Page
Abstract Introduction
Conclusions References
Tables Figures
◭ ◮
◭ ◮
Back Close
Full Screen / Esc
Printer-friendly Version
Interactive Discussion
Discussion
P
a
per
|
D
iscussion
P
a
per
|
Discussion
P
a
per
|
Discuss
ion
P
a
per
|
When comparing results calculated for noontime UVI with the daily maximum UVI (Sup-plement), several differences become apparent. Values of all statistics (climatological
mean, 10th and 90th percentile, “minimum” and “maximum”) are larger for the daily maximum UVI than the noontime UVI. This is trivial because for any given day, the daily maximum is by definition larger than any other data product, and so are the statis-5
tics derived from the daily values. More notably, the difference between the two data
products is not the same for all statistics but is largest for the “minimum” and small-est for the “maximum” statistic. Because of this effect, the range (gray shading in the
figures) is smaller for the daily maximum data product, and the climatological mean of this data product is closer to the “maximum.” This phenomenon can be explained as 10
follows: for the noontime UVI, the “maximum” statistic is from the year with the smallest cloud attenuation at noon. While the daily maximum UVI can be higher (for example when scattered clouds enhance the UVI after noontime hours), the potential enhance-ment is limited to about 10 %, as discussed above. On the other hand, the “minimum” noontime UVI is observed when the cloud attenuation at noon was largest. It is likely 15
that the cloud cover was less during other parts of the day, leading to a value of the daily maximum UVI that can be substantially (>50 %) above the noontime observa-tion. At Summit, where the effect of clouds is small, there is little difference between
the noontime and daily maximum statistics.
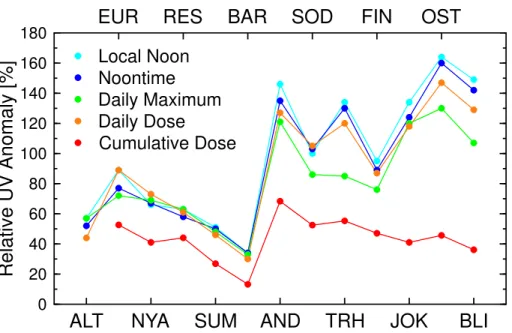
Figure 4 compares the maximum UV anomalies observed during the low-ozone pe-20
riod for all sites. For the western-hemisphere sites, anomalies calculated for data prod-ucts (1)–(4) are rather consistent and range between 30 % (Barrow) and 89 % (Eureka). For the Scandinavian sites, anomalies for data products (1), (2) and (4) are between 87 % (Finse) and 164 % (Østerås). Anomalies for data product (3) are systematically smaller for reasons explained in Sect. 7. Anomalies calculated for CED (data product 25
ACPD
13, 17253–17297, 2013High levels of ultraviolet radiation
G. Bernhard et al.
Title Page
Abstract Introduction
Conclusions References
Tables Figures
◭ ◮
◭ ◮
Back Close
Full Screen / Esc
Printer-friendly Version
Interactive Discussion
Discussion
P
a
per
|
D
iscussion
P
a
per
|
Discussion
P
a
per
|
Discuss
ion
P
a
per
|
Variations of anomalies as a function of site are similar for all data products, for exam-ple, anomalies are small at Barrow and large at Andøya.
The number of days between the day when the maximum relative increase occurred in 2011 and the day when the same UV level is typically observed is shown in Fig. 5. This measure was calculated by comparing the UV level on the day when the maximum 5
anomaly was observed with the temporal trace of the climatological mean. At the west-ern sites, high noontime UV levels observed in 2011 occurred between 5 (Alert) and 10 (Resolute) days earlier than normally. Results for data products (1)–(4) are rather consistent. For the eastern sites, the large UV levels in 2011 were observed between 15 and 62 days early. The time difference was largest when the UVI at noon (data
10
products (1) and (2)) was used as the criterion.
The shift is rather small at the western sites because these sites are located at high latitudes where the SZA was large at the time of the low-ozone event. Because the relative change in UVI for a 1◦-change in SZA is much larger when the Sun is close to
the horizon compared to when it is overhead, the percental change in UVI as a function 15
of time is much larger at the sites with the highest latitude. The effect of low ozone on
UV is therefore surpassed within a few days as the sun raises.
Figure 6 compares for each site the CED observed during the low-ozone period of 2011 with the doses determined for the same period in all years. The CED observed in 2011 was the highest at all sites, with the exceptions of Ny-Ålesund and Blindern 20
where the doses in 1997 and 1996, respectively, were slightly larger. In those years, Arctic ozone was also abnormally low (see Svendby and Dahlback, 2002 for 1996 and Newman et al., 1997 for 1997). Low ozone columns in 1997 resulted from the con-junction of a substantial photochemical loss, favored by high levels of chlorine and cold temperatures persisting until late March, and from a large-scale dynamically-induced 25
reduction linked to unusual meteorological conditions near the pole (Lefèvre et al., 1998).
ACPD
13, 17253–17297, 2013High levels of ultraviolet radiation
G. Bernhard et al.
Title Page
Abstract Introduction
Conclusions References
Tables Figures
◭ ◮
◭ ◮
Back Close
Full Screen / Esc
Printer-friendly Version
Interactive Discussion
Discussion
P
a
per
|
D
iscussion
P
a
per
|
Discussion
P
a
per
|
Discuss
ion
P
a
per
|
between 1.5 (Blindern) and 4.3 (Finse) standard deviations. Additional statistics of the high-UV episode in 2011 are provided in Appendix A.
7 Discussion
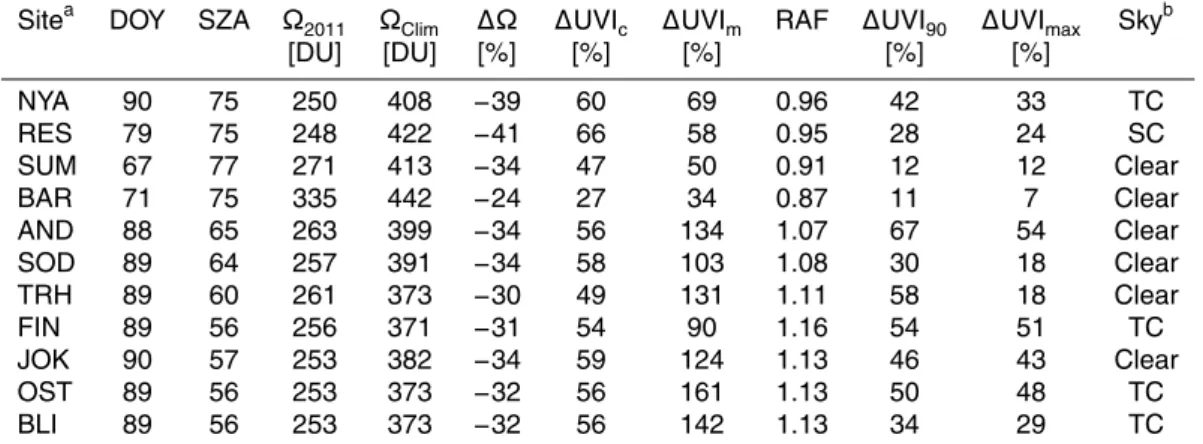
Anomalies quantified in Sect. 6 were based on a comparison of measurements in 2011 with climatological means. Here we compare these measured anomalies with 5
the expected increase in UV resulting from the abnormally low total ozone column alone. Using the radiative transfer model UVSPEC/libRadtran (Mayer and Kylling, 2005), two spectra were modeled for each site to complement observations for the day when the 2011 noontime UVI anomaly peaked. One spectrum was modeled with the ozone column of that day (Ω
2011) and the other with the climatological
10
ozone amount (Ω
Clim). Other model input parameters included the noontime SZA,
surface albedo, the AFGL atmospheric constituent profile for subarctic winter (An-derson et al., 1986), the Bass and Paur ozone absorption cross section (Bass and Paur, 1985), and an aerosol optical depth of 0.08 at 500 nm. The UVI was calcu-lated from the two spectra, resulting in UVI2011 for the ozone value of Ω
2011 and
15
UVIClim for the ozone value of Ω
Clim. A Radiative Amplification Factor (RAF) was
cal-culated with RAF=ln(UVI
2011/UVIClim)/ln(ΩClim/Ω2011) following the formulation by
Booth and Madronich (1994). The factor describes the percental change of the UVI in response to the percental change of the total ozone column. The variablesΩ
2011,
Ω
Clim, and RAF are shown in Table 3 along with the ozone anomaly, ∆Ω, defined as
20
∆Ω =(Ω
2011/ΩClim−1)×100; the UVI anomaly computed with the model from the
ozone anomaly, ∆UVI
c; the observed noontime UVI anomaly relative to the
climato-logical mean,∆UVI
m; and the observed sky condition in 2011.
Ozone anomalies∆Ωrange between−30 and−41 % with the exception of Barrow
where∆Ω =−24 %. For the western sites, the computed and observed UVI anomalies
25
ACPD
13, 17253–17297, 2013High levels of ultraviolet radiation
G. Bernhard et al.
Title Page
Abstract Introduction
Conclusions References
Tables Figures
◭ ◮
◭ ◮
Back Close
Full Screen / Esc
Printer-friendly Version
Interactive Discussion
Discussion
P
a
per
|
D
iscussion
P
a
per
|
Discussion
P
a
per
|
Discuss
ion
P
a
per
|
larger than the computed one. The largest difference is at Østerås where ∆UVI
m is
161 % and ∆UVI
c is 56 %. A small part of these discrepancies can be explained by
the fact that changes in UVI in response to changes in ozone are smaller at large SZAs (Micheletti et al., 2003). At the western sites, the UV anomaly peaked earlier in the year when noontime SZAs were larger than 74◦. RAFs for these sites range 5
between 0.87 and 0.96, indicating that a one percent change in ozone causes a change in the noontime UVI of less than 1 %. In contrast, SZAs are smaller than 66◦ at the
Scandinavian sites and RAFs range between 1.07 and 1.13. The larger part of the difference between ∆UVI
c and ∆UVIm can be explained by
the exceptionally good weather prevailing during the period of the low-ozone episode: 10
at all sites, the sky was either clear or covered by a thin cloud layer (Table 3). UV radiation is typically suppressed by clouds at all Scandinavian sites, which is evident from Fig. 3. The climatological mean is therefore well below clear-sky levels. To confirm that the good weather conditions can indeed explain the difference between∆UVI
cand
∆UVI
m, UV anomalies were recalculated by referencing the 2011 measurements to
15
either the 90th percentile or the maximum of the UVI distribution, resulting in∆UVI
90
and∆UVI
max. The “maximum” statistic is mostly composed of clear-sky days when total
ozone was below the climatological mean and albedo was high. By using the maximum statistic as the reference for calculating the UVI anomaly, the 2011 data are compared with the largest UVI observed historically. For this reason,∆UVI
maxshould always be
20
smaller than∆UVI
c. Values in Table 3 confirm that this is the case. Hence, the large
UVI anomalies of 2011 can be explained by the ozone anomaly plus the fact that cloud attenuation was minimal in 2011 but has a substantial effect on the climatological mean.
At Jokioinen, higher-than-normal surface albedo may have been an additional con-tributing factor. For example, the local albedo measured with a pyranometer during the 25
ACPD
13, 17253–17297, 2013High levels of ultraviolet radiation
G. Bernhard et al.
Title Page
Abstract Introduction
Conclusions References
Tables Figures
◭ ◮
◭ ◮
Back Close
Full Screen / Esc
Printer-friendly Version
Interactive Discussion
Discussion
P
a
per
|
D
iscussion
P
a
per
|
Discussion
P
a
per
|
Discuss
ion
P
a
per
|
albedo at Østerås increased the UVI by only 0.5–1.5 %. The effect of albedo at the two
sites was therefore negligible.
Short episodes (one day to one week) of abnormally low ozone columns are fre-quently observed throughout the mid-latitudes of both hemispheres and have been labeled “ozone mini-holes” (Newman et al., 1988). These phenomena are typically 5
caused by a superposition of horizontal advection and vertical air motion, usually occur-ring when ozone-poor subtropical air masses are advected polewards and eastwards (Krzyścin, 2002). In extreme cases, mini-holes can increase erythemal UV irradiance
by 75 % (Antón et al., 2007). The large UVI anomalies observed in the spring of 2011 are attributable to the ozone-depleted Arctic vortex and are therefore the result of a dif-10
ferent mechanism than UV increases caused by these ozone mini-holes.
The occurrence of clear-skies over much of Scandinavia during the peak of the low-ozone episode at the end of March and beginning of April 2011 could be fortuitous. However, there could also be a link between the location of the strong polar vortex and local cloud conditions: a strong polar vortex could bring both low ozone and clear skies 15
to the European North. For example, it has long been known that ozone columns anti-correlate with tropopause height (Dobson, 1929), and this observation has recently been confirmed for Arctic locations (Kivi et al., 2007). A high tropopause leads to a re-duction in the total ozone column because a larger fraction of the atmospheric col-umn is made up of ozone-poor tropospheric air (Steinbrecht et al., 1998; Stick et al., 20
2006). Thus, the relatively high tropopause observed over Scandinavia on 1 and 2 April 2011 (L. Thölix, personal communication, FMI, 2013) may have contributed to the low ozone column during this period. A more detailed analysis of the correlations between tropopause height, total ozone, and weather is beyond the scope of this paper.
Of all data products discussed in Sect. 6, anomalies relative to the climatological 25
mean are largest for noontime measurements (Fig. 4). There is little difference
ACPD
13, 17253–17297, 2013High levels of ultraviolet radiation
G. Bernhard et al.
Title Page
Abstract Introduction
Conclusions References
Tables Figures
◭ ◮
◭ ◮
Back Close
Full Screen / Esc
Printer-friendly Version
Interactive Discussion
Discussion
P
a
per
|
D
iscussion
P
a
per
|
Discussion
P
a
per
|
Discuss
ion
P
a
per
|
UV anomalies based on noontime measurements, in particular at sites most affected
by variable clouds (e.g., Scandinavian sites with low snow cover). This phenomenon is mostly caused by the fact that the climatological mean for the “daily maximum UVI” data product is closer to the “maximum” statistic than it is the case for the “noontime UVI” data product. Because anomalies are determined by comparing measurements with 5
the respective climatological mean, anomalies are smaller in the case of the maximum daily UVI.
UVI anomalies calculated for daily doses (data product (4)) tend to be smaller than anomalies for the noontime UVI. This is partly due to the fact that also measurements at large SZAs, when RAFs are small, contribute to the daily dose.
10
The analysis of the effects of subsampling presented in Sect. 5 suggests that an
accurate climatology of noontime UV measurements can be accomplished with instru-ments that sample at a rate of as low as one measurement per hour. This result is en-couraging considering that most spectroradiometer-based monitoring programs used low sampling rates at the beginning of the data record. However, climatologies based 15
on daily maxima derived from these measurements are likely biased low by as much as 12 % because measurements at one-hour intervals do not capture short-term spikes in UV (lasting 1 min or less) caused by broken clouds. Data for single days are much more affected than climatologies by low sampling rates with errors that may occasionally
ex-ceed±30 % (Fig. 2). Anomalies calculated for the 2011 low-ozone event are fortunately 20
only modestly affected by the sampling rate: noontime UVI anomalies calculated from
the 1 min data agreed to within±2 % with the data subsampled at 15 min intervals and ±10 % with the data subsampled at 60 min. The effect of subsampling on the accuracy of daily dose calculations has been assessed by den Outer et al. (2005): based on UV measurements performed at 1 min intervals at a site in the Netherlands, den Outer 25
ACPD
13, 17253–17297, 2013High levels of ultraviolet radiation
G. Bernhard et al.
Title Page
Abstract Introduction
Conclusions References
Tables Figures
◭ ◮
◭ ◮
Back Close
Full Screen / Esc
Printer-friendly Version
Interactive Discussion
Discussion
P
a
per
|
D
iscussion
P
a
per
|
Discussion
P
a
per
|
Discuss
ion
P
a
per
|
8 Conclusions
Measurements of UV radiation at thirteen Arctic and sub-Arctic locations in the spring of 2011 were compared with long-term data records at these sites. During the low-ozone episode in March and April 2011, measurements of the UVI and erythemal dose were amplified by up to 164 % compared to the climatological mean. The magnitude 5
of UV anomalies depends strongly on site and to a lesser degree on the data product that is used to assess the effect.
At the western sites (e.g., Resolute, Summit, and Barrow), UV anomalies relative to the climatological mean can be well explained with the abnormally low total ozone amounts in 2011. At the Scandinavian sites, low ozone can only explain an increase 10
in the UVI by 50–60 %. The remaining increase was caused by the absence of clouds during a significant portion of the low-ozone period and by later-than-normal onset of snow melt at some sites such as Jokioinen.
At the high-Arctic sites, the low-ozone event was already present when the Sun was little above the horizon (e.g., solar elevation<2◦at Eureka) and lasted roughly until the 15
end of March 2011. The episode therefore occurred during a time when solar elevations were small. For example, the noontime solar elevation on 30 March is 12◦ at Alert and
23◦at Barrow. At the Scandinavian sites, the low-ozone episode occurred between 24 March and 3 April with solar elevations on 30 March ranging between 25◦ (Andøya) and 34◦(Blindern).
20
Because surface UV levels are first and foremost controlled by the height of the Sun above the horizon, absolute UV anomalies remained small at the high-Arctic sites despite record-low ozone amounts: the maximum absolute UVI anomaly was 0.46 UVI units and observed at Summit. At the Scandinavian sites, the absolute UVI anomaly was typically between 1.0 and 2.0 UVI units, with the maximum increase of 2.2 UVI 25
ACPD
13, 17253–17297, 2013High levels of ultraviolet radiation
G. Bernhard et al.
Title Page
Abstract Introduction
Conclusions References
Tables Figures
◭ ◮
◭ ◮
Back Close
Full Screen / Esc
Printer-friendly Version
Interactive Discussion
Discussion
P
a
per
|
D
iscussion
P
a
per
|
Discussion
P
a
per
|
Discuss
ion
P
a
per
|
activity in snow when radiation is reflected upward toward the face (Cockell et al., 2001). This is particular a problem when high UV levels occur at a time of a year when they are not expected (Abarca et al., 2002). Larger, absolute UVI increases occurred at lower latitudes in April 2011 during excursions of the polar vortex. For example, on 22 April, the clear-sky UV Index over parts of Mongolia (48◦N, 98◦E) estimated by TEMIS
5
(Tropospheric Emission Monitoring Internet Service at http://www.temis.nl/uvradiation/ UVindex.html) was 8.6 when a lobe of the polar vortex extended to central Asia. The long-term average for this day at this location is 5.4 with a standard deviation of 0.5, i.e., the anomaly was more than six standard deviations larger than the climatological mean.
10
The low-ozone event increased the CED by more than two standard deviation beyond the climatological mean at 11 sites (Appendix A). The increase was larger than three standard deviation at seven sites (Eureka, Resolute, Summit, Andøya, Sodankylä, Trondheim, and Finse), and larger than four standard deviation at Eureka and Finse, confirming that the event was truly exceptional.
15
The number of days between the day when the maximum relative increase occurred in 2011 and the day when the same UV level is typically observed was between 5–10 days at the western sites and 15–62 days at the Scandinavian sites.
Severe ozone depletion like that observed in 2011 or even worse could appear for cold Arctic winters over the next decades if the observed tendency for cold Arctic win-20
ters to become colder continues into the future (Sinnhuber et al., 2011). Increases in UV radiation as large as those discussed in this paper could therefore reoccur.
Appendix A
UVI anomaly statistics
Statistics of the high-UV episode in 2011 are provided in Tables 4 (non-Scandinavian 25
ACPD
13, 17253–17297, 2013High levels of ultraviolet radiation
G. Bernhard et al.
Title Page
Abstract Introduction
Conclusions References
Tables Figures
◭ ◮
◭ ◮
Back Close
Full Screen / Esc
Printer-friendly Version
Interactive Discussion
Discussion
P
a
per
|
D
iscussion
P
a
per
|
Discussion
P
a
per
|
Discuss
ion
P
a
per
|
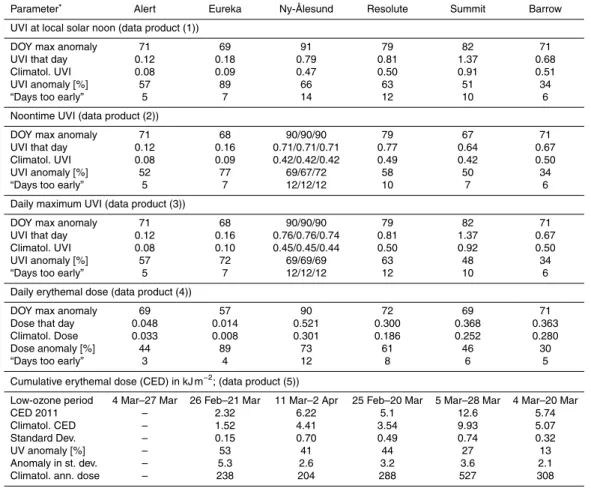
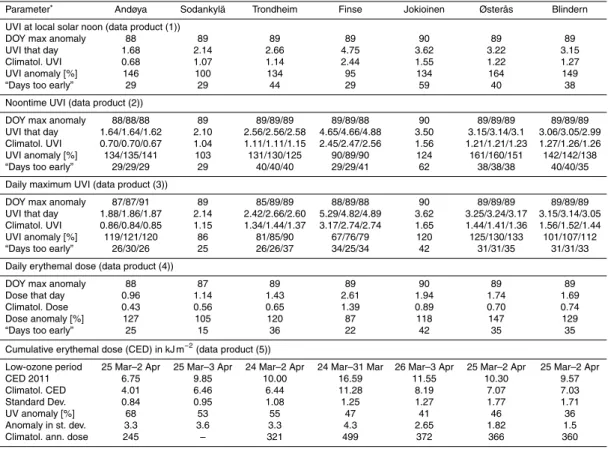
(2) and (3) are given for the datasets derived from the native 1 min data and the sub-sampled data for 15 and 60 min sampling intervals. The following statistics were consid-ered for data products (1)–(4): the day of the year (DOY) when the maximum relative increase occurred (“DOY max anomaly”); the UV measurement on this day in 2011 (“UVI that day”); the climatological UV measurement for this day, calculated as aver-5
age of measurements from all available years up to 2010 (“Climatol. UVI”); the relative UVI anomaly discussed earlier (“UVI anomaly”); and the number of days between the day when the maximum UVI anomaly occurred in 2011 and the day when the same UVI is typically observed (“Days too early”). For data product (5), Tables 4 and 5 pro-vide the following statistics: low-ozone period; the CED for the 2011 low-ozone period 10
(“CED 2011”); the climatological dose for this period (“Climatol. CED”); the standard deviation for this period (“Standard Dev.”); the dose anomaly for 2011 expressed in percent (“UV anomaly”); the same anomaly expressed in multiples of standard devia-tions (“Anomaly in st. dev.”); and the climatological annual erythemal dose (“Climatol. ann. dose”). Climatological doses are only based on years when sufficient data were
15
available to estimate the annual dose accurately. Tables 4 and 5 support the following conclusions:
– For the western sites, the maximum anomaly of the noontime UVI (data product (2)) occurred between DOY 76 (8 March at Summit) and DOY 79 (20 March at Resolute) and ranged between 34 % (Barrow) and 77 % (Eureka). For Ny-Ålesund 20
and the Scandinavian sites, the maximum anomaly occurred between DOY 88 (29 March) and DOY 90 (31 March) and ranged between 90 % (Finse) and 161 % (Østerås).
– Anomalies for the daily maximum UVI (data product (3)) agree to within ±5 %, with anomalies for data product (2) for the western sites. For the Scandinavian 25
ACPD
13, 17253–17297, 2013High levels of ultraviolet radiation
G. Bernhard et al.
Title Page
Abstract Introduction
Conclusions References
Tables Figures
◭ ◮
◭ ◮
Back Close
Full Screen / Esc
Printer-friendly Version
Interactive Discussion
Discussion
P
a
per
|
D
iscussion
P
a
per
|
Discussion
P
a
per
|
Discuss
ion
P
a
per
|
– Anomalies calculated for data product (1), which are based on one sample point only, and data product (2) agree to within±12 % for all sites. Anomalies calculated for data products (2) and (4) agree to within±14 %.
– UVI anomalies calculated from the 1 min data agreed to within±2 % with the data subsampled at 15 min intervals and±10 % with the data subsampled at 60 min 5
intervals for data product (2). For data product (3) the differences increased to
±5 % and ±12 %, respectively. The larger effect of subsampling on data product (3) can be explained with transients enhancement of the UVI by clouds.
– The day of the year when the maximum anomaly occurred agrees to within ±1 day for data products (1)–(3) for all sites but Summit. At Summit, the maximum 10
anomaly occurred on DOY 67 for data product (2) and DOY 82 for data products (1) and (3). This apparent inconsistency is caused by the fact that UVI anomalies have local maxima at the two days of almost equal magnitude (Fig. 3), with one local maximum dominating data product (2) and the other data products (1) and (3). A similar effect also explains why the anomaly for daily dose (data product (4))
15
peaked at different days at Eureka, Resolute, and Summit than the anomalies for
data products (1)–(3).
– Statistics for two nearby sites Østerås and Blindern are very consistent. For ex-ample, the climatological CED and climatological annual dose agree to within 0.6 % and 1.7 %, respectively. The good agreement is somewhat serendipitous 20
and partly due to the different lengths of data records of the two sites: relatively
low total ozone amounts in 1996 (Svendby and Dahlback, 2002) led to increased UV levels at Blindern before measurements at Østerås were available. If statis-tics are based only on years when data at both sites are available (1999–2012), measurements at Blindern are smaller than at Østerås by 7.0 % (CED for 2011), 25
4.8 % (climatological CED) and 2.0 % (climatological annual dose). While these difference are still within the expanded uncertainties of the measurements, the
ACPD
13, 17253–17297, 2013High levels of ultraviolet radiation
G. Bernhard et al.
Title Page
Abstract Introduction
Conclusions References
Tables Figures
◭ ◮
◭ ◮
Back Close
Full Screen / Esc
Printer-friendly Version
Interactive Discussion
Discussion
P
a
per
|
D
iscussion
P
a
per
|
Discussion
P
a
per
|
Discuss
ion
P
a
per
|
north of Blindern is steeper than at Østerås, which would increases the likelihood of cloud formation at Blindern when the prevailing southerly winds are lifted up-wards.
Supplementary material related to this article is available online at: http://www.atmos-chem-phys-discuss.net/13/17253/2013/
5
acpd-13-17253-2013-supplement.zip.
Acknowledgements. Funding for this study was provided by the US National Science Founda-tion’s Office of Polar Programs Arctic Sciences Section (award ARC-1203250), the Academy of Finland through the SAARA project, and the Norwegian Climate and Pollution Agency (KLIF). We are grateful to the numerous dedicated individuals who have operated UV radiometers at
10
the thirteen locations for many years.
References
Aalerud, T. N. and Johnsen, B. J.: The Norwegian UV Monitoring Network, Period 1995/96 to 2004, Strålevern Rapport 2006:4, Norwegian Radiation Protection Authority, Østerås, Nor-way, 2006.
15
Abarca, J. F., Casiccia, C. C., Zamorano, F. D.: Increase in sunburns and photosensitivity dis-orders at the edge of the Antarctic ozone hole, southern Chile, 1986–2000, J. Am. Acad. Dermatol., 46, 193–199, 2002.
Anderson, G. P., Clough, S. A., Kneizys, F. X., Chetwynd, J. H., and Shettle, E. O. AFGL atmo-spheric constituents profiles (0–120 km), Tech. Rep. AFGL-TR-86-0110, Air Force Geophys.
20
Lab., Hanscom Air Force Base, Mass., 1986.
Antón, M., Cancillo, M. L., Serrano, A., Vaquero, J. M., and García, J. A.: Ozone mini-hole over southwestern Spain during January 2004: influence over ultraviolet radiation, Geophys. Res. Lett., 34, L10808, doi:10.1029/2007GL029689, 2007.
Arctic Climate Impact Assessment (ACIA), Cambridge University Press, 1042 pp., 2005.