Atmos. Chem. Phys., 16, 14805–14824, 2016 www.atmos-chem-phys.net/16/14805/2016/ doi:10.5194/acp-16-14805-2016
© Author(s) 2016. CC Attribution 3.0 License.
Impacts of global open-fire aerosols on direct radiative, cloud and
surface-albedo effects simulated with CAM5
Yiquan Jiang1,2, Zheng Lu2, Xiaohong Liu2, Yun Qian3, Kai Zhang3, Yuhang Wang4, and Xiu-Qun Yang1 1CMA-NJU Joint Laboratory for Climate Prediction Studies, Institute for Climate and Global Change Research, School of Atmospheric Sciences, Nanjing University, Nanjing, China
2Department of Atmospheric Science, University of Wyoming, Laramie, Wyoming, USA 3Pacific Northwest National Laboratory, Richland, Washington, USA
4School of Earth and Atmospheric Sciences, Georgia Institute of Technology, Atlanta, Georgia, USA Correspondence to:Xiaohong Liu ([email protected])
Received: 24 February 2016 – Published in Atmos. Chem. Phys. Discuss.: 1 April 2016 Revised: 30 October 2016 – Accepted: 8 November 2016 – Published: 29 November 2016
Abstract.Aerosols from open-land fires could significantly perturb the global radiation balance and induce climate change. In this study, Community Atmosphere Model ver-sion 5 (CAM5) with prescribed daily fire aerosol emis-sions is used to investigate the spatial and seasonal char-acteristics of radiative effects (REs, relative to the case of no fires) of open-fire aerosols including black carbon (BC) and particulate organic matter (POM) from 2003 to 2011. The global annual mean RE from aerosol–radiation inter-actions (REari) of all fire aerosols is 0.16±0.01 W m−2 (1σ uncertainty), mainly due to the absorption of fire BC (0.25±0.01 W m−2), while fire POM induces a small ef-fect (−0.05 and 0.04±0.01 W m−2 based on two differ-ent methods). Strong positive REari is found in the Arc-tic and in the oceanic regions west of southern Africa and South America as a result of amplified absorption of fire BC above low-level clouds, in general agreement with satellite observations. The global annual mean RE due to aerosol–cloud interactions (REaci) of all fire aerosols is
−0.70±0.05 W m−2, resulting mainly from the fire POM ef-fect (−0.59±0.03 W m−2). REari (0.43±0.03 W m−2)and REaci (−1.38±0.23 W m−2)in the Arctic are stronger than in the tropics (0.17±0.02 and −0.82±0.09 W m−2 for REari and REaci), although the fire aerosol burden is higher in the tropics. The large cloud liquid water path over land areas and low solar zenith angle of the Arctic favor the strong fire aerosol REaci (up to−15 W m−2)during the Arc-tic summer. Significant surface cooling, precipitation reduc-tion and increasing amounts of low-level cloud are also found
in the Arctic summer as a result of the fire aerosol REaci based on the atmosphere-only simulations. The global an-nual mean RE due to surface-albedo changes (REsac) over land areas (0.03±0.10 W m−2)is small and statistically in-significant and is mainly due to the fire BC-in-snow effect (0.02 W m−2)with the maximum albedo effect occurring in spring (0.12 W m−2)when snow starts to melt.
1 Introduction
Open fires or biomass burning of living and dead vegetation are an integral component of the Earth’s system and have sig-nificant impacts on the carbon cycle (Ciais et al., 2013) and the climate (Bowman et al., 2009; Keywood et al., 2011; Liu et al., 2014; Sommers et al., 2014; Voulgarakis and Field, 2015). On one hand, open fires can perturb the climate sys-tem by emitting greenhouse gases and aerosols (Kaiser et al., 2012; Wiedinmyer et al., 2011). On the other hand, climate states and variabilities can play a critical role in determining the occurrence frequency and intensity of open fires (Marlon et al., 2009; van der Werf et al., 2008; Westerling et al., 2006; Bistinas et al., 2014). However, much is unknown regarding the feedback mechanisms between open fire and climate in-teractions (Carslaw et al., 2010; Liu et al., 2014). A quali-fication of radiative forcing of fire aerosols as conducted in this study is the first step to reducing these uncertainties.
14806 Y. Jiang et al.: Impacts of global open-fire aerosols
the solar radiation in the atmosphere (direct effect) (Carslaw et al., 2010) and by changing the surface albedo when they are deposited on the snow and ice (surface-albedo effect) (Flanner et al., 2007; Quinn et al., 2008; Randerson et al., 2006; Qian et al., 2011, 2015). In addition, open fire or smoke particles can modify the cloud properties, precipitation ef-ficiency and the hydrological cycle by changing the atmo-spheric thermal structure (semi-direct effect) (Koch and Del Genio, 2010; Andreae et al., 2004) or acting as cloud conden-sation nuclei (CCN) (indirect effects) (Andreae and Rosen-feld, 2008; Qian et al., 2009; Lu and Sokolik, 2013).
The radiative effect (RE) (Boucher and Tanré, 2000) and radiative forcing (RF) (Forster et al., 2007; Myhre et al., 2013a) are typical metrics used to assess and compare anthropogenic and natural drivers of climate change. The aerosol RE represents the instantaneous radiative impact of atmospheric particles on the Earth’s energy balance (Heald et al., 2014). RF is calculated as the change of RE between two different periods, e.g., the pre-industrial and the present-day times (Heald et al., 2014; Liu et al., 2007), based on the aerosol and precursor gas emissions in the two periods (Den-tener et al., 2006; Lamarque et al., 2010).
RF from aerosol–radiation interactions (RFari) involving biomass burning aerosols has been estimated since the IPCC second Assessment Report (AR2). Based on the Aerosol Comparisons between Observations and Models (AeroCom) Phase II simulations (Bond et al., 2013; Myhre et al., 2013b), RFari of biomass burning aerosols in the IPCC Fifth Assess-ment Report (AR5) is estimated to be 0.0 W m−2 (ranging from−0.20 to 0.20 W m−2), and the RFari of biomass burn-ing black carbon (BC) and primary organic matter (POM) have values with opposite signs (i.e., 0.10 and−0.10 W m−2, respectively).
There are also some studies that estimated the RE from aerosol–radiation interactions (REari) involving fire aerosols by comparing the simulation with fire emissions to the simu-lation with no fire emissions. For example, using the NCAR Community Atmosphere Model version 4 (CAM4) with a bulk aerosol module, Tosca et al. (2013) reported that the top-of-atmosphere (TOA) REari from global biomass burn-ing aerosols is 0.18±0.10 W m−2, averaged for the period of 1997–2009. Ward et al. (2012) estimated the REari from biomass burning aerosols in the pre-industrial (for the year 1850), present-day (for the year 2000) and future time peri-ods (for the year 2100), and found that the biomass burning aerosol REari for the year 2000 is 0.13 and−0.27 W m−2for all-sky and clear-sky conditions, respectively.
RE from aerosol–cloud interactions (REaci) of biomass burning aerosols can be comparable in magnitude or of an even stronger magnitude than the REari (Liu et al., 2014). With a global aerosol-climate model, the REaci of biomass burning aerosols was estimated to range from −1.74 to
−1.00 W m−2for the year 2000 in Ward et al. (2012). The semi-direct radiative effect of biomass burning aerosols is not independently assessed in IPCC reports. The magnitude was
reported to be about 7.0 W m−2 in the southern American biomass burning regions by examining the radiative flux dif-ference with and without the biomass burning aerosol effect on clouds (Liu, 2005).
The RF or RE due to surface-albedo changes (RFsac or REsac) of BC from open fires and other sources has been es-timated in previous studies. For biomass burning emissions with a strong (1998) and weak (2001) boreal fire year, RE of fire BC-in-snow was estimated to be 0.011 and 0.006 W m−2, respectively (Flanner et al., 2007). Randerson et al. (2006) reported that BC from a boreal forest fire deposited on snow and sea ice introduced a global annual mean RE of 8±5 W m−2 of burned area in the first year when the fire happened. A summary of BC-in-snow forcing/effect can be found in Bond et al. (2013). They reported that the present-day RE of fire BC-in-snow ranges from 0.006 to 0.02 W m−2 based on previous studies (Jacobson, 2004; Rypdal et al., 2009; Skeie et al., 2011; Hansen et al., 2005; Flanner et al., 2007, 2009; Koch et al., 2009).
Biomass burning aerosols can have significant impacts on global and regional precipitation and atmospheric cir-culation. With the change of fire emissions from 1860 to 2000, Jones et al. (2007) found that biomass burning aerosols decrease the global near-surface air temperature by about 0.25◦C when considering the feedbacks of sea surface
tem-perature (SST) in the model. As shown in Tosca et al. (2013), the direct and semi-direct effects of biomass burning aerosols reduce the precipitation near the equator and weaken the Hadley circulation. With a regional climate model, Zhang et al. (2009) found that biomass burning aerosols may warm and stabilize the lower troposphere and thus reinforce the dry season rainfall pattern in southern Amazonia. The absorption of shortwave radiation by biomass burning BC could increase the vertical stratification and inhibit both the cloud forma-tion and precipitaforma-tion (Ackerman et al., 2000; Tosca et al., 2014). In contrast, biomass burning aerosols could invigo-rate the convective clouds (Andreae et al., 2004; Koren et al., 2005) through suppressing warm rain processes in the con-vection and enhance the latent heat release at higher levels (Andreae and Rosenfeld, 2008).
sea-Y. Jiang et al.: Impacts of global open-fire aerosols 14807
sonal characteristics of fire aerosol REs, and the impacts on the global precipitation and temperature are discussed.
Compared to earlier studies of fire aerosol REs (Tosca et al., 2013; Ward et al., 2012), a number of improvements are made in this study. First, a higher model horizontal resolu-tion at 0.9◦by 1.25◦is used vs. 1.9◦by 2.5◦. The higher
res-olution allows for more efficient transport of aerosols from the sources to remote regions (Ma et al., 2013, 2014). Model resolution has also been shown to be important for aerosol REaci (Ma et al., 2015). Second, the latest CAM5 model with MAM4 is used. MAM4 with an additional primary carbon mode explicitly treats the microphysical aging of primary carbonaceous aerosols (POM/BC) in the atmosphere. MAM4 has higher BC and POM burdens over the earlier 3-mode ver-sion of MAM (MAM3) in the remote regions by∼30 % (Liu et al., 2016). Third, daily instead of monthly fire emissions are used, which allows the model to consider the effect of fast changes in the fire emission flux on local atmospheric conditions. It is expected that, using the monthly mean emis-sion flux, the model cannot consider the effect of extremely strong fires, thus it might underestimate the fire aerosol REs for such cases. Finally, a new methodology (Ghan, 2013) is used to more accurately diagnose the REs of fire aerosols. Central to this method is that the REari must be calculated in the presence of clouds (i.e., under the all-sky condition), and the REaci must be calculated under the condition of no aerosol effects on radiation. With the radiative forcing de-composition of this method, REsac can also be quantified.
The paper is organized as follows. Section 2 introduces the model and experiments. Section 3 describes the methods of diagnosing the fire aerosol REs. Section 4 presents the model results of fire aerosol REs and impacts on global and regional surface temperature and precipitation. Conclusions and discussion are given in Sect. 5.
2 Model, experimental design and aerosol radiative effect method
2.1 Model
In our study, we use the Community Earth System Model (CESM) version 1.2, with the Community Atmosphere Model version 5.3 (CAM5.3) (Neale et al., 2012) coupled with the Community Land Model version 4 (CLM4) (Oleson et al., 2010). The Snow, Ice, and Aerosol Radiative model (SNICAR) (Flanner and Zender, 2005) is turned on in the simulations to diagnose the biomass burning BC-in-snow ef-fect. CAM5 includes several major updates in its physics pa-rameterizations compared to previous CAM versions. A two-moment stratiform cloud microphysics scheme is included in CAM5 to predict both the mass and number mixing ra-tios of cloud liquid and cloud ice (Morrison and Gettelman, 2008). MAM4, which was updated from MAM3 (Liu et al., 2012), includes aerosol mass and number mixing ratios in
four lognormal modes: Aitken, accumulation, coarse and pri-mary carbon mode (Liu et al., 2016). An additional pripri-mary carbon mode is included in MAM4 on the top of MAM3 to explicitly treat the microphysical aging of primary carbona-ceous aerosols (POM and BC) in the atmosphere. POM and BC in MAM4 are emitted in the primary carbon mode instead of directly in the accumulation mode as in MAM3. MAM4 significantly increases the BC and POM concentrations in the remote regions (e.g., over oceans and the Arctic) due to re-duced wet scavenging of POM and BC in the primary carbon mode with a lower hygroscopicity than in the accumulation mode. The increase is relatively small in the land source re-gions (Liu et al., 2016).
2.2 Experimental design
CAM5 was run with the finite volume dynamics core in a resolution of 0.9◦latitude by 1.25◦longitude and 30 vertical
levels. The model was run for the time period of year 2003 to 2011 (i.e., for 9 years) with prescribed monthly SST and sea ice. The year 2003 was run twice and the first year sim-ulation was used as a model spin-up. Global Fire Emissions Database version 3.1 (GFED 3.1) daily emissions (Giglio et al., 2013) for BC, POM and sulfur dioxide (SO2)from 2003 to 2011 are prescribed, and the vertical distribution of fire emissions is based on the AeroCom protocol (Dentener et al., 2006). Anthropogenic aerosol and precursor gas emis-sions are from the IPCC AR5 data set (Lamarque et al., 2010). We performed our control experiment (FIRE) with the GFED fire emissions turned on and a sensitivity exper-iment (NOFIRE) with the fire emissions turned off. Differ-ences between FIRE and NOFIRE experiments are used to calculate the REs and atmospheric effects of biomass burn-ing aerosols on temperature and precipitation. Two additional experiments, NOFIREBC and NOFIREPOM, were respec-tively performed with fire BC and POM emissions turned off. Differences between the control (FIRE) and these two exper-iments represent the contributions from biomass burning of BC and POM. Other forcings (e.g., SST, greenhouse gases) of all these experiments are kept the same. We performed ten ensemble members for each of these experiments. Further-more, we performed the other experiment (FIRE_BBFFBF) using the modified CAM5 model that separately predicts the BC and POM from biomass burning (BB), fossil fuel (FF) and biofuel (BF) sources, while other model features are kept the same as the FIRE experiment. A summary of all the ex-periments in this study can be found in Table 1.
14808 Y. Jiang et al.: Impacts of global open-fire aerosols
Table 1.Numerical experiments and associated fire aerosol emis-sions in each experiment.
Experiment Ensembles Fire Fire Fire BC POM SO2
FIRE 10 On On On
NOFIRE 10 Off Off Off NOFIREBC 10 Off On On NOFIREPOM 10 On Off On FIRE_BBFFBF 1 On On On
precipitation and circulation) are allowed to adjust in the ex-periments. However, with SST and sea ice prescribed in these experiments, only the rapid adjustments are taken into ac-count. Thus, the effective radiative effects are actually calcu-lated in this study.
1Ffire aero=Ffire−Fnofire (1)
1Ffire bc=Ffire−Fnofirebc (2)
1Ffire pom=Ffire−Fnofirepom (3)
The total TOA shortwave flux change can be broken into the REari, REaci and REsac. The aerosol REaci results from both the aerosol effect on clouds (i.e., acting as CCN) and the aerosol semi-direct effect on clouds (i.e., affecting the at-mospheric states due to absorbing aerosols). We adopt the method by Ghan (2013) to separate the REari, REaci and REsac from the total effects of all fire aerosols, fire BC and fire POM, respectively. The method is summarized as fol-lows. Fclean is the radiative flux at TOA calculated from a diagnostic radiation call in the same control simulations, but neglecting the scattering and absorption of solar radiation by aerosols.Fclean,clearis the clear-sky radiative flux at TOA cal-culated from the same diagnostic radiation call, but neglect-ing scatterneglect-ing and absorption by both clouds and aerosols.
1F = 1(F−Fclean) +1(Fclean−Fclean,clear)
(REari) (REaci)
+1Fclean,clear
(REsac) (4)
In the method above, REaci includes both aerosol indirect and semi-direct effects. The fire BC has a much weaker indi-rect effect due to its lower mass burden and lower hygroscop-icity compared to fire POM (Koch et al., 2011). Thus, the fire aerosol semi-direct effect can be approximately represented by the REaci of fire BC. The fire aerosol indirect effect can be estimated as the difference between the fire aerosol REaci and semi-direct effect. With the sea ice prescribed in these experiments, the radiative effect of fire aerosols on sea ice albedo is not considered in REsac.
We undertake another method to estimate the fire aerosol REari from the experiment (FIRE_BBFFBF). With explicit predictions of fire POM and fire BC in FIRE_BBFFBF, the
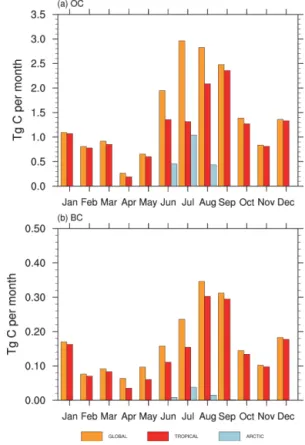
Figure 1.Seasonal variation of GFED monthly fire(a)organic car-bon (OC) and(b)black carbon (BC) emissions (Tg C month−1) av-eraged for the period of year 2003 to 2011 in the global, tropical (25◦S to 25◦N) and the Arctic (60 to 90◦N) regions.
REari of fire BC and fire POM are estimated by two di-agnostic radiation calls, each time neglecting the scattering and absorption of solar radiation of fire BC and fire POM. This more direct method is named BBFFBF, and the REari of fire BC and fire POM will be compared with those from the method by Ghan (2013). The fire BC-in-snow effect is calculated from SNICAR, and compared with the REsac es-timated from Ghan (2013).
3 Results
3.1 Simulation of biomass burning aerosols
The biomass burning BC and POM from forest, grass and agriculture fires are significant contributors to the total BC and POM emissions. Figure 1 shows the seasonal variation of GFED fire emissions (including forest, grass and agriculture fires) in the global, tropical (25◦S to 25◦N), and the
Arc-tic (60 to 90◦N) regions. Global fire emission is the largest
Y. Jiang et al.: Impacts of global open-fire aerosols 14809
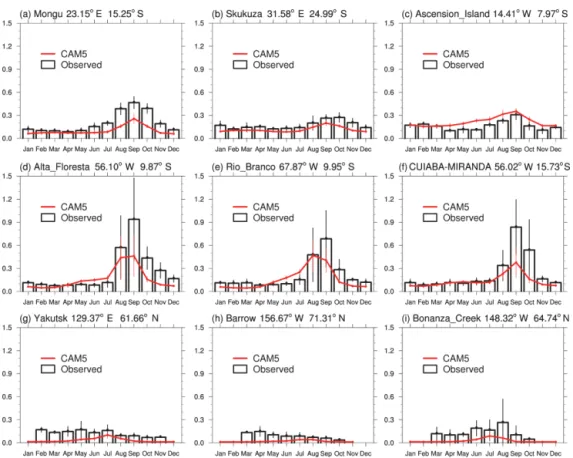
Figure 2.Comparison of modeled seasonal variations of aerosol optical depth (AOD) for the period of 2003–2011 with observations for the same period from the AERONET sites. The upper, middle and bottom panels represent the sites in southern Africa, South America and the Arctic. The vertical bars are±1σ variabilities for the modeled and observed AOD.
regions. The Arctic is the other important fire region, where the emission maximum is found during the boreal summer. In the boreal summer, the OC emission in the Arctic regions is about 50 % of that in the tropical region. The BC emission in the Arctic is much smaller than in the tropical regions even in the boreal summer fire season. The dominant fire type in the SH tropics is deforestation, savanna and grassland fires, while that in the Arctic is the forest fires. The OC to BC ra-tio (OC/BC) of forest fires is almost 3 times higher than that of deforestation, savanna and grassland fires (van der Werf et al., 2010). This is because for forest fires, most of the emissions come from the smoldering phase of burning, which has a higher OC to BC ratio. For deforestation, sa-vanna and grassland fires, the emissions come mainly from the flaming phase of burning, which yields a lower OC to BC ratio.
Figure S1 in the Supplement shows the latitudinal and longitudinal distributions of vertically integrated concentra-tions (column burdens) of BC and POM from BB, FF and BF sources based on the FIRE_BBFFBF experiment. The BC and POM from the BB source are mainly distributed in the tropical and subtropical regions (southern Africa, South America and Southeast Asia) and in the middle to high lat-itudes (North of 45◦N) of the Northern Hemisphere (NH)
(northeast Asia, Alaska and Canada). The largest column
burdens of biomass burning aerosols are located in southern Africa and the adjacent oceanic areas (1.5 and 20 mg m−2for BC and POM, respectively). The biomass burning aerosols are important aerosol species in the Arctic regions and con-tribute up to 53 and 86 % of the total burdens of BC and POM respectively in the Arctic (from 60 to 90◦N). In comparison,
the maximum column burdens of fossil fuel BC and POM are found in East Asia, southern Asia, western Europe and North America. The maximum column burdens of biofuel BC and POM occur in East Asia, southern Asia and central Africa. The biofuel and fossil fuel sources are dominant contribu-tors to BC and POM in East Asia and southern Asia. In other regions of the world, biomass burning is the primary source of BC and POM. Globally, biomass burning contributes 41 and 70 % to the total burdens of BC and POM, respectively. Biomass burning can also emit SO2. However, it only con-tributes∼3 % to the total global sulfate burden (figure not shown), so only radiative effects of biomass burning POM and BC are discussed in this study.
14810 Y. Jiang et al.: Impacts of global open-fire aerosols
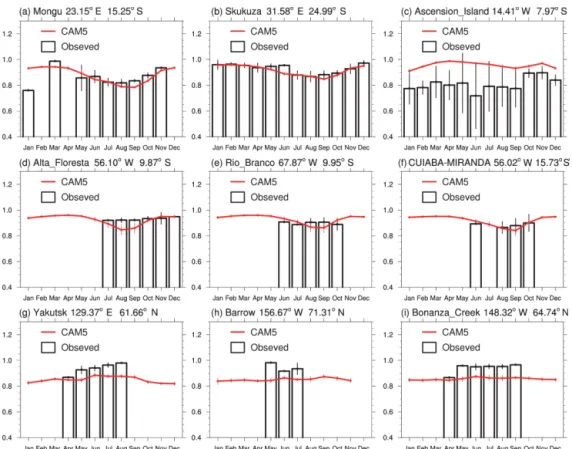
Figure 3.Same as Fig. 2, but for the comparison of single-scattering albedo (SSA) at 550 nm.
Figs. 2 and 3 (see Fig. S2 in the Supplement for the site loca-tions). The AERONET AOD and SSA data are averaged for the years from 2003 to 2011 to match the simulation period, although there are missing AERONET data for some periods. We note that Tosca et al. (2013) and Ward et al. (2012) ap-plied scaling factors (from 1 to 3 varying by regions) to fire emissions to improve modeled AOD magnitudes, whereas here we do not apply any such scaling. In southern Africa, modeled monthly AOD agrees with observations within a factor of 2 for the three sites (Fig. 2a–c). The underestima-tion of AOD is found in the tropical site (Mongu) (Fig. 2a) during the boreal autumn (the fire season). The simulated AOD in the two other sites (Skukuza and Ascension Island) is generally consistent with observations in both the magnitude and seasonal trend. The simulated SSA in southern Africa ranges between 0.75 and 0.95 and generally matches the ob-served SSA magnitude and seasonal cycle in the two land sites (Mongu and Skukuza) (Fig. 3a–b). However, an over-estimation of SSA is found in the oceanic site (Ascension Island) (Fig. 3c). The reason for this overestimation of SSA and thus the underestimation of absorption AOD (AAOD) is unclear and could be due to the model not treating the ab-sorption enhancement of aged fire BC during its transport.
The simulated AOD in South America is generally consis-tent with observations within a factor of 2 (Fig. 2d–f). The seasonal variation of simulated AOD generally matches the observations. The underestimation of AOD in Alta Floresta
and Cuiaba–Miranda is most obvious in September and Oc-tober (the fire season), which may be attributed to the under-estimation of fire emissions. However, the modeled AOD is higher than the observations before the fire season for Alta Floresta and Rio Branco, which could be due to the overes-timation of fire emission in this period. The simulated SSA in South America ranges mostly between 0.87 and 0.95 and matches the observations reasonably well (Fig. 3d–f). The modeled SSA is too low during the fire season and exhibits too strong a seasonality. It implies that the model underesti-mation of scattering aerosols (e.g., POM) may be more se-vere than of BC during the fire season.
com-Y. Jiang et al.: Impacts of global open-fire aerosols 14811
Figure 4.Annual mean radiative effect due to aerosol–radiation interactions (REari) (W m−2)averaged over the period of 2003–2011 due to(a)all fire aerosols,(c)fire BC and(e)fire POM estimated with the method of BBFFBF (left panels) and with the method by Ghan (2013) (b, d, fin the right panels). The plus signs in(b, d, f)denote the regions where the radiative effect estimated with Ghan (2013) is statistically significant at the 0.05 level.
pared to MAM3, it still underestimates the surface BC con-centrations in the Arctic (Liu et al., 2016). The modeled SSA in the Arctic is lower than the observations, which implies that the simulation of AAOD is better than of AOD and the underestimation of nonabsorbing aerosols (e.g., sulfate and POM) in the Arctic may be more severe than of BC. 3.2 Radiative effect due to aerosol–radiation
interactions
The annual mean REari of all fire aerosols (including BC, POM and sulfate) estimated with the method of BBFFBF and with the method by Ghan (2013) is shown in Fig. 4a–b. The fire sulfate is not included in the calculation of REari of all fire aerosols with the method of BBFFBF. Its ef-fect is minor since the global annual mean burden of fire sulfate (0.09 mg m−2) is much smaller than of fire POM (1.25 mg m−2), but both are light scattering. The statisti-cal significance of REari estimated with the Ghan (2013) method over the interannual variability and ensemble mem-ber diversity is shown in Fig. 4 (and also later figures). The REari of all fire aerosols from the two methods agree with each other very well. Thus, we will report the REari
of all fire aerosols using the Ghan (2013) method below. The global annual mean REari of all fire aerosols is pos-itive (0.16±0.01 W m−2), which indicates a warming ef-fect from all fire aerosols. The REari is positive on the globe except in some land areas (e.g., southern Africa, South America, the Great Lakes, northern Canada and Eastern Siberia). The maximum positive REari is located in ocean ar-eas west of southern Africa (∼5.0 W m−2)and South Amer-ica (∼1.5 W m−2). Positive REari up to 1 W m−2is found in the Arctic (60 to 90◦N). The different signs of REari between
14812 Y. Jiang et al.: Impacts of global open-fire aerosols
Figure 5. (a)September–October–November (SON) mean fire aerosol radiative effects due to aerosol–radiation interactions (REari) (W m−2)
for the period of 2003–2011 over the southeast Atlantic Ocean due to all fire aerosols. Panels(b, c)are the same as(a), but for the above-cloud aerosol REari for the period of 2007–2011 estimated using Aqua/MODIS and Terra/MODIS products (Zhang et al., 2014).
A comparison of modeled REari in the boreal autumn (September–October–November) over the South Atlantic Ocean with satellite observations is shown in Fig. 5. The observed above-cloud aerosol REari is calculated with the method by Zhang et al. (2014) using the Aqua/MODIS and Terra/MODIS products. The observed above-cloud aerosol REari over southeastern Atlantic Ocean is 3–12 W m−2, with higher values near the coasts. The simulated REari agrees better with Aqua/MODIS-observed REari than with Terra/MODIS in both the magnitude and spatial pattern. REari estimated from Terra/MODIS (morning time) is stronger than REari estimated from Aqua/MODIS (after-noon time) due to the larger amount of underlying cloud in the morning (Min and Zhang, 2014). Over South Amer-ica during the fire season (August to September), the clear-sky fire aerosol REari is estimated to be −5.2 W m−2 by Sena and Artaxo (2015), which is larger than our model re-sult (−2.1 W m−2). This is consistent with the underestima-tion of modeled AOD in South America compared to the AERONET data (Fig. 2).
The seasonal variation of REari of all fire aerosols with the Ghan (2013) method is shown in Fig. S3 in the Supplement. The REari has a maximum (1.13 W m−2)in the boreal sum-mer (June–July–August, JJA) over the Arctic regions, par-tially due to the low solar zenith angles there. The maximum positive REari in the tropical regions occurs in the boreal summer and autumn (September, October and November, SON) during the fire season of southern Africa and South America. The REari reaches a positive maximum in South-east Asia during the fire season in March, April and May (MAM).
Y. Jiang et al.: Impacts of global open-fire aerosols 14813
Figure 6.Annual mean radiative effects due to aerosol–cloud inter-actions (REaci) (W m−2)averaged over the period of 2003–2011 due to(a)all fire aerosols,(b)fire BC and(c)fire POM. The plus signs denote the regions where the radiative effect is statistically significant at the 0.1 level.
clouds on fire BC positive forcing can be clearly seen in southern Africa and the adjacent Atlantic Ocean.
The global annual mean REari values of fire POM from the two methods somewhat differ from each other (Fig. 4e– f). The BBFFBF method gives a small negative value (−0.05 W m−2), while the Ghan (2013) method shows a small positive value (0.04±0.01 W m−2). The difference is mainly in the Arctic regions where the positive forcing from Ghan (2013) is larger than from the BBFFBF method. This is because the removal of fire POM emissions in the NOFIRE-POM experiment affects the properties of aerosol particles within which co-emitted fire BC is internally mixed with fire POM, causing a decrease of BC burden in the
Arc-tic (by∼0.05 mg m−2)compared to the FIRE experiment. Thus, one should be careful when using the Ghan (2013) method to diagnose the radiative forcing of a single com-ponent within co-emitted aerosols. The REari of fire POM is negative across most of the globe. However, positive forcing can be found over oceanic regions west of southern Africa and South America, the North Pacific Ocean and the Polar re-gions, where large amounts of low-level cloud, sea ice or land ice exist. The multiple scatterings between the above-cloud fire POM and low-level clouds or between the fire POM and the Earth’s bright surface with high albedos could reduce the amount of solar radiation reflected by these low-level clouds and bright surfaces in the case without the fire POM (Zhang et al., 2016). With the BBFFBF method, the sum of REari from fire POM and fire BC (i.e., 0.20 W m−2)is larger than that of all fire aerosols (0.15 W m−2). It reflects the nonlin-ear interactions among different aerosol components (Ghan et al., 2012). For example, fire POM and water on internally mixed fire BC particles enhance solar absorption by fire BC. The nonlinearity is stronger with the Ghan (2013) method. 3.3 Radiative effect due to aerosol–cloud interactions The annual mean REaci due to all fire aerosols, fire BC and fire POM are shown in Fig. 6. The REaci diagnosed with the Ghan (2013) method includes both aerosol indirect and semi-direct effects. The fire aerosol semi-semi-direct effect (to be dis-cussed below) is much smaller (−0.04±0.03 W m−2on the global mean) than the indirect effect, and the REaci is mostly from the fire aerosol indirect effect. The global annual mean REaci of all fire aerosols is−0.70±0.05 W m−2 (Fig. 6a). In the tropical regions, the strong negative REaci is located in the adjacent ocean areas of southern Africa, South Amer-ica and Australia, with the maximum REaci of−8.0 W m−2
over the South Atlantic Ocean. The strong negative REaci also occurs in the Arctic (60 to 90◦N). The REaci in Eastern
14814 Y. Jiang et al.: Impacts of global open-fire aerosols
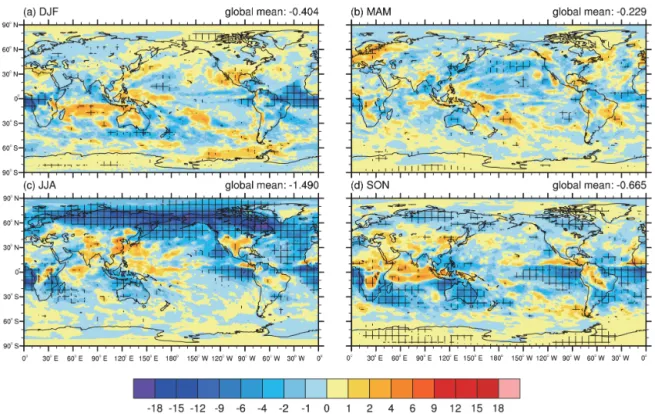
Figure 7.Seasonal variation of radiative effects of all fire aerosols due to aerosol–cloud interactions (REaci) (W m−2)for the period of 2003–2011 for(a)December–January–February (DJF),(b)March–April–May (MAM),(c)June–July–August (JJA) and(d)September– October–November (SON). The plus signs denote the regions where the radiative effect is statistically significant at the 0.05 level.
The seasonal variation of all fire aerosol REaci is shown in Fig. 7. The maximum of fire aerosol REaci is in the boreal summer (i.e., the fire season in NH), located in the NH high latitudes (60 to 90◦N). The largest summer REaci is found in
the land areas and is as large as−15 W m−2. The fire aerosol REaci in the tropical regions is most significant in the boreal summer (up to−15 W m−2)and autumn (up to−10 W m−2) over the ocean areas. The different spatial distributions of fire aerosol REaci in the NH high latitudes and in the trop-ics result from the difference in cloud distribution between the two regions. During the fire season the cloud LWP over the land areas in the NH middle and high latitudes is 3 times larger than over the ocean areas in the tropics. Larger cloud LWP favors the stronger REaci, because a larger LWP asso-ciated with warm cloud and rain processes favors the aerosol indirect effect of slowing down the autoconversion of cloud water to rain (Ghan et al., 2012; Jiang et al., 2015). Mean-while, in the NH high latitudes, the lower solar zenith angle in the boreal summer favors the stronger REaci. Like the fire aerosol REari, the smallest fire aerosol REaci occurs in the boreal spring.
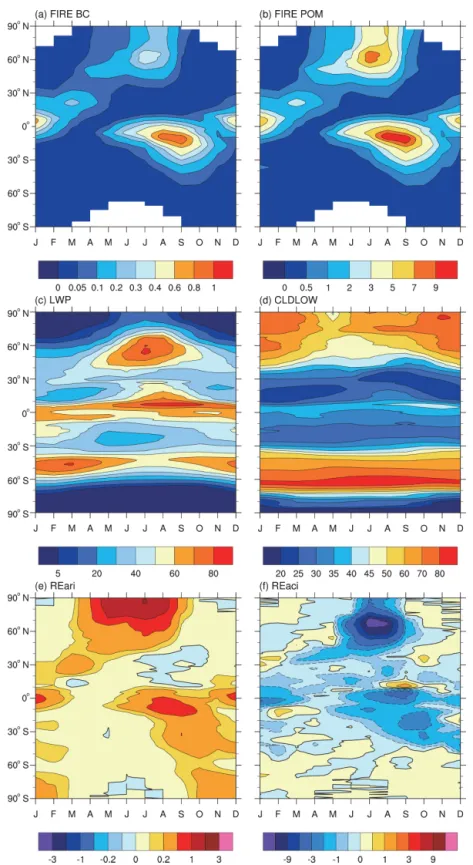
Seasonal variations of zonal mean fire aerosol REari, REaci, cloud LWP, amount of low-level (from surface to 750 hPa) cloud and vertically integrated (burden) concentra-tions of fire POM and fire BC are shown in Fig. 8. The sea-sonal variation of fire BC and fire POM burdens is largest in the SH low latitudes (from 30◦S to 0◦N) and NH
mid-dle and high latitudes (50 to 90◦N). A distinct feature of
these two areas is that the maximum fire BC burden in NH (0.3 mg m−2)is much lower than in SH (0.8 mg m−2), while the maximum POM burdens in these two areas are compa-rable. Interestingly, the REari is larger in the boreal summer in NH than in the boreal autumn in SH, although the fire BC burden is much lower in the NH summer. It is mainly due to the larger amount of low cloud in the NH high latitudes, which enhances the absorption of fire BC. The maximum REari in the NH summer is found near the North Pole (70 to 90◦N) and not around 60◦N where the fire aerosol burden
is highest. The REaci of fire aerosols is about 3 times larger in the boreal summer in NH than in the boreal autumn in SH, although the burden of fire POM in NH is comparable to that in SH. The larger cloud LWP in the NH summer around 40–70◦N favors the stronger REaci there.
3.4 Surface-albedo effect
Y. Jiang et al.: Impacts of global open-fire aerosols 14815
14816 Y. Jiang et al.: Impacts of global open-fire aerosols
40 45 50 55 60 65 70 75 80 10-1 100 101 102 103 104 Observation Fire-on Fire-off B C in top s now lay er (ng g -1) Latitude N a Obse rva tion Fire -off Fire -on Obse rva tion Fire -off Fire -on 10-1 100 101 102 103 104 b B C in top s now lay er (ng g -1) Northern China Arctic
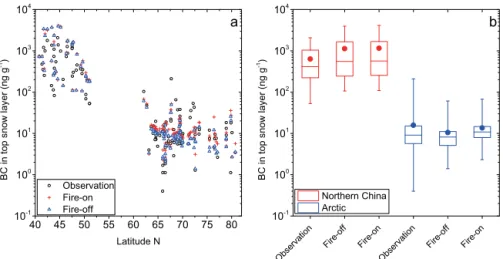
Figure 9.Evaluation of CAM5-simulated black carbon (BC) concentration for the period of 2003–2011 (in ng g−1)in the top snow layer against observations in the Arctic (Doherty et al., 2010) and northern China (Wang et al., 2013b). The top snow layer ranges in thickness from 1 to 3 cm. Configuration of the two CAM5 simulations (FIRE and NOFIRE) is summarized in Table 1. Panel(a)shows the comparisons at different latitudes. The box and whisker plot in(b)shows the minimum and maximum value with the bar, the 25th and 75th percentiles with the box, the 50th percentile (i.e., median) by the bar within the box and the mean value with the dot.
northern China. Both FIRE and NOFIRE experiments cap-ture the meridional gradient in BCS concentrations between the midlatitudes (northern China) and high latitudes (Arctic). The mean and median concentrations of BCS are both over-estimated in northern China, implying high biases from the anthropogenic emissions and/or model physics (Fig. 9b). The mean and median BCS concentrations from the FIRE exper-iment agree slightly better with the observations than those from the NOFIRE experiment in the Arctic (Fig. 9b). This suggests that fire emissions are important for BCS concen-trations in the Arctic.
The annual mean REsac of all fire aerosols estimated with Ghan (2013) and the fire BCS effect diagnosed from SNICAR are shown in Fig. 10a. We note that the radia-tive effect due to BC deposition on sea ice is not con-sidered since sea ice is prescribed in the simulations. The global annual mean REsac (0.03±0.10 W m−2) is much smaller compared to the REari and REaci. The REsac over land is maximum in spring (0.12±0.27 W m−2) and win-ter (0.06±0.16 W m−2). The REsac over land in summer and autumn is very small (less than 0.01 W m−2). We note that the mean REsac calculated from Ghan (2013) is much smaller than the standard deviation which resulted from the internal variability.
The annual mean fire BCS effect calculated from SNICAR is shown in Fig. 10b and c. The spatial distribution of the fire BCS effect is similar to the fire REsac, implying that the fire REsac has a significant contribution from the fire BCS effect. Averaged when only snow is present, the fire BCS ef-fect is larger (0.048 W m−2). The global mean fire BCS effect (with the presence of snow) can be as large as 0.06 W m−2in spring. The maximum fire BCS effect (up to 1 W m−2)is lo-cated in Greenland and the very northern reaches of Canada,
while in the other Arctic regions and northern China it is smaller.
The positive REsac in Siberia, North America and Canada can be a result of the BCS effect. However, the REsac in these regions is larger than the BCS effect especially in spring. The snow melting and snow depth change due to the BCS warming may induce a larger positive REsac than the albedo change due to BCS itself. The negative REsac over land can be a result of atmospheric feedbacks caused by fire aerosols (Ghan, 2013).
3.5 Fire aerosol effects on shortwave radiation, global temperature and precipitation
Here, we show the annual mean net shortwave flux changes at TOA (i.e., total radiative effect), in the atmosphere and at the surface as well as changes in surface air temper-ature, convective and large-scale precipitation due to all fire aerosols in Fig. 11 and Table 2. The global mean net shortwave flux change at TOA due to all fire aerosols is
Y. Jiang et al.: Impacts of global open-fire aerosols 14817
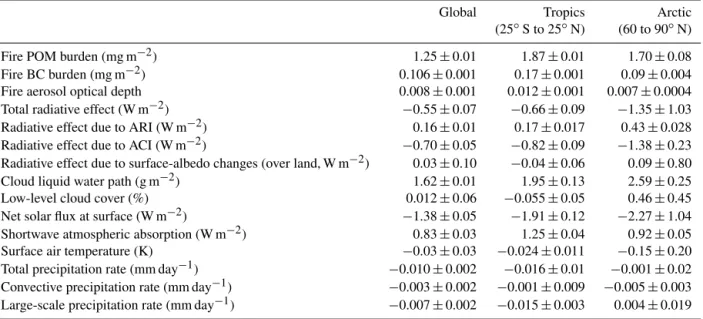
Table 2.Global, tropics (25◦S to 25◦N) and Arctic (60 to 90◦N) annual mean fire aerosol (POM and BC) burdens, fire aerosol AOD, total
fire aerosol radiative effect (RE) at TOA, radiative effects due to aerosol–radiation interactions (REari), due to aerosol–cloud interactions (REaci), surface-albedo changes (REsac) and changes in cloud liquid water path (LWP), low-level cloud cover, net solar fluxes at the surface, shortwave atmospheric absorption, surface air temperature and precipitation (total, convective and large scale) due to all fire aerosols. Standard deviations about the 10-ensemble means are included.
Global Tropics Arctic (25◦S to 25◦N) (60 to 90◦N)
Fire POM burden (mg m−2) 1.25±0.01 1.87±0.01 1.70±0.08 Fire BC burden (mg m−2) 0.106±0.001 0.17±0.001 0.09±0.004
Fire aerosol optical depth 0.008±0.001 0.012±0.001 0.007±0.0004 Total radiative effect (W m−2) −0.55±0.07 −0.66±0.09 −1.35±1.03 Radiative effect due to ARI (W m−2) 0.16±0.01 0.17±0.017 0.43±0.028 Radiative effect due to ACI (W m−2) −0.70±0.05 −0.82±0.09 −1.38±0.23
Radiative effect due to surface-albedo changes (over land, W m−2) 0.03±0.10 −0.04±0.06 0.09±0.80 Cloud liquid water path (g m−2) 1.62±0.01 1.95±0.13 2.59±0.25
Low-level cloud cover (%) 0.012±0.06 −0.055±0.05 0.46±0.45 Net solar flux at surface (W m−2) −1.38±0.05 −1.91±0.12 −2.27±1.04 Shortwave atmospheric absorption (W m−2) 0.83±0.03 1.25±0.04 0.92±0.05 Surface air temperature (K) −0.03±0.03 −0.024±0.011 −0.15±0.20 Total precipitation rate (mm day−1) −0.010±0.002 −0.016±0.01 −0.001±0.02 Convective precipitation rate (mm day−1) −0.003±0.002 −0.001±0.009 −0.005±0.003 Large-scale precipitation rate (mm day−1) −0.007±0.002 −0.015±0.003 0.004±0.019
The shortwave atmospheric absorption change in the trop-ical regions is larger than in the Arctic regions. It is because BC burden in the tropics (0.17 mg m−2)is larger than in the Arctic (0.09 mg m−2). Strong absorption (∼8 W m−2)in the atmosphere is found in the land areas of southern Africa and South America and in the southeast Atlantic. The surface shortwave flux change in the Arctic is mostly from the TOA shortwave flux reduction due to the fire aerosol REaci, while the surface shortwave flux change in the tropics is mostly due to the fire BC absorption in the atmosphere.
The fire aerosols lead to the reduction of the global mean surface air temperature (Ts)by 0.03±0.03 K, consistent with the reduction of shortwave fluxes at TOA and at the surface. The largest surface cooling is found in the Arctic and tropical regions by up to 0.6 K. The cooling of the Arctic is related to the strong fire aerosol REaci, while the cooling in the tropics is mainly from the surface shortwave flux reduction due to the fire BC absorption. TheTschange in the ocean areas is very small since the SST is prescribed in our simulations.
The global mean total precipitation is reduced by 0.010±0.002 mm day−1 due to all fire aerosols (Table 2). Unlike theTschange, the precipitation reduction in the trop-ics (0.016±0.01 mm day−1)is much larger than in the Arc-tic (0.001±0.02 mm day−1, not statistically significant). The reduction in the tropics is mainly from the large-scale pre-cipitation decrease (0.015±0.003 mm day−1). The net de-crease in convective precipitation is very small in the trop-ics (0.001±0.009 mm day−1, not statistically significant), as the convective precipitation significantly decreases near the equator and increases in the regions away from the equator,
partly consistent with the results of Tosca et al. (2013). The precipitation reduction in southern Africa is consistent with the recent findings of Hodnebrog et al. (2016). The shortwave flux reduction at the surface leads to a stabilization of the at-mospheric boundary layer and a suppression of convection near the equator. The strong atmospheric absorption by fire BC leads to the reduction of low-level clouds and large-scale precipitation in the tropics. Both effects lead to a significant reduction of total precipitation near the equator. The precip-itation decrease in the NH high latitudes is mainly from the reduction of convective precipitation. We note that the tem-perature and (especially) precipitation changes reported here do not represent the complete impact of fire aerosols, since the SSTs are fixed in our simulations. Fully coupled atmo-sphere and ocean models will be used to further investigate the impact of fire aerosols.
Figure 12 shows the changes of Ts, total precipitation, cloud LWP and low-level cloud cover in the boreal sum-mer due to all fire aerosols. The Ts is reduced by more than 1 K in most of land areas around 60◦N. The
maxi-mum cooling (larger than 1.5 K) is found in Eastern Siberia, Alaska and Canada. A decrease of total precipitation (by about 0.2 mm day−1)is found in these regions. Accompa-nying the surface cooling and precipitation reduction, a sig-nificant increase of cloud LWP and low-level cloud cover is found there. This is a result of the indirect effect of fire aerosols in the land areas of the Arctic (60 to 90◦N). The fire
con-14818 Y. Jiang et al.: Impacts of global open-fire aerosols
Figure 10. (a)Annual mean radiative effect due to surface-albedo changes (REsac, W m−2)averaged over the period of 2003–2011 of all fire aerosols over land regions, and annual mean surface effect of fire BC-in-snow calculated from SNICAR averaged(b)over all times and(c)only when snow is present. The plus signs in(a) de-note the regions where the radiative effect is statistically significant at the 0.1 level.
sistent with observed fire effects on clouds over Canada and the United States (Peng et al., 2002).
4 Discussion and conclusions
Although many studies have been conducted on the fire aerosols RE and RF (e.g., Bond et al., 2013; Myhre et al., 2013b; Ward et al., 2012; Tosca et al., 2013), the current es-timations are still associated with large uncertainties. In this study, the fire aerosol RE (including REari, REaci and RE-sac) is calculated based on a new method from Ghan (2013).
In addition, the fire aerosol REari and fire BC-in-snow ef-fect are diagnosed from an CESM experiment which tracks the open-fire BC and POM separately from fossil fuel and biofuel sources and compared with the estimates from the Ghan (2013) method.
The BC and POM burdens from open fires are largest in the tropical regions (southern Africa, South America and Southeast Asia) and in the NH middle to high latitudes (North of 45◦N) (northeast Asia, Alaska and Canada). Fire
aerosols contribute 41 and 70 % to the global burden of BC and POM, respectively. When being compared to the AERONET AOD and SSA data, modeled monthly AOD agrees with observations within a factor of 2 for most of the southern African and South American sites. The model un-derestimation of AOD is found in the South American sites near fire source regions, which is most obvious in the fire season (September and October). The model underestimates the observed AOD in the Arctic regions in both fire and non-fire seasons. The modeled SSA in southern Africa and South America is generally in agreement with observations, while the modeled SSA in the Arctic is lower.
The annual mean REari of all fire aerosols is 0.16±0.01 W m−2 and positive over most areas except in some land areas (e.g., southern Africa, northern Canada and Eastern Siberia). The annual maximum REari is found in the oceanic areas to the west of southern Africa (5 W m−2) and South America (1.5 W m−2). The positive REari over the land regions of southern Africa and South America is smaller, although the fire aerosol burdens are higher. The annual zonal mean REari in the Arctic regions can reach 0.43±0.028 W m−2 and is larger than in the tropical regions (0.17±0.017 W m−2), although the fire aerosol burden is higher in the tropics. The annual mean REari of fire BC is about 0.25±0.01 W m−2 and
posi-tive over the globe. Fire POM induces a weak negaposi-tive REari globally (−0.05 W m−2) with the BBFFBF method and a small positive value (0.04±0.01 W m−2) with the Ghan (2013) method. The positive REari of fire POM is found over oceanic areas to the west of southern Africa and South America, North Pacific and polar regions where the low-level cloud coverage is large or the surface albedo is high.
The global annual mean REaci of all fire aerosols is
−0.70±0.05 W m−2and the maximum effect is located in the ocean areas west of southern Africa and South America and land areas of the NH high latitudes. The maximum fire aerosol REaci occurs in the NH high latitudes in the boreal summer, which results from the large cloud LWP over the land areas and the low solar zenith angle. Associated with the strong indirect effects of fire aerosols in the Arctic sum-mer, significant surface cooling, precipitation reduction, and low-level cloud cover increase are found in these regions.
Y. Jiang et al.: Impacts of global open-fire aerosols 14819
Figure 11.Annual mean net shortwave flux changes (W m−2)over the period of 2003–2011(a)at top of the atmosphere,(b)in the at-mosphere,(c)at the surface and changes of(d)surface air temperature (Ts, K),(e)convective precipitation (mm d−1)and(f)large-scale precipitation (mm d−1)due to all fire aerosols. The plus signs denote the regions where the change is statistically significant at the 0.1 level.
mean and median values in the Arctic regions. The high bias of modeled BCS concentrations in northern China may not result from the fire BC because differences in BCS concen-trations between FIRE and NOFIRE experiments are very small in northern China. The global annual mean REsac is 0.03±0.10 W m−2(statistically insignificant) with the max-imum effect in spring (0.12 W m−2). The REsac is mainly due to the effect of fire BC deposit on snow (0.02 W m−2) diagnosed from SNICAR with the maximum effect as large as 0.06 W m−2(when snow is present) in spring.
The fire aerosols reduce the global mean surface air temperature (Ts) by 0.03±0.03 K and precipitation by 0.01±0.002 mm day−1. The maximum cooling (∼1 K) due to fire aerosols occurs around 60◦N in boreal summer, and a
suppression of precipitation (∼0.1 mm day−1)is also found there. The strong cooling is a result of the strong indirect
ef-fects (−15 W m−2)in the land areas of the Arctic regions (60 to 90◦N). A significant reduction of precipitation in southern
Africa is also noticed. We note that these results are based on the simulations with fixed SSTs and may not represent the full climate responses.
In our study, the global radiative effect of fire aerosols is estimated from simulations performed with the 4-mode ver-sion modal aerosol module (MAM4) (Liu et al., 2016), daily fire emissions with prescribed vertical emission profiles, and higher model resolution (0.9◦by 1.25◦) compared to earlier
14820 Y. Jiang et al.: Impacts of global open-fire aerosols
Figure 12.Changes in(a)surface air temperature (Ts, in K),(b)total precipitation (mm d−1),(c)cloud liquid water path (LWP, in g m−2) and(d)low-level cloud cover (CLDLOW, in %) due to all fire aerosols in the boreal summer (JJA) averaged for the period of 2003–2011. The plus signs denote the regions where the change is statistically significant at the 0.1 level.
however, close to 0.18 W m−2 in Tosca et al. (2013) and 0.13 W m−2 in Ward et al. (2012). The similar fire aerosol REari from our study, which has smaller fire emissions than these previous studies can result from (1) the use of MAM4 in our study, which more realistically represents the exter-nal/internal mixing of BC with other soluble aerosol species; (2) the more accurate estimation of REari of fire aerosols in the presence of low-level clouds with the method by Ghan (2013) and (3) the inclusion of vertical emissions of fire aerosols, which allows more efficient transport of fire aerosols from sources. The REaci due to fire aerosols in our study (−0.70±0.05 W m−2)is smaller than −1.64 W m−2 in Ward et al. (2012) due to the lower fire POM emissions used in this study compared to Ward et al. (2012).
We note that there are limitations and uncertainties with our study. The model still underestimates observed AODs (mostly within a factor of 2) at the sites predominantly in-fluenced by biomass burning aerosols during the fire season, which implies that the fire aerosol RE can be stronger than estimated in this study. The RE estimates of fire POM and fire BC with the Ghan (2013) approach may not be accurate due to the internal mixing of co-emitted fire components (POM and BC). In our simulations, sea ice is prescribed, thus the fire BC effect on sea ice albedo is not considered. The brown carbon component of POM (Feng et al., 2013) is not treated
in the current CESM model, which may result in an underes-timation of atmospheric absorption of fire aerosols.
5 Data availability
The fire emission data were obtained from the Global Fire Emissions Database (GFED, http://www.globalfiredata.org). The AERONET data were obtained from http://aeronet.gsfc. nasa.gov. Model outputs are available on request from the corresponding author. The source codes and model setups needed to repeat all simulations are also available upon re-quest.
The Supplement related to this article is available online at doi:10.5194/acp-16-14805-2016-supplement.
Y. Jiang et al.: Impacts of global open-fire aerosols 14821
DOE by the Battelle Memorial Institute under contract DE-AC05-76RL01830. The authors would like to acknowledge the use of computational resources (ark:/85065/d7wd3xhc) at the NCAR-Wyoming Supercomputing Center provided by the National Science Foundation and the State of Wyoming, and supported by NCAR’s Computational and Information Systems Laboratory. The fire emission data were obtained from the Global Fire Emissions Database (GFED, http://www.globalfiredata.org). The AERONET data were obtained from http://aeronet.gsfc.nasa.gov. We thank Xiangjun Shi for the help with processing the AERONET data.
Edited by: K. Tsigaridis
Reviewed by: two anonymous referees
References
Abel, S. J., Highwood, E. J., Haywood, J. M., and Stringer, M. A.: The direct radiative effect of biomass burning aerosols over southern Africa, Atmos. Chem. Phys., 5, 1999–2018, doi:10.5194/acp-5-1999-2005, 2005.
Ackerman, A. S., Toon, O. B., Stevens, D. E., Heyms-field, A. J., Ramanathan, V., and Welton, E. J.: Reduction of Tropical Cloudiness by Soot, Science, 288, 1042–1047, doi:10.1126/science.288.5468.1042, 2000.
Andreae, M. O. and Rosenfeld, D.: Aerosol–cloud– precipitation interactions. Part 1. The nature and sources of cloud-active aerosols, Earth-Sci. Rev., 89, 13–41, doi:10.1016/j.earscirev.2008.03.001, 2008.
Andreae, M. O., Rosenfeld, D., Artaxo, P., Costa, A. A., Frank, G. P., Longo, K. M., and Silva-Dias, M. A. F.: Smoking Rain Clouds over the Amazon, Science, 303, 1337–1342, doi:10.1126/science.1092779, 2004.
Bistinas, I., Harrison, S. P., Prentice, I. C., and Pereira, J. M. C.: Causal relationships versus emergent patterns in the global controls of fire frequency, Biogeosciences, 11, 5087–5101, doi:10.5194/bg-11-5087-2014, 2014.
Bond, T. C., Doherty, S. J., Fahey, D. W., Forster, P. M., Berntsen, T., DeAngelo, B. J., Flanner, M. G., Ghan, S., Karcher, B., Koch, D., Kinne, S., Kondo, Y., Quinn, P. K., Sarofim, M. C., Schultz, M. G., Schulz, M., Venkataraman, C., Zhang, H., Zhang, S., Bellouin, N., Guttikunda, S. K., Hopke, P. K., Jacobson, M. Z., Kaiser, J. W., Klimont, Z., Lohmann, U., Schwarz, J. P., Shindell, D., Storelvmo, T., Warren, S. G., and Zender, C. S.: Bounding the role of black carbon in the climate system: A sci-entific assessment, J. Geophys. Res.-Atmos., 118, 5380–5552, doi:10.1002/Jgrd.50171, 2013.
Boucher, O. and Tanré, D.: Estimation of the aerosol perturbation to the Earth’s Radiative Budget over oceans using POLDER satellite aerosol retrievals, Geophys. Res. Lett., 27, 1103–1106, doi:10.1029/1999GL010963, 2000.
Bowman, D. M. J. S., Balch, J. K., Artaxo, P., Bond, W. J., Carlson, J. M., Cochrane, M. A., D’Antonio, C. M., DeFries, R. S., Doyle, J. C., Harrison, S. P., Johnston, F. H., Keeley, J. E., Krawchuk, M. A., Kull, C. A., Marston, J. B., Moritz, M. A., Prentice, I. C., Roos, C. I., Scott, A. C., Swetnam, T. W., van der Werf, G. R., and Pyne, S. J.: Fire in the Earth System, Science, 324, 481–484, doi:10.1126/science.1163886, 2009.
Carslaw, K. S., Boucher, O., Spracklen, D. V., Mann, G. W., Rae, J. G. L., Woodward, S., and Kulmala, M.: A review of natu-ral aerosol interactions and feedbacks within the Earth system, Atmos. Chem. Phys., 10, 1701–1737, doi:10.5194/acp-10-1701-2010, 2010.
Chakrabarty, R. K., Beres, N. D., Moosmüller, H., China, S., Maz-zoleni, C., Dubey, M. K., Liu, L., and Mishchenko, M. I.: Soot superaggregates from flaming wildfires and their direct radia-tive forcing, Scientific Reports, 4, 5508, doi:10.1038/srep05508, 2014.
Ciais, P., Sabine, C., Bala, G., Bopp, L., Brovkin, V., Canadell, J., Chhabra, A., DeFries, R., Galloway, J., Heimann, M., Jones, C., Le Quéré, C., Myneni, R. B., Piao, S., and Thornton, P.: Carbon and Other Biogeochemical Cycles, in: Climate Change 2013: The Physical Science Basis. Contribution of Working Group I to the Fifth Assessment Report of the Intergovernmental Panel on Climate Change, edited by: Stocker, T. F., Qin, D., Plattner, G.-K., Tignor, M., Allen, S. G.-K., Boschung, J., Nauels, A., Xia, Y., Bex, V., and Midgley, P. M., Cambridge University Press, Cam-bridge, UK and New York, NY, USA, 465–570, 2013.
Cohen, J. B. and Wang, C.: Estimating global black carbon emis-sions using a top-down Kalman Filter approach, J. Geophys. Res.-Atmos., 119, 2013JD019912, doi:10.1002/2013JD019912, 2014.
Dentener, F., Kinne, S., Bond, T., Boucher, O., Cofala, J., Generoso, S., Ginoux, P., Gong, S., Hoelzemann, J. J., Ito, A., Marelli, L., Penner, J. E., Putaud, J.-P., Textor, C., Schulz, M., van der Werf, G. R., and Wilson, J.: Emissions of primary aerosol and precur-sor gases in the years 2000 and 1750 prescribed data-sets for Ae-roCom, Atmos. Chem. Phys., 6, 4321–4344, doi:10.5194/acp-6-4321-2006, 2006.
Doherty, S. J., Warren, S. G., Grenfell, T. C., Clarke, A. D., and Brandt, R. E.: Light-absorbing impurities in Arctic snow, Atmos. Chem. Phys., 10, 11647–11680, doi:10.5194/acp-10-11647-2010, 2010.
Feng, Y., Ramanathan, V., and Kotamarthi, V. R.: Brown carbon: a significant atmospheric absorber of solar radiation?, Atmos. Chem. Phys., 13, 8607–8621, doi:10.5194/acp-13-8607-2013, 2013.
Flanner, M. G. and Zender, C. S.: Snowpack radiative heating: Influence on Tibetan Plateau climate, Geophys. Res. Lett., 32, L06501, L06501, doi:10.1029/2004gl022076, 2005.
Flanner, M. G., Zender, C. S., Randerson, J. T., and Rasch, P. J.: Present-day climate forcing and response from black carbon in snow, J. Geophys. Res.-Atmos., 112, D11202, doi:10.1029/2006JD008003, 2007.
Flanner, M. G., Zender, C. S., Hess, P. G., Mahowald, N. M., Painter, T. H., Ramanathan, V., and Rasch, P. J.: Springtime warming and reduced snow cover from carbonaceous particles, Atmos. Chem. Phys., 9, 2481–2497, doi:10.5194/acp-9-2481-2009, 2009.
Av-14822 Y. Jiang et al.: Impacts of global open-fire aerosols
eryt, K. B., Tignor, M., and Miller, H. L., Cambridge University Press, Cambridge, UK and New York, NY, USA, 2007. Ghan, S. J.: Technical Note: Estimating aerosol effects on
cloud radiative forcing, Atmos. Chem. Phys., 13, 9971–9974, doi:10.5194/acp-13-9971-2013, 2013.
Ghan, S. J., Liu, X., Easter, R. C., Zaveri, R., Rasch, P. J., Yoon, J.-H., and Eaton, B.: Toward a Minimal Representation of Aerosols in Climate Models: Comparative Decomposition of Aerosol Di-rect, SemidiDi-rect, and Indirect Radiative Forcing, J. Climate, 25, 6461–6476, doi:10.1175/JCLI-D-11-00650.1, 2012.
Giglio, L., Randerson, J. T., and van der Werf, G. R.: Analy-sis of daily, monthly, and annual burned area using the fourth-generation global fire emissions database (GFED4), J. Geophys. Res.-Biogeo., 118, 317–328, doi:10.1002/jgrg.20042, 2013. Hansen, J., Sato, M., Ruedy, R., Nazarenko, L., Lacis, A., Schmidt,
G. A., Russell, G., Aleinov, I., Bauer, M., Bauer, S., Bell, N., Cairns, B., Canuto, V., Chandler, M., Cheng, Y., Del Genio, A., Faluvegi, G., Fleming, E., Friend, A., Hall, T., Jackman, C., Kel-ley, M., Kiang, N., Koch, D., Lean, J., Lerner, J., Lo, K., Menon, S., Miller, R., Minnis, P., Novakov, T., Oinas, V., Perlwitz, J., Perlwitz, J., Rind, D., Romanou, A., Shindell, D., Stone, P., Sun, S., Tausnev, N., Thresher, D., Wielicki, B., Wong, T., Yao, M., and Zhang, S.: Efficacy of climate forcings, J. Geophys. Res.-Atmos., 110, D18104, doi:10.1029/2005JD005776, 2005. Heald, C. L., Ridley, D. A., Kroll, J. H., Barrett, S. R. H.,
Cady-Pereira, K. E., Alvarado, M. J., and Holmes, C. D.: Contrasting the direct radiative effect and direct radiative forcing of aerosols, Atmos. Chem. Phys., 14, 5513–5527, doi:10.5194/acp-14-5513-2014, 2014.
Hodnebrog, Ø., Myhre, G., Forster, P. M., Sillmann, J., and Sam-set, B. H.: Local biomass burning is a dominant cause of the ob-served precipitation reduction in southern Africa, Nat. Commun., 7, 11236, doi:10.1038/ncomms11236, 2016.
Jacobson, M. Z.: Climate response of fossil fuel and biofuel soot, accounting for soot’s feedback to snow and sea ice albedo and emissivity, J. Geophys. Res.-Atmos., 109, D21201, doi:10.1029/2004JD004945, 2004.
Jiang, Y., Liu, X., Yang, X.-Q., and Wang, M.: A numerical study of the effect of different aerosol types on East Asian summer clouds and precipitation, Atmos. Environ., 70, 51–63, doi:10.1016/j.atmosenv.2012.12.039, 2013.
Jiang, Y., Yang, X.-Q., and Liu, X.: Seasonality in anthro-pogenic aerosol effects on East Asian climate simulated with CAM5, J. Geophys. Res.-Atmos., 120, 2015JD023451, doi:10.1002/2015JD023451, 2015.
Jones, A., Haywood, J. M., and Boucher, O.: Aerosol forcing, climate response and climate sensitivity in the Hadley Cen-tre climate model, J. Geophys. Res.-Atmos., 112, D20211, doi:10.1029/2007JD008688, 2007.
Kaiser, J. W., Heil, A., Andreae, M. O., Benedetti, A., Chubarova, N., Jones, L., Morcrette, J.-J., Razinger, M., Schultz, M. G., Suttie, M., and van der Werf, G. R.: Biomass burning emis-sions estimated with a global fire assimilation system based on observed fire radiative power, Biogeosciences, 9, 527–554, doi:10.5194/bg-9-527-2012, 2012.
Keywood, M., Kanakidou, M., Stohl, A., Dentener, F., Grassi, G., Meyer, C. P., Torseth, K., Edwards, D., Thompson, A. M., Lohmann, U., and Burrows, J.: Fire in the Air: Biomass
Burn-ing Impacts in a ChangBurn-ing Climate, Crit. Rev. Env. Sci. Tec., 43, 40–83, doi:10.1080/10643389.2011.604248, 2011.
Koch, D. and Del Genio, A. D.: Black carbon semi-direct effects on cloud cover: review and synthesis, Atmos. Chem. Phys., 10, 7685–7696, doi:10.5194/acp-10-7685-2010, 2010.
Koch, D., Menon, S., Del Genio, A., Ruedy, R., Alienov, I., and Schmidt, G. A.: Distinguishing Aerosol Impacts on Cli-mate over the Past Century, J. CliCli-mate, 22, 2659–2677, doi:10.1175/2008JCLI2573.1, 2009.
Koch, D., Balkanski, Y., Bauer, S. E., Easter, R. C., Ferrachat, S., Ghan, S. J., Hoose, C., Iversen, T., Kirkevåg, A., Kristjansson, J. E., Liu, X., Lohmann, U., Menon, S., Quaas, J., Schulz, M., Se-land, Ø., Takemura, T., and Yan, N.: Soot microphysical effects on liquid clouds, a multi-model investigation, Atmos. Chem. Phys., 11, 1051–1064, doi:10.5194/acp-11-1051-2011, 2011. Koren, I., Kaufman, Y. J., Rosenfeld, D., Remer, L. A., and
Rudich, Y.: Aerosol invigoration and restructuring of At-lantic convective clouds, Geophys. Res. Lett., 32, L14828, doi:10.1029/2005GL023187, 2005.
Lamarque, J.-F., Bond, T. C., Eyring, V., Granier, C., Heil, A., Klimont, Z., Lee, D., Liousse, C., Mieville, A., Owen, B., Schultz, M. G., Shindell, D., Smith, S. J., Stehfest, E., Van Aar-denne, J., Cooper, O. R., Kainuma, M., Mahowald, N., Mc-Connell, J. R., Naik, V., Riahi, K., and van Vuuren, D. P.: His-torical (1850–2000) gridded anthropogenic and biomass burning emissions of reactive gases and aerosols: methodology and ap-plication, Atmos. Chem. Phys., 10, 7017–7039, doi:10.5194/acp-10-7017-2010, 2010.
Liu, X., Penner, J. E., Das, B., Bergmann, D., Rodriguez, J. M., Stra-han, S., Wang, M., and Feng, Y.: Uncertainties in global aerosol simulations: Assessment using three meteorological datasets, J. Geophys. Res., 112, D11212, doi:10.1029/2006JD008216, 2007. Liu, X., Easter, R. C., Ghan, S. J., Zaveri, R., Rasch, P., Shi, X., Lamarque, J.-F., Gettelman, A., Morrison, H., Vitt, F., Conley, A., Park, S., Neale, R., Hannay, C., Ekman, A. M. L., Hess, P., Mahowald, N., Collins, W., Iacono, M. J., Bretherton, C. S., Flan-ner, M. G., and Mitchell, D.: Toward a minimal representation of aerosols in climate models: description and evaluation in the Community Atmosphere Model CAM5, Geosci. Model Dev., 5, 709–739, doi:10.5194/gmd-5-709-2012, 2012.
Liu, X., Ma, P.-L., Wang, H., Tilmes, S., Singh, B., Easter, R. C., Ghan, S. J., and Rasch, P. J.: Description and evaluation of a new four-mode version of the Modal Aerosol Module (MAM4) within version 5.3 of the Community Atmosphere Model, Geosci. Model Dev., 9, 505–522, doi:10.5194/gmd-9-505-2016, 2016.
Liu, Y.: Atmospheric response and feedback to radiative forcing from biomass burning in tropical South America, Agr. For-est Meteorol., 133, 40–53, doi:10.1016/j.agrformet.2005.03.011, 2005.
Liu, Y., Goodrick, S., and Heilman, W.: Wildland fire emissions, carbon, and climate: Wildfire–climate interactions, Forest Ecol. Manage., 317, 80–96, doi:10.1016/j.foreco.2013.02.020, 2014. Lu, Z. and Sokolik, I. N.: The effect of smoke emission amount
Y. Jiang et al.: Impacts of global open-fire aerosols 14823
Ma, P.-L., Rasch, P. J., Wang, H., Zhang, K., Easter, R. C., Tilmes, S., Fast, J. D., Liu, X., Yoon, J.-H., and Lamarque, J.-F.: The role of circulation features on black carbon transport into the Arc-tic in the Community Atmosphere Model version 5 (CAM5), J. Geophys. Res.-Atmos., 118, 4657–4669, 2013.
Ma, P.-L., Rasch, P. J., Fast, J. D., Easter, R. C., Gustafson Jr., W. I., Liu, X., Ghan, S. J., and Singh, B.: Assessing the CAM5 physics suite in the WRF-Chem model: implementation, resolution sen-sitivity, and a first evaluation for a regional case study, Geosci. Model Dev., 7, 755–778, doi:10.5194/gmd-7-755-2014, 2014. Ma, P.-L., Rasch, P. J., Wang, M., Wang, H., Ghan, S. J., Easter, R.
C., Gustafson Jr., W. I., Liu, X., Zhang, Y., and Ma, H.-Y.: How does increasing horizontal resolution in a global climate model improve the simulation of aerosol-cloud interactions?, Geophys. Res. Lett., 42, 5058–5065, doi:10.1002/2015GL064183, 2015. Marlon, J. R., Bartlein, P. J., Walsh, M. K., Harrison, S. P., Brown,
K. J., Edwards, M. E., Higuera, P. E., Power, M. J., Ander-son, R. S., Briles, C., Brunelle, A., Carcaillet, C., Daniels, M., Hu, F. S., Lavoie, M., Long, C., Minckley, T., Richard, P. J. H., Scott, A. C., Shafer, D. S., Tinner, W., Umbanhowar, C. E., and Whitlock, C.: Wildfire responses to abrupt climate change in North America, P. Natl. Acad. Sci., 106, 2519–2524, doi:10.1073/pnas.0808212106, 2009.
Min M. and Zhang Z.: On the influence of cloud fraction diurnal cycle and sub-grid cloud optical thickness variability on all-sky direct aerosol radiative forcing, J. Quant. Spectros. Ra., 142, 25– 36, doi:10.1016/j.jqsrt.2014.03.014, 2014.
Morrison, H. and Gettelman, A.: A New Two-Moment Bulk Stratiform Cloud Microphysics Scheme in the Commu-nity Atmosphere Model, Version 3 (CAM3). Part I: De-scription and Numerical Tests, J. Climate, 21, 3642–3659, doi:10.1175/2008JCLI2105.1, 2008.
Myhre, G. and Samset, B. H.: Standard climate models radia-tion codes underestimate black carbon radiative forcing, Atmos. Chem. Phys., 15, 2883–2888, doi:10.5194/acp-15-2883-2015, 2015.
Myhre, G., Samset, B. H., Schulz, M., Balkanski, Y., Bauer, S., Berntsen, T. K., Bian, H., Bellouin, N., Chin, M., Diehl, T., Easter, R. C., Feichter, J., Ghan, S. J., Hauglustaine, D., Iversen, T., Kinne, S., Kirkevåg, A., Lamarque, J.-F., Lin, G., Liu, X., Lund, M. T., Luo, G., Ma, X., van Noije, T., Penner, J. E., Rasch, P. J., Ruiz, A., Seland, Ø., Skeie, R. B., Stier, P., Takemura, T., Tsigaridis, K., Wang, P., Wang, Z., Xu, L., Yu, H., Yu, F., Yoon, J.-H., Zhang, K., Zhang, H., and Zhou, C.: Radiative forcing of the direct aerosol effect from AeroCom Phase II simulations, Atmos. Chem. Phys., 13, 1853–1877, doi:10.5194/acp-13-1853-2013, 2013a.
Myhre, G., Shindell, D., Breìon, F.-M., Collins, W., Fuglestvedt, J., Huang, J., Koch, D., Lamarque, J.-F., Lee, D., Mendoza, B., Nakajima, T., Robock, A., Stephens, G., Takemura, T., and Zhang, H.: Anthropogenic and Natural Radiative Forcing, in: Climate Change 2013: The Physical Science Basis. Contribution of Working Group I to the Fifth Assessment Report of the Inter-governmental Panel on Climate Change, edited by: Stocker, T. F., Qin, D., Plattner, G.-K., Tignor, M., Allen, S. K., Boschung, J., Nauels, A., Xia, Y., Bex, V., and Midgley, P. M., Cambridge University Press, Cambridge, United Kingdom and New York, NY, USA, 659–740, 2013b.
Neale, R. B., Chen, C.-C., Gettelman, A., Lauritzen, P. H., Park, S., Williamson, D. L., Conley, A. J., Garcia, R., Kin-nison, D., Lamarque, J.-F., Marsh, D., Mills, M., Smith, A. K., Tilmes, S., Vitt, F., Cameron-Smith, P., Collins,W. D., Iacono, M. J., Easter, R. C., Ghan, S. J., Liu, X., Rasch, P. J., and Taylor, M. A.: Description of the NCAR Community Atmosphere Model (CAM 5.0), NCAR/TN-486+
STR, available at: http://www.cesm.ucar.edu/models/cesm1.0/ cam/docs/description/cam5_desc.pdf (last access: 28 November 2016), 2012.
Oleson, K. W., Lawrence, D. M., Bonan, G. B., Flanner, M. G., Kluzek, E., Lawrence, P. J., Levis, S., Swenson, S. C., Thorn-ton, P. E., Dai, A., Decker, M., DIckinson, R., Feddema, J., Heald, C. L., Hoffman, F., Lamarque, J. F., Mahowald, N., Niu, G.-Y., Qian, T., Randerson, J., Running, S., Sakaguchi, K., Slater, A., Stockli, R., Wang, A., Yang, Z.-L., Zeng, X., and Zeng, X.: Technical description of version 4.0 of the Com-munity Land Model, NCAR Tech. Note NCAR/TN-478+STR, doi:10.5065/D6FB50WZ, 2010.
Peng, Y., Lohmann, U., Leaitch, R., Banic, C., and Cou-ture, M.: The cloud albedo-cloud droplet effective radius re-lationship for clean and polluted clouds from RACE and FIRE.ACE, J. Geophys. Res.-Atmos., 107, AAC 1-1–AAC 1-6, doi:10.1029/2000JD000281, 2002.
Qian, Y., Gong, D., Fan, J., Leung, L. R., Bennartz, R., Chen, D., and Wang, W.: Heavy pollution suppresses light rain in China: Observations and modeling, J. Geophys. Res.-Atmos., 114, D00K02, doi:10.1029/2008JD011575, 2009.
Qian, Y., Flanner, M. G., Leung, L. R., and Wang, W.: Sensitiv-ity studies on the impacts of Tibetan Plateau snowpack pollu-tion on the Asian hydrological cycle and monsoon climate, At-mos. Chem. Phys., 11, 1929–1948, doi:10.5194/acp-11-1929-2011, 2011.
Qian, Y., Wang, H., Zhang, R., Flanner, M. G., and Rasch, P. J.: A sensitivity study on modeling black carbon in snow and its radiative forcing over the Arctic and Northern China, Environ. Res. Lett., 9, 064001, doi:10.1088/1748-9326/9/6/064001, 2014. Qian, Y., Yasunari, T. J., Doherty, S. J., Flanner, M. G., Lau, W. K. M., Ming, J., Wang, H., Wang, M., Warren, S. G., and Zhang, R.: Light-absorbing particles in snow and ice: Measurement and modeling of climatic and hydrological impact, Adv. Atmos. Sci., 32, 64–91, doi:10.1007/s00376-014-0010-0, 2015.
Quinn, P. K., Bates, T. S., Baum, E., Doubleday, N., Fiore, A. M., Flanner, M., Fridlind, A., Garrett, T. J., Koch, D., Menon, S., Shindell, D., Stohl, A., and Warren, S. G.: Short-lived pollu-tants in the Arctic: their climate impact and possible mitigation strategies, Atmos. Chem. Phys., 8, 1723–1735, doi:10.5194/acp-8-1723-2008, 2008.
Randerson, J. T., Liu, H., Flanner, M. G., Chambers, S. D., Jin, Y., Hess, P. G., Pfister, G., Mack, M. C., Treseder, K. K., Welp, L. R., Chapin, F. S., Harden, J. W., Goulden, M. L., Lyons, E., Neff, J. C., Schuur, E. A. G., and Zender, C. S.: The Impact of Bo-real Forest Fire on Climate Warming, Science, 314, 1130–1132, 2006.