www.atmos-chem-phys.net/14/6103/2014/ doi:10.5194/acp-14-6103-2014
© Author(s) 2014. CC Attribution 3.0 License.
Effect of water vapor on the determination of aerosol direct
radiative effect based on the AERONET fluxes
J. Huttunen1,2, A. Arola1, G. Myhre3, A. V. Lindfors1, T. Mielonen1, S. Mikkonen2, J. S. Schafer4, S. N. Tripathi5, M. Wild6, M. Komppula1, and K. E. J. Lehtinen1,2
1Finnish Meteorological Institute, Kuopio, Finland
2Department of Applied Physics, University of Eastern Finland, Kuopio, Finland
3Center for International Climate and Environmental Research – Oslo (CICERO), Oslo, Norway 4NASA/Goddard Space Flight Center (GSFC), Biospheric Sciences Branch, Greenbelt, MD, USA 5Department of Civil Engineering, Indian Institute of Technology, Kanpur, India
6Institute for Atmospheric and Climate Science, ETH Zurich, Switzerland
Correspondence to:J. Huttunen ([email protected])
Received: 24 October 2013 – Published in Atmos. Chem. Phys. Discuss.: 10 January 2014 Revised: 14 May 2014 – Accepted: 16 May 2014 – Published: 20 June 2014
Abstract.The aerosol direct radiative effect (ADRE) is de-fined as the change in the solar radiation flux, F, due to
aerosol scattering and absorption. The difficulty in deter-mining ADRE stems mainly from the need to estimate F
without aerosols, F0, with either radiative transfer
model-ing and knowledge of the atmospheric state, or regression analysis of radiation data down to zero aerosol optical depth (AOD), if onlyF and AOD are observed. This paper
exam-ines the regression analysis method by using modeled sur-face data products provided by the Aerosol Robotic Net-work (AERONET). We extrapolated F0 by two functions:
a straight linear line and an exponential nonlinear decay. The exponential decay regression is expected to give a better es-timation of ADRE with a few percent larger extrapolatedF0
than the linear regression. We found that, contrary to the ex-pectation, in most cases the linear regression gives better re-sults than the nonlinear. In such cases the extrapolated F0
represents an unrealistically low water vapor column (WVC), resulting in underestimation of attenuation caused by the wa-ter vapor, and hence too largeF0and overestimation of the
magnitude of ADRE. The nonlinear ADRE is generally 40– 50 % larger in magnitude than the linear ADRE due to the extrapolatedF0difference. Since for a majority of locations,
AOD and WVC have a positive correlation, the extrapolated
F0 with the nonlinear regression fit represents an
unrealis-tically low WVC, and hence too large F0. The systematic
underestimation ofF0with the linear regression is
compen-sated by the positive correlation between AOD and water va-por, providing the better result.
1 Introduction
Significant uncertainties exist in the current estimates of aerosol effects on climate (IPCC, 2013). This holds also for the aerosol direct radiative effect (ADRE) and aerosol direct radiative forcing (ADRF). The ADRE defines the attenuation of the (cloud-free sky) surface solar radiation flux (F) due to
straight line into surface solar flux and AOD observations. A linear dependence between aerosol attenuation and AOD has been commonly assumed when estimating ADRE (e.g., Kaufman et al., 2002; Bush and Valero, 2002, 2003; Dumka et al., 2006; Roger et al., 2006; di Sarra et al., 2008; Gar-cia et al., 2009; Satheesh et al., 2010). Typical attenuation of radiation intensity, however, implies nonlinear decay, as con-sidered by for example Conant et al. (2003), Markowicz et al. (2008) and Kudo et al. (2010). Thus, a linear fit toF and
AOD data may result in an incorrect extrapolation ofF0.
The aim of this paper is to examine the uncertainties in-volved in estimating ADRE, both using the linear fitting method and a nonlinear approach if F and AOD data are
available from surface or satellite measurements. For this, we use Aerosol Robotic Network (AERONET) products (http: //aeronet.gsfc.nasa.gov/) from all available AERONET sta-tions, which cover different aerosol types and surface re-flectance properties and provide modeled surface solar ra-diation fluxes also. We conducted our analysis using these modeled fluxes since they represent realistically enough the aerosol-induced relative changes inF and furthermore give
an estimate for F0, which is self-consistent within the
se-lected F (AOD) data set. As AERONET provides an
esti-mation ofF0, we can compare the estimations immediately
with the baseline (AERONET). Special attention is paid to the possible effect of water vapor on estimating ADRE.
2 Methods and data
AERONET is a ground-based remote-sensing global net-work of Cimel sun photometers (Holben et al., 1998) in-cluding the AERONET inversion code with radiative trans-fer code implementation. The inversion strategy, described in Dubovik and King (2000), provides a group of parameters, e.g., AOD, Ångström exponent (AE) and water vapor column (WVC) from the sun measurements and, for example, SSA, asymmetry parameter (ASYM) and size distribution from the sky measurements. AOD is provided with wavelength channels 340, 380, 440, 500, 670, 870, 1020 and 1640 nm (all or some of these, depending on site of AERONET), WVC from 940 nm and, for example, SSA and ASYM from 440, 670, 870 and 1020 nm. The discrete ordinates method provides broadband fluxes (both at the top of atmosphere and at the surface, with and without aerosols), calculated with the correlated-kdistribution in the Global Atmospheric
Model (GAME) code from 200 to 4000 nm. The ozone is based on monthly averaged climatology by the Total Ozone Mapping Spectrometer (TOMS). Moreover, the US standard 1976 atmosphere model sets the atmospheric gaseous pro-file. The surface reflectivity is approximated by the bidirec-tional reflectance distribution function (BRDF) and obser-vations from the Moderate-Resolution Imaging Spectrora-diometer (MODIS). More details about the AERONET de-scription from, for example, García et al. (2012). The
un-certainty of AOD is 0.01–0.02 depending on the wavelength (Eck et al., 1999), the uncertainty in SSA approximately 0.03 (Dubovik et al., 2000), and the uncertainty in WVC of 12 % (Holben et al., 1998). We used broadband modeled sur-face shortwave fluxes from this data set. In this study, level 1.5 sky AERONET data are divided into groups by station, season (December–February, March–May, June–August and September–November) and by solar zenith angle (SZA) (3◦ steps in the range 0–80◦). A data set was included in the anal-ysis if it had at least 20 observations and the data contained AOD 550 nm values above 0.3 and below 0.1. We chose to use level 1.5 data because using level 2.0 would leave out all quality-assured data with AOD 440 nm < 0.4 (including, for example, quality assured SSA andF calculations). The
drawback of this choice is that, at these low values of AOD, there are significant uncertainties in the optical properties re-trieved. This is especially true for SSA, which is an important parameter. Thus, we applied all other level 2 criteria except for AOD (and SZA) limit, in order to enhance the accuracy of the data set selected. Moreover, we have imposed an addi-tional data flagging criterion, removing those SSA points at the AOD 440 nm < 0.4, which are outside the average SSA±
standard deviation, defined for the AOD 440 nm > 0.4. ADRE at the surface is the difference between the solar flux with and without aerosols: ADRE =1F =Faer−F0
(Faer is flux with aerosols).The major challenge obviously
is the determination of F0. The methodology for its
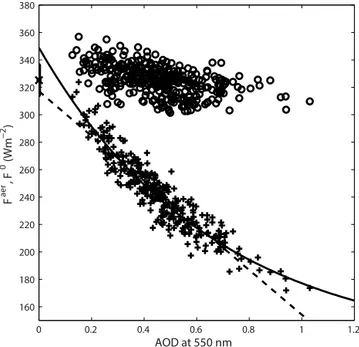
esti-mation employed in this study is illustrated in Fig. 1, in whichFaer(+symbols) is plotted as a function of AOD (from
now on 550 nm) for the AERONET site in Kanpur sta-tion (26◦N, 80◦E) for the spring months March–May with SZA=69◦±1.5◦(Faervalues were normalized for the
av-erage Earth–Sun distance and cosine correction ofFaerwas
done within SZA ranges to its midpoints).F0represents the
case AOD=0, but with measurements only at AOD above
ca. 0.15, we have to extrapolate down to 0. In Fig. 1 we show two such extrapolations: a linear fit (dashed line) and a non-linear decay fit (solid line) with the data.
We chose this data subset since it represent a case in which theFaer and AOD data exhibit the natural nonlinear
behavior of radiation intensity decay. Thus the resulting in-tercepts of the two curves at AOD=0 are quite different:
317 Wm−2 with linear extrapolation and 349 Wm−2 with nonlinear regression, with a difference of 32 Wm−2when es-timating ADRE. Also, for eachFaerwe show the
correspond-ing AERONETF0(circles), based on the retrieved WVC and
surface albedo, and calculated with a radiative transfer model (e.g., Garcia et al., 2008; Derimian et al., 2008). We use the ADRE obtained by averaging theseF0(circles) values (bar
atF=325 Wm−2 on they axis) as the benchmark against
0 0.2 0.4 0.6 0.8 1 1.2 160
180 200 220 240 260 280 300 320 340 360 380
AOD at 550 nm
F
aer
, F
0 (Wm
−2
)
Figure 1.Radiative flux with aerosolsFaer(plusses) and without
aerosolsF0(circles) as a function of AOD for the AERONET site
in Kanpur in March–May and with SZA=69◦±1.5◦. The bar on
the vertical axis represents the mean value of the estimatedF0(all
circles). The solid and dashed lines represent the exponential and linear fits to the data, respectively.
Mathematically, our analysis can be summed up as a com-parison between the extrapolated ADRE
ADREextrapol=1
n X
Fiaer−Fextrapol0 (1)
and the AERONET ADRE ADREAERONET=1
n X
Fiaer−1
n X
Fi0, (2)
whereFiaerandFi0areFaerandF0, respectively, withi
vary-ing from one to the number of data set,n. Notably, the
ex-trapolatedF0(Fextrapol0 )derived with fits represents a single
value for a data set, but in the AERONET,F0is determined
side by side with each Faer.Fextrapol0 is calculated using fits
as follows:
Finonlin=x1+x2∗exp(−x3∗AODi);
Fextrapol0,nonlin=x1+x2, (3) Filin=x′1+x2′∗AODi;Fextrapol0,lin =x1′, (4)
whereFinonlin andFilin are estimatedFaerderived for each
AOD with the nonlinear and linear method, respectively. Constants of fits arex1,x2,x3,x1′ andx2′.Fi0,nonlinandFi0,lin,
thus Fextrapol0 of the nonlinear and linear fits, are provided
with the constants.
Our decision to use the modeledF from AERONET,
in-stead of pyranometer measurements, was based on two dif-ferent aspects. First, this allowed us to include a multiple number of sites, with very different and varying aerosol con-ditions. Second, AERONET data provided interesting an-cillary measurements to support and better understand our analysis, WVC being the most crucial one. In addition, the AERONETF’s agree with pyranometer measurements with
a correlation better than 99 %, and the relative difference varies from 0.98 to 1.02 (Garcia et al., 2008). Moreover, we tested the analysis at two sites – Alta Floresta and Goddard Space Flight Center (GSFC) – by using pyranometer mea-sured fluxes F and found no significant difference of the
results at these two sites, if compared to the corresponding analysis using the AERONET-modeled fluxes instead (see Supplement Sect. S1).
3 Results
As further examples of determining ADRE using regres-sion analysis, we showFaer and AOD data from four sites
in Fig. 2. In addition, the linear (dashed line) and nonlin-ear decay (solid line) fits to the data are shown. The bar on the vertical axis represents the average (with SD) value for F0. GSFC (39◦N, 77◦W) (SZA=70◦) (Fig. 2a) and
Rio Branco (10◦S, 68◦W) (SZA=70◦) (Fig. 2b) represent cases in which the data are of sufficient quality for estimat-ing ADRE: AOD values reach close zero with only minor changes in WVC, aerosol optical properties and surface re-flectance for a given AOD, resulting in a narrow spread in the data. In these cases, since the nonlinear decay represents a more realistic decay of radiation intensity (based on squared values of residuals), the intersection of the nonlinear fit with the AOD=0 axis (y axis) is within the SD of the baseline
value. Dhadnah (26◦N, 56◦E) (SZA=70◦) (Fig. 2c) and GSFC at SZA=22◦ (Fig. 2d) are examples of more
chal-lenging cases: in Fig. 2c only data points with AOD > 0.2 exist so that a more extensive extrapolation is needed, and in Fig. 2d there is significant scatter in the points.
Perhaps the most interesting feature shown in Fig. 2, which also significantly affects the quality of ADRE estimation, is the correlation ofF0with AOD. In Fig. 2a–d there is a
neg-ative correlation while in Fig. 2b the correlation is positive. The negative correlation betweenF0and AOD is indirectly
caused mainly by a positive correlation of AOD with WVC due to humid air masses with large aerosol concentration. Only in some cases, where air masses are dominated by dust aerosols, the correlation is negative. With increasing AOD and WVC, the WVC dims an increasing fraction of the radi-ation intensity – resulting in a smallerF0. The opposite
0 0.1 0.2 0.3 0.4 0.5 0.6 0.7 0.8 0.9 1 180
200 220 240 260 280 300 320 340
AOD at 550 nm
F
aer
, F
0 (W
m
−2
)
0 0.1 0.2 0.3 0.4 0.5 0.6 0.7 0.8 0.9 1
180 200 220 240 260 280 300 320 340
AOD at 550 nm
F
aer
, F
0 (W
m
−2
)
0 0.1 0.2 0.3 0.4 0.5 0.6 0.7 0.8 0.9 1
180 200 220 240 260 280 300 320 340
AOD at 550 nm
F
aer
, F
0 (Wm
−2
)
0 0.1 0.2 0.3 0.4 0.5 0.6 0.7 0.8 0.9 1
800 850 900 950 1000 1050
AOD at 550 nm
F
aer
, F
0 (Wm
−2
)
a) b)
c) d)
Figure 2.Same as Fig. 1, but for the June–August season in(a)GSFC (SZA=70◦),(b)Rio Branco (SZA=70◦),(c)Dhadnah (SZA=70◦),
and(d)GSFC (SZA=22◦).
a large variance in atmospheric conditions of aerosol proper-ties and air humidity during seasons.
The intersections of the nonlinear decay fits (solid lines in Fig. 2) with the AOD=0 axis – 313.5 W m−2
(Fig. 2a), 295.9 W m−2 (Fig. 2b), 327.4 W m−2 (Fig. 2c) and 1008.9 W m−2 (Fig. 2d) – approximate the F0 value at AOD=0. This is clear from the figure, if one imagines
straight line fits through the circles and extrapolates fits down to AOD=0. This approximation is, however, not
necessar-ily a good one for the mean F0, if F0 and AOD correlate
(through the AOD–WVC correlation). For the negative cor-relation cases (Fig. 2a–d), the intersections of the nonlin-ear decay fits with the AOD=0 axis tend to therefore
over-estimate the mean baseline F0 (307.3 W m−2 for Fig. 2a,
312.9 W m−2 for Fig. 2c, and 972.1 W m−2 for Fig. 2d) – as the majority ofF0values are below the extrapolatedF0.
Typically, for the positive correlation cases (Fig. 2b, mean of F0=303.4 W m−2) the opposite occurs. As the linear
fit obviously results in a lower estimation of F0, the
lin-ear regression method can result often in a better estima-tion of the meanF0, as is clearly the case in Fig. 2c (mean F0=306.7 W m−2)and Fig. 2d (meanF0=973.0 W m−2)
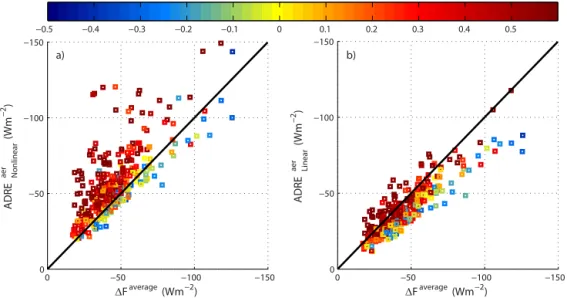
– even if the nonlinear regression is physically more correct. The performance of the two different regression methods and, in particular, the WVC and AOD correlation effect on the performance is illustrated as scatterplots in Fig. 3. In Fig. 3a all data are presented in ADRE (nonlinear decay
method) and ADRE (AERONET 1Faverage, Eq. 2) form.
The color of the single points indicates the correlation of the WVC and AOD. In Fig. 3b the same is shown for the linear regression case. Evidently, a majority of the cases are such that WVC and AOD have a strong positive correlation (red colored points). In addition, it seems that, for most of these cases, the linear regression method (Fig. 3b) results in a better ADRE estimation than the nonlinear decay regression method (Fig. 3a). This means that the inaccuracy inherent in the linear regression cancels out errors caused by the WVC and AOD correlation. For a weak WVC and AOD correla-tion, the nonlinear decay method appears to be clearly bet-ter. Other parameters such as surface albedo, ASYM or SSA do not play as crucial of a role as WVC. We classified the ADRE estimates of the both methods against the baseline in respect of AOD, albedo, ASYM, SSA and WVC. It was evi-dent that only WVC can explain the observed differences of both methods when compared against the baseline (see Sup-plement Sect. S2). Moreover, we confirmed, by modeling a short wavelength range (310–500 nm), that this WVC effect vanishes, if some other wavelength band as for example the visible range of 400–700 nm containing no significant water vapor absorption is under consideration, instead of the broad-band wavelength range ofFaer(see Supplement Sect. S3).
−150 −100
−50 0
−150
−100
−50
0
∆Faverage (Wm−2)
ADRE
aer Nonlinear
(Wm
−2
)
−0.5 −0.4 −0.3 −0.2 −0.1 0 0.1 0.2 0.3 0.4 0.5
−150 −100
−50 0
−150
−100
−50
0
∆Faverage (Wm−2)
ADRE
aer Linear
(Wm
−2
)
a) b)
Figure 3.ADRE predicted with exponential decay(a)and linear(b)regression methods (Eq. 1), compared with AERONET values (Eq. 2).
The color of the data points represents the correlation coefficient of the AOD and WVC correlation, with red color indicating positive and blue color negative correlation.
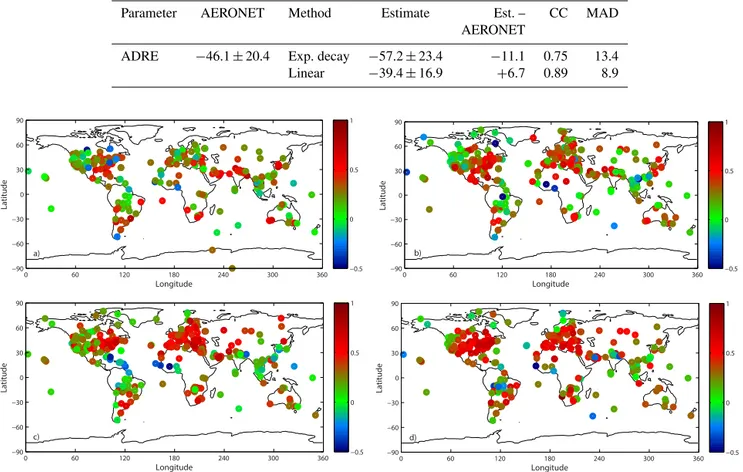
in this case for seasons: December–February (DJF, Fig. 4a), March–May (MAM, Fig. 4b), June–August (JJA, Fig. 4c) and September–November (SON, Fig. 4d) (all years avail-able). Most of the points are colored either green or red, indicating an absent or a positive correlation. The strongest positive correlation is for the stations in Europe and eastern USA, presumably due to aerosol hygroscopic growth. This holds especially for the JJA and SON seasons. The DJF and MAM seasons provide weaker positive correlation, indicat-ing that the linear method can then provide there somewhat underestimated ADRE. Interestingly, the strongest negative correlation appears during the JJA season in the west Saha-ran region and Central America, probably caused by a strong desert dust domination and low WVC in the Saharan outflow region (Marsham et al., 2008). During those particular cases, the linear method can significantly underestimate ADRE, as indicated by the points of largest negative WVC vs. AOD correlation in Fig. 3b, while the nonlinear decay provides then a better estimate.
Finally, the ADRE estimations of all data are grouped together in numerical form in Table 1. As already evident from the figures, the nonlinear decay regression method over-estimates (mean= −57.2 Wm−2) while the linear method
underestimates (mean= −39.4 Wm−2) the magnitude of
ADRE (AERONET value= −46.1 Wm−2). Overall, the
lin-ear method yields better results than the nonlinlin-ear decay method.
Previous studies have shown that the AERONET WVC agrees well with radiosonde sounding data (e.g., Prasad and Singh, 2009; Bokoye et al., 2007). Also, Smirnov et al. (2004) indicate that the AERONET WVC provides the root mean square difference of 7.0 % in a multiyear com-parison with WVC measurements derived from GPS. We
also compared AERONET WVC measurements against ra-diosonde data from five sites (Alta Floresta, Cuiaba-Miranda, Niamey, Thessaloniki and Wallops) and observed similarly high correlations between these two data sources. However, we wanted to assess in particular whether there exists any systematic dependence between WVC from these two data sources as a function of AOD, which could affect our ADRE analysis based on the modeledF. We found that while the
ratio between the AERONET and radiosonde WVC is essen-tially constant for AODs (at 500 nm) larger than about 0.1, in many sites WVC can deviate for the cases of smallest AOD (below 0.1). We estimated how our ADRE values (based on theF and AOD relation) would change if we normalized the
AERONET-modeled fluxes to incorporate the WVC from the radiosonde measurements instead of AERONET-measured WVC. We found that the increased WVC uncertainty at the lowest AOD values introduces an insignificant change in our ADRE estimates.
4 Conclusions
Determining the ADRE at the earth’s surface from radiative flux,F, measurements is not straightforward because it
in-volves the estimation of the flux without aerosolsF0. This
requires either radiative transfer modeling or an extrapola-tion ofF down to AOD=0.
We have evaluated two such extrapolation methods: (i) a linear fit and (ii) a nonlinear decay fit to the F and AOD
data. As a reference we used the AERONET ADRE data in whichF0(andF )is calculated with radiative transfer
Table 1.The estimated ADRE (Faer)with standard deviations compared with the AERONET value. MAD – mean absolute deviation. Units
are in Wm−2, except for the correlation coefficient (CC).
Parameter AERONET Method Estimate Est. – CC MAD AERONET
ADRE −46.1±20.4 Exp. decay −57.2±23.4 −11.1 0.75 13.4
Linear −39.4±16.9 +6.7 0.89 8.9
Longitude
Latitude
0 60 120 180 240 300 360 −90
−60 −30 0 30 60 90
−0.5 0 0.5 1
Longitude
Latitude
0 60 120 180 240 300 360 −90
−60 −30 0 30 60 90
−0.5 0 0.5 1
Longitude
Latitude
0 60 120 180 240 300 360 −90
−60 −30 0 30 60 90
−0.5 0 0.5 1
Longitude
Latitude
0 60 120 180 240 300 360 −90
−60 −30 0 30 60 90
−0.5 0 0.5 1 b)
a)
c) d)
Figure 4.Geographical distribution of the AOD and WVC correlation, at all AERONET stations considered in this study for(a)December–
February,(b)March–May,(c)June–August and(d)September–November (all available years).
intensity, and thus the nonlinear decay regression is expected to give a better estimation of ADRE. This would be the case if the typically positive correlation of WVC and AOD did not affect the dependency. F0 represents an unrealistically low
WVC, resulting in an underestimation of attenuation caused by the WVC, and hence a too largeF0. This leads to an
over-estimation of the magnitude of ADRE. For stations and data series in which there is no correlation between WVC and AOD, the nonlinear decay fit is superior.
As the WVC effect was found to be of such importance, we also investigated the geographical correlation of WVC and AOD. The positive correlations clearly dominate, and clear negative correlations occur predominantly in desert-dust-dominated data series, such as the regions at the Saharan outflow. The strongest positive correlation was found in sta-tions in Europe and eastern USA. Our results indicate that the regression method, either linear or nonlinear, can read-ily produce a significant error due to the correlation of WVC and AOD. Since for a majority of locations AOD and wa-ter vapor column (WVC) have a positive correlation, the lin-ear method gives somewhat better results in general than the nonlinear approach, for the reasons discussed above.
How-ever, there are specific regions of strong negative WVC and AOD correlation, most notably in the Saharan dust outflow region, where the opposite takes place and nonlinear ap-proach results in better estimate for ADRE. Therefore, based on our results we recommend that when the surface ADRE is estimated by using pyranometer and AOD measurements, the site-specific correlation between WVC and AOD should be also estimated to deduce whether linear or nonlinear ap-proach is more suitable. We moreover recommend taking one step forward and additionally attempting to correct for the possible bias due to WVC and AOD correlation. When the data for the WVC become available, then better ADRE accu-racy is likely achieved if the flux measurements are normal-ized to constant WVC amount with simple scaling obtained from RT modeling.
Acknowledgements. We thank the AERONET team, principal investigators and other participants for theirs effort in establishing and maintaining the network. This study is supported by the Academy of Finland Doctoral Programme ACCC and the Maj and Tor Nessling Foundation. We also thank Larry Oolman from Department of Atmospheric Science, University of Wyoming, for providing radiosonde data of atmospheric water vapor column abundance.
Edited by: E. Gerasopoulos
References
Bokoye, A. I., Royer, A., Cliche, P., and O’Neill, N.: Calibration of Sun Radiometer – based atmospheric water vapor retrievals using GPS meteorology, J. Atmos. Ocean. Tech., 24, 964–979, doi:10.1175/JTECH2011.1, 2007.
Bush, B. C. and Valero, F. P. J.: Spectral aerosol radiative forcing at the surface during the Indian Ocean Experiment (INDOEX), J. Geophys. Res., 107, 8003, doi:10.1029/2000JD000020, 2002. Bush, B. C. and Valero, F. P. J.: Surface aerosol radiative forcing
at Gosan during the ACE-Asia campaign, J. Geophys. Res., 108, 8660, doi:10.1029/2002JD003233, 2003.
Conant, W. C., Seinfeld, J. H., Wang, J., Carmichael, G. R., Tang, Y., Uno, I., Flatau, P. J., Markowicz, K. M., and Quinn, P. K.: A model for the radiative forcing during ACE-Asia de-rived from CIRPAS Twin Otter and R/V Ronald H. Brown data and comparison with observations, J. Geophys. Res., 108, 8661, doi:10.1029/2002JD003260, 2003.
Derimian, Y., Léon, J.-F., Dubovik, O., Chiapello, I., Tanré, D., Sinyuk, A., Auriol, F., Podvin, T., Brogniez, G., and Holben, B. N.: Radiative properties of aerosol mixture observed during the dry season 2006 over M’Bour, Senegal (African Monsoon Multidisciplinary Analysis campaign), J. Geophys. Res., 113, D00C09, doi:10.1029/2008JD009904, 2008.
Di Sarra, A., Pace, G., Meloni, D., De Silvestri, L., Piacentino, S., and Monteleone, F.: Surface shortwave radiative forcing of dif-ferent aerosol types in the central Mediterranean, Geophys. Res. Lett., 35, L02714, doi:10.1029/2007GL032395, 2008.
Dubovik, O. and King, M. D.: A flexible inversion algorithm for retrieval of aerosol optical properties from Sun and sky radiance measurements, J. Geophys. Res., 105, 20673–20696, doi:10.1029/2000JD900282, 2000.
Dubovik, O., Smirnov, A., Holben, B. N., King, M. D., Kauf-man, Y. J., Eck, T. F., and Slutsker, I.: Accuracy assessments of aerosol optical properties retrieved from Aerosol Robotic Net-work (AERONET) Sun and sky radiance measurements, J. Geo-phys. Res., 105, 9791–9806, doi:10.1029/2000JD900040, 2000. Dumka, U. C., Satheesh, S. K., Pant, P., Hegde, P., and Kr-ishna Moorthy, K.: Surface changes in solar irradiance due to aerosols over central Himalayas, Geophys. Res. Lett., 33, L20809, doi:10.1029/2006GL027814, 2006.
Eck, T. F., Holben, B. N., Reid, J. S., Dubovik, O., Smirnov, A., O’Neill, N. T., Slutsker, I., and Kinne, S.: Wavelength dependence of the optical depth of biomass burning, urban, and desert dust aerosols, J. Geophys. Res., 104, 31333–31349, doi:10.1029/1999JD900923, 1999.
García, O. E., Díaz, A. M., Expósito, F. J., Díaz, J. P., Dubovik, O., Dubuisson, P., Roger, J.-C., Eck, T. F., Sinuyk, A.,
Derim-ian, Y., Dutton, E. G., Schafer, J. S., Holben, B. N., and Gar-cía, C. A.: Validation of AERONET estimates of atmospheric solar surface fluxes and aerosol radiative forcing by ground-based broadband measurements, J. Geophys. Res., 113, D21207, doi:10.1029/2008JD010211, 2008.
García, O. E., Díaz, A. M., Expósito, F. J., Díaz, J. P., Re-dondas, A., and Sasaki, T.: Aerosol radiative forcing and forcing efficiency in the UVB for regions affected by Saha-ran and Asian Mineral Dust, J. Atmos. Sci., 66, 1033–1040, doi:10.1175/2008JAS2816.1, 2009.
García, O. E., Díaz, J. P., Expósito, F. J., Díaz, A. M., Dubovik, O., and Derimian, Y.: Aerosol Radiative Forcing: AERONET-Based Estimates, Climate Models, Dr. Leonard Druyan (Ed.), ISBN: 978-953-51-0135-2, InTech, avail-able at: http://www.intechopen.com/books/climate-models/ aerosol-radiative-forcing-aeronet-based-estimates, 275–296, 2012.
Holben, B. N., Eck, T. F., Slutsker, I., Tanré, D., Buis, J. P., Setzer, A., Vermote, E., Reagan, J. A., Kaufman, Y. J., Nakajima, T., Lavenu, F., Jankowiak, I., and Smirnov, A.: AERONET – a Fed-erated Instrument Network and Data Archive for aerosol charac-terization, Remote Sens. Environ., 66, 1–16, doi:10.1016/S0034-4257(98)00031-5, 1998.
IPCC: Climate Change 2013: The Physical Science Basis. Contri-bution of Working Group I to the Fifth Assessment Report of the Intergovernmental Panel on Climate Change, edited by: Stocker, T. F., Qin, D., Plattner, G.-K., Tignor, M., Allen, S. K., Boschung, J., Nauels, A., Xia, Y., Bex, V., and Midgley, P. M., Cambridge University Press, Cambridge, United Kingdom and New York, NY, USA, 1535 pp., 2013.
Kaufman, Y. J., Tanré, D., Holben, B. N., Mattoo, S., Remer, L. A., Eck, T. F., Vaughan, J., and Chatenet, B.: Aerosol radiative impact on spectral solar flux at the surface, derived from principal-plane sky measurements, J. Atmos. Sci., 59, 635–646, doi:10.1175/1520-0469(2002)059<0635:ARIOSS>2.0.CO;2, 2002.
Kitamori, Y., Mochida, M., and Kawamura, K.: Assessment of the aerosol water content in urban atmospheric particles by the hy-groscopic growth measurements in Sapporo, Japan, Atmos. Env-iron., 43, 3416–3423, 2009.
Kudo, R., Uchiyama, A., Yamazaki, A., Sakami, T., and Kobayashi, E.: From solar radiation measurements to optical properties: 1998–2008 trends in Japan, Geophys. Res. Lett., 37, L04805, doi:10.1029/2009GL041794, 2010.
Loeb, N. G. and Su, W.: Direct aerosol radiative forcing uncertainty based on a radiative perturbation analysis, J. Climate, 23, 5288– 5293, doi:10.1175/2010JCLI3543.1, 2010.
Markowicz, K. M., Flatau, P. J., Remiszewska, J., Witek, M., Reid, E. A., Reid, J. S., Bucholtz, A., and Holden, B.: Observations and modeling of the surface aerosol radiative forcing during UAE2, J. Atmos. Sci., 65, 2877–2891, doi:10.1175/2007JAS2555.1, 2008. Marsham, J. H., Parker, D. J., Grams, C. M., Johnson, B. T., Grey, W. M. F., and Ross, A. N.: Observations of mesoscale and boundary-layer scale circulations affecting dust transport and uplift over the Sahara, Atmos. Chem. Phys., 8, 6979–6993, doi:10.5194/acp-8-6979-2008, 2008.
Prasad, A. K. and Singh, R. P.: Validation of MODIS Terra, AIRS, NCEP/DOE AMIP-II Reanalysis-2, and AERONET Sun photometer derived integrated precipitable water vapor using ground-based GPS receivers over India, J. Geophys. Res., 114, D05107, doi:10.1029/2008JD011230, 2009.
Roger, J. C., Mallet, M., Dubuisson, P., Cachier, H., Vermote, E., Dubovik, O., and Despiau, S.: A synergetic approach for estimat-ing the local direct aerosol forcestimat-ing: application to an urban zone during the Expriénce sur Site pour Contraindre les Modèles de Pollution et de Transport d’Emission (ESCOMPTE) experiment, J. Geophys. Res., 111, D13208, doi:10.1029/2005JD006361, 2006.
Satheesh, S. K. and Ramanathan, V.: Large differences in tropical aerosol forcing at the top of the atmosphere and Earths surface, Nature, 405, 60–63, doi:10.1038/35011039, 2000.
Satheesh, S. K., Vinoj, V., and Krishna Moorthy, K.: Radia-tive effects of aerosols at an urban location in southern In-dia: Observations vs. model, Atmos. Environ., 44, 5295–5304, doi:10.1016/j.atmosenv.2010.07.020, 2010.