199
Abstract
In iron ore pelletizing plants a range of process parameters such as particle size distribution, speciic surface area, and moisture, must be controlled to achieve opti-mized operation conditions. Particle size distribution and speciic surface area are con-trolled during the grinding operations. Moisture, however, is concon-trolled during iltra-tion of the ground products. This work investigates the relailtra-tionship between particle morphology, ilter cake moisture and ilter capacity. The samples were taken during the iltration tests and referred to three different blends presenting distinct mineralogical features and similar chemical compositions in order to investigate the effects of only the hematite surface characteristics. Six types of morphology are distinguished: granu-lar hematite, tabugranu-lar hematite, martitic hematite, polycrystalline hematite, hematite-goethite aggregates and hematite-goethite. For each iltration test, the ilter cloth product was characterised. The characterisation analysis revealed that blends containing martitic hematite concentration above 11.45 percent increased substantially the ilter capacity. However, it had also caused an increasing in inal moisture content that reached values around 10.0 % compared with industrial moisture speciication that can vary on the range of 8.5 to 9.5 %.
Keywords: hematite, optical microscopy, SEM, iltration, moisture.
Leonardo Martins Graça
Professor Adjunto I
Universidade Federal de Ouro Preto – UFOP Escola de Minas
Departamento de Geologia Ouro Preto - Minas Gerais – Brasil [email protected]
Leonardo Evangelista Lagoeiro
Professor Titular
Universidade Federal do Paraná – UFPR Departamento de Geologia
Setor de Ciências da Terra Curitiba - Paraná – Brasil [email protected]
Roberto Galéry
Professor Titular
Universidade Federal de Minas Gerais – UFMG Escola de Engenharia
Departamento de Engenharia de Minas Belo Horizonte – Minas Gerais - Brasil [email protected]
Antônio Eduardo Clark Peres
Professor Titular
Universidade Federal de Minas Gerais – UFMG Escola de Engenharia
Departamento de Engenharia Metalúrgica e de Materiais Belo Horizonte – Minas Gerais - Brasil
Effects of hematite
surface characteristicson
filtration process
Mining
Mineração
http://dx.doi.org/10.1590/0370-44672014690158
1. Introduction
In iron ore pelletizing plants, the process parameters must be under rig-orous controlled conditions in order to maintain the process at optimized operat-ing conditions. The industrial pelletizoperat-ing process comprises the stages of the iron concentrate blend’s preparation, forma-tion of green balls and ball induraforma-tion (Meyer, 1980; Kelly & Spottiswood, 1982; Qiu et al., 2003; Dwarapudi et al., 2008). The variables involved in iron ore concentrate blend preparation are particle size distribution, speciic surface area, and ilter cake moisture. Particle size distribution and speciic surface area
are controlled during the grinding stages, whereas the cake moisture is controlled during the iltration process. These op-eration variables are strongly inluenced by the mineralogical features of the raw material to be processed, which interfere in the productivity indexes.
In grinding operations the eficiency may be expressed by relationships in-volving the initial and inal particle size distributions. It can also be related to the ore blend speciic surface area required up stream. It is a very intensive energy consuming stage being governed by the ore blends work index. The eficiency
1999; Mourão & Stegmiller, 1990; Santos et al., 2005). Data about the iltration process of iron ore are restricted to the membrane fouling, measurement of ilter height and large particles on microiltra-tion of small particles (Vyas et al., 2000;
Madaeni, 2000; Saleem & Krammer, 2007; Haselhuhn et al., 2012). However, the application of optical microscopy and electron microscopy techniques to understand the productivity of the iltering process has been increasing.
This paper is focused on the mor-phological feature types of the grains. Thus, filtration pilot tests were per-formed and the relationship between the moisture of the cake and the productivity was determined.
2. Materials and methods
The samples analyzed during the iltration pilot tests refer to three iron ore blends (blends 1, 2, and 3). The blends show distinct mineralogical features and similar chemical compositions; so that the iltration response can only be related to the morphologies effects. The blends are
composed by six different ore concen-trates. For blend composition, each one of these products is physically and chemically controlled in the pelletizing pilot plant. The chemical composition of these six concentrates designated as samples A, B, C, D, E and F are presented in Table 1.
The samples A, B, C, and F are lota-tion concentrates. Sample B was obtained via magnetic concentration and sample D was a screening product (P80= 8 mm). Those typical iron ore sample concentrates are produced in the daily industrial routine of the pelletizing plant.
sample FeO SiO2 Al2O3 P2O5 MnO CaO MgO TiO2 LOI
A 96.65 0.95 0.32 0.03 0.049 0.02 0.02 0.059 1.92
B 93.88 4.68 0.48 0.034 0.112 0.02 0.03 0.061 0.72
C 97.64 0.59 0.43 0.064 0.023 0.01 0.02 0.049 1.20
D 90.67 4.44 1.84 0.092 0.023 0.01 0.04 0.056 2.83
E 96.58 0.65 0.52 0.124 0.101 0.01 0.03 0.074 1.92
F 96.55 0.9 0.35 0.119 0.068 0.01 0.03 0.053 1.94
Table 1
Chemical composition of each type of iron ore concentrate investigated.
The mineralogical characteristics of the samples were determined in four size class intervals [+1]mm, [-1+0.106] mm, [-0.106+0.045]mm and [-0.045] mm. The morphological types described were obtained in a scanning electron mi-croscope (SEM) and in an optical micro-scope (OM). For the three-dimensional analyses, it was used SEM for carbon coated samples. For OM, it was con-sidered 450 grains and/or polycrystals per grain size fraction. The relationship between the weight and morphological types of each grain size fraction deined the proile of each sample. In the same way, the three blends produced for il-tration tests were obtained according to the association of weight products and mineralogical features.
Six different morphologies attrib-uted to grains were identiied: granular hematite, tabular hematite, martitic hematite, polycrystalline hematite, he-matite-goethite aggregates, and goethite. The granular hematite is observed, under SEM, as grains with irregular surfaces, and under OM, as grains with an aspect ratio < 2. On the other hand, the tabular hematite consists of grains with plain to
concave surfaces, under SEM, and the aspect ratio > 2, under OM. The martitic hematite grains show triangular sections derived from the topotactic transforma-tion of magnetite to hematite. The high porosity of the martitic hematite grains is another evidence of the magnetite transformation to hematite (Barbosa & Lagoeiro, 2009; Barbosa et al., 2011). Occasionally, the pores contain variable amounts of the earthy-like goethite. Goethite in its earthy variety is a very ine material and occurs like crusts around the martitic hematite or illing cavities between grains in martitic hematite (Madaeni, 2000). Polycrystalline hematite shows tabular and granular morpholo-gies, combining sections with broad val-ues of aspect ratio. The coexistence of hematite with goethite characterizes the hematite-goethite aggregates. The grains of granular and tabular hematite are dis-persed in a goethitic matrix. Under OM, the goethite grains are identiied by their shades of red and gray and irregular or saw-shaped edges.
Different blends were prepared and submitted to the grinding process in order to obtain a product with speciic surface
area of 1,900 cm²/g. This condition guarantees a product size below 0.045 mm. After grinding, each blend was submitted to iltration in an Humboldt-Wedag rotary disc vacuum ilter, with dimensions of, respectively, 1,300 x 230 mm as disk and central duct diameters. The ilter through put was equivalent to 2.5 t/h. Four samples (sample 1, 2, 3, and 4) weighing approximately 400 kg were collected for moisture determination and productivity rate (t/hm2).
Three samples representing each of the ilter cake blends also had their morphological types characterized under SEM. In addition, the ilter fabrics used for iltering were analyzed under SEM: two samples taken in each extreme of the ilter sector, and the third taken at the central part. The morphologies of the cakes and the iltering fabric features were then related to the factors of eficiency of the iltration process, markedly moisture content and the productivity rate.
201
Quantachrome. The quantiication of the moisture was made based on the dif-ference between the mass of the natural sample before and after being dried in
a lab for an hour at 105 °C. During the iltration tests, the vacuum pressure was set at 0.84 kg/cm2, the pulp density was
maintained at 2.30 kg/L, and the inal
desired moisture for the iltered cake set between 8.5% and 9.5%. These condi-tions are kept the same as the applied to industrial operations.
3. Results
Results of size distribution, density, and speciic surface area of the six iron
ore concentrates are presented in Figure 1 and Table 2.
Figure 1 Results of size distribution of the product samples.
Table 2 Results of density and specific surface area (standard deviation inside brackets) of the product samples.
samples Density specific surface area (cm2/g)
A 5.13 375.37 0(27.96)
B 4.96 246.66 0(34.88)
C 5.14 337.69 0(56.22)
D 4.87 387.66 (180.07)
E 5.06 523.70 00(2.76)
F 5.05 470.93 0(12.31)
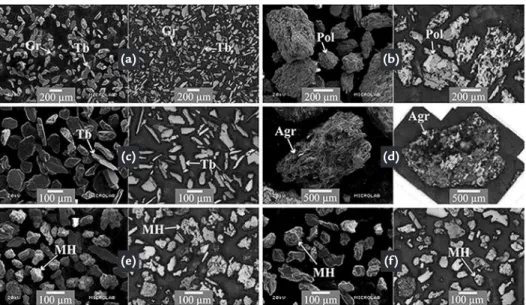
The ore samples A, C, E and F consist of liberated grains iron oxide in which the following morphological types were recognized: sample A was charac-terized by the predominance of totally liberated tabular or granular hematite grains; sample C with predominance of
tabular hematite grains and, samples E and F were predominantly composed by martitic hematite grains. Samples B display a high content of polycrys-talline hematite and D are recognized by hematite grains in a goethite-rich matrix composed by hematite-goethite
aggregates. These aggregates observed in samples B and D were not observed in the other ore samples (Figure 2). The morphological differences observed un-der SEM were also conirmed unun-der OM and the results obtained for each sample are shown in Table 3.
Figure 2 Main mineralogical characteristics
under SEM (left) and OM (right). Sample A with granular (Gr) and tabular (Tb) hematite; sample B with
polycrys-talline (Pol) hematite; sample C with tabular hematite; sample D with hemati-te-goethite aggregates (Agr) and samples
E and F with martitic hematite (MH).
(a)
(f) (b)
(c)
(e)
Table 3
Occurrences of morphological types for each analyzed sample (%).
Morphological types of product samples
samples hematitegranular hematitetabular hematitemartitic polycrys-talline hematite
hematite-goethite
aggregate goethite
A 19.96 55.77 00.97 20.67 01.49 01.14
B 07.44 23.09 04.64 55.12 08.94 00.77
C 09.08 62.72 02.88 10.00 09.75 05.57
D 03.72 31.44 02.84 22.91 35.63 03.45
E 09.33 24.64 30.90 09.14 11.87 14.12
F 11.11 20.04 39.40 07.95 10.64 10.86
The blends for pilot plant iltra-tion tests were prepared focusing on the varying percentage of the martitic
hematite. It is important to mention that the chemical composition of each one of the three blends achieved the
industry’s standards. These proportions are presented in Table 4.
Table 4
Composition of the ore blends.
Blend composition for each sample (% weight)
samples blend 1 blend 2 blend 3
A 50.37 65.46 41.07
B 12.11 05.10 06.93
C 13.96 00.00 00.00
D 09.20 29.45 26.69
E 04.00 00.00 00.00
F 10.36 00.00 25.30
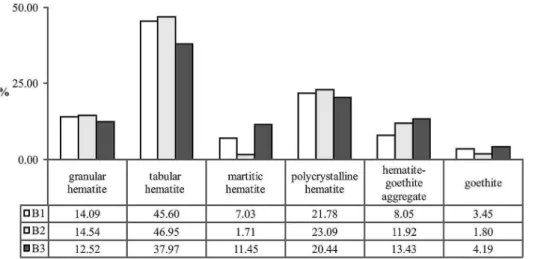
Figure 3 displays the mineralogical composition of the blends submitted to iltration tests. The characterisation results shows that granular and polycrystalline hematite have similar proportions in the blends. The tabular hematite in blend 3 is lower in proportion to that in blends 1 and 2. This is due to the lower
propor-tion of the sample A in blend 3. Blend 1 is characterized by an intermediate amount of martitic hematite when compared to blends 2 and 3. The proportion of martitic hematite in each blend occurs due the presence of samples E and F. In regards to the goethite, it was observed that its pro-portion is very similar in all three blends,
varying together with martitic hematite. Thus, the blends can be differentiated by their content of martitic hematite and also by the slightly increasing in the goethite content from blend 2 to blend 1 and to blend 3. Although, goethite content is lower in all blends, its content increases due to the hematite-goethite aggregate.
Figure 3
203
In the analysis by SEM (Figure 4) of the cake samples of blends 1 and 2, it is possible to observe the presence of granular and tabular hematite together with ine hematite grains. The martitic
hematite is only veriied in blend 3. On the other hand, polycrystalline hematite and the goethite-hematite aggregates are not identiied in the retained ilter cake after the grinding and iltering processes.
Similar results are observed for the ilter fabrics. A clear difference was found in the iltration of the three blends. The ilter fabric impregnation by hematite grains decreases from blend 1 to blend 3.
Figure 4 Secondary electron images of the retained cake and filtration fabrics.
For each sample, it was measured the iltration rate (t/hm2) and moisture
content. The sampling results with pa-rameters associated in the iltration test are shown in Table 5. Blends 1 and 2 exhibit the ilter rate of 1.41 and 1.23 t/hm2. Blend 3 presents the highest
av-erage ilter rate, reaching 1.80 t/hm2.
Only blends 1 and 2 presented moisture contents close to the expected values obtained in industrial operations. The moisture content in blend 1 was 9.49% and blend 2 was 9.41%. However, for blend 3 the measured moisture content of 10.38% did not reach the industrial speciication. For those tests, the main
operating parameters, the pulp density, the speciic surface area, and the weight percent below 0.045 mm, were kept un-der controlled conditions and remained stable. Thus, it was ensured that the dif-ferences between tests performance could be only attributed to the differences of the ore morphological types.
Table 5 Pilot plant filtration test data.
blends samples (min-time utes)
mass (tonnes)
produc-tivity (t/ hm2)
mois-ture per
blend (%)
density (kg/l)
specific surface area (cm2/g)
mass[-0.045] mm (%)
2
1 09.00 0.389 1.30 09.39 2.30 1,936 84.88
2 18.85 0.415 1.26 09.56 2.28 1,967 85.28
3 29.30 0.392 1.13 09.35 2.29 1,936 84.36
4 38.88 0.388 1.24 09.32 2.28 1,936 84.58
average 24.01 0.396 1.23 09.41 2.29 1,944 84.78
1
1 08.60 0.468 1.64 09.38 2.31 2,007 90.62
2 18.38 0.431 1.32 09.43 2.30 2,073 90.86
3 27.67 0.418 1.37 09.65 2.30 2,166 90.98
4 37.22 0.421 1.32 09.52 2.27 2,095 91.58
average 22.97 0.435 1.41 09.49 2.30 2,085 91.01
3
1 06.00 0.371 1.86 10.30 2.29 1,858 90.58
2 12.52 0.403 1.85 10.50 2.31 1,899 90.64
3 19.28 0.395 1.75 10.30 2.29 1,902 89.72
4 25.47 0.362 1.76 10.40 2.28 1,932 90.74
4. Discussion
Samples A, C, E, and F are origi-nally lotation products and the results obtained for the speciic surface area for those samples increases as the proportion of martitic hematite gets higher, such as observed in samples E and F. Samples, A, C, E, and F show similar particle size distributions. Thus, similar values for speciic surface area for those samples would be expected. However, the spe-ciic surface area parameters showed differences. This may be explained by the higher porosity characteristic of martitic hematite, which the pores space contributing to the increase of the speciic surface area. Hence, samples E and F contain larger proportions of martitic hematite compared to the oth-ers, so they show higher values for the speciic surface area (see Table 2). The lowest value for the speciic surface area in sample B is due to the predominance of polycrystalline hematite and a lower proportion of the hematite-goethite aggregates that contain ine grains of goethite. On the other hand, sample D showed a speciic surface area greater than all of the samples due to the pres-ence of the hematite-goethite aggregate. The grinding process was applied in order to yield a product speciication
characterized by a speciic surface area of 1,900 cm2/g and a high proportion of the
ground product below 0.045 mm. This process is well understood when applied to ores composed mostly of polycrystal-line mineral particles (Silva et al., 2003). However, the polycrystalline proportions for the different blends investigated were similar. On the other hand, the blend results showed a positive relationship be-tween the proportion of martitic hematite (see Figure 3) and the mass retained in the size fraction below 0.045mm (see Figure 1). This implies in the existence of a quasi-linear relationship between the iltration rate and the martitic hematite content, as shown in Figure 5a) and 5b). It is believed that a linear relationship can be obtained under more controlled ilter operation. The martitic hematite is typical in blends 1 and 3 after the grinding. As observed in OM and SEM, the morphology consists of rough surfaces and grains with a large proportion of pore spaces.
The effect of these ore features on the iltering eficiency is evident. The pro-portion of martitic hematite on the three blends increases following the sequence: B2 (1.71%) < B1 (7.03%) < B3 (11.45%). It is important to mention that, although the moisture content increases in the sequence
B2 → B1 → B3 (Figure3b), the iltration productivity, measured as the ilter rate, follows the same behavior: B2 (1.23 t/ hm2) < B1 (1.41 t/hm2) < B3 (1.80 t/hm2).
Thus, the different results about moisture and productivity can be related to the martitic hematite content in the blend. The results suggest that the moisture and productivity increase with the increasing percentage of martitic hematite in the blend. The large proportion of martitic hematite in the blends causes an increase of the eficiency of the iltration process as observed in moisture content in blend 3, that does not attain the industrial require-ments (between 8.5% and 9.5%).
Martitic hematite shows highly porous grains displaying a typical trellis structure which consists of an angular network of hematite lamellae resulting from the martitization of magnetite (Morris, 1980). Porosity may reduce the strength of the ore in grinding and increase the speciic surface area. Fur-thermore, the existence of highly porous grains enhances the presence of interstitial water, which would imply high moisture in the ilter cake. Moreover, the ine-grained hematite derived from the martiti-zation would lead to an impregnation of the ilter fabrics increasing the moisture.
Figure 5
(a) Relationship between the martitic hematite with filter rate and;
(b) martitic hematite content and moisture.
5. Acknowledgements
This study was partially sup-ported by the Fundação de Amparo a Pesquisa do Estado de Minas Gerais (FAPEMIG) and the Conselho
Nacio-nal de Desenvolvimento Cientíico e Tecnológico (CNPq) e CAPES/PRO-EX. All the analyses were performed in the Laboratory of Microscopy and
Microanalysis (MICROLAB) at the Universidade Federal de Ouro Preto (UFOP).
6. References
BARBOSA, P. F., LAGOEIRO, L. Crystallographic texture of the magnetite-hematite transformation: evidence for topotactic relationships in natural samples from Quadrilátero Ferrífero, Brazil. American Mineralogist, v. 95, p.118-125, 2009.
BARBOSA, P. F., SCHOLZ, R., GRAÇA, L., ALVAREZ, G. Electron Backscat-tering Diffraction (EBSD) as a tool to evaluate the topotactic and epitactic growth of minerals: the example of the magnetite and hematite. Microscopy and Microanalysis,
v. 17, p. 408-409, 2011.
DWARAPUDI, S., DEVI, T. U., MOHAN RAO, S., RANJAN, M. Inluence of
205
pellet size on quality and microstructure of iron ore pellets. ISIJ International, v. 48,
n. 6, p. 768-776, 2008.
HASELHUHN, H. J., SWANSON, K. P., KAWATRA, S. K. The effect of CO2 sparging on the locculation and iltration rate of concentrated hematite slurries. Inter-national Journal of Mineral Processing, v. 112, p. 107-109, 2012.
KELLY, E. G., SPOTTISWOOD, D. J. Introduction to mineral processing. New
York: John Wiley & Sons, 1982. 491p.
MADAENI, S. S. The effect of large particles on microiltration of small particles.
Journal of Porous Materials, v. 8, p. 143-148, 2000.
MEYER, K. Pelletizing of iron ores. Berlin: Springer-Verlag, 1980. 302p.
MORRIS, R. C. A textural and mineralogical study of the relationship of iron ore to banded iron-formation in the Hamersley Iron Province of Western Australia.
Economic Geology, v. 75, p. 184-209, 1980.
MOURÃO, J. M., STEGMILLER, L. Inluência da estrutura dos minérios de ferro na sua moabilidade. In: ENCONTRO NACIONAL DE TRATAMENTO DE
MINÉRIOS E HIDROMETALURGIA, 14.Salvador, Anais... Salvador, v. 1, p.
228-243, 1990.
PRIOR, D. J., BOYLE, A. P., BRENKER, F., CHEADLE, M. C., DAY, A., LO-PEZ, G., PERUZZO, L., POTTS, G. J., REDDY, S. M., SPIESS, R., TIMMS, N. E., TRIMBY, P. W., WHEELER, J., ZETTERSTRÖM, L. The application of Electron Backscatter Diffraction and Orientation Contrast Imaging in the SEM to textural problems in rocks. American Mineralogist, v. 84, p. 1741-1759, 1999.
QIU G., JIANG T., LI H., WANG, D. Functions and molecular structure of organic binders for iron ore pelletization. Colloid and Surface A,v. 224, p.11-22, 2003.
ROWLAND, C. A., KJOS, D. M. Rod and ball mills. In: KAWATRA, S. K.
Comminution Practices. Colorado: Littleton, 1997. p. 319-338.
SALEEM, M., KRAMMER, G. Optical in-situ measurement of ilter cake height during bag ilter plant operation. Powder Technology, v. 173, p. 93-106, 2007.
SANTOS, L. D., BRANDÃO, P. R. G., SAMPAIO, D. A. Mineralogical and morphological characterization of iron ore types from Mina Gerais, Brazil – Inluences on the speciic surface area of concentrates. Minerals & Metallurgical Processing, v.
22, n. 2, p. 116-121, 2005.
SILVA, C. E. A., JÚNIOR P. A. S., CARNEIRO, R. T. S., VIEIRA, C. B., ARAÚJO, F. G. S., KRÜGER, F. L. V., KRÜGER, P. V. O Projeto de Geossiderurgia na Pelotização da Companhia Vale do Rio Doce. In: SIMPÓSIO BRASILEIRO DE MI-NÉRIO DE FERRO, 4. 2003. Ouro Preto, Anais... Ouro Preto, 2003, v. 2, p. 624-633.
VYAS, H. K., BENNETT, R. J., MARSHALL, A. D. Inluence of feed properties on membrane fouling in crosslow microiltration of particulate suspensions. Interna-tional Dairy Journal, v. 10, p. 855-861, 2000.