Atmos. Chem. Phys., 14, 10547–10563, 2014 www.atmos-chem-phys.net/14/10547/2014/ doi:10.5194/acp-14-10547-2014
© Author(s) 2014. CC Attribution 3.0 License.
Ion – particle interactions during particle formation and growth at
a coniferous forest site in central Europe
S. G. Gonser1, F. Klein1,*, W. Birmili2, J. Größ2, M. Kulmala3, H. E. Manninen3, A. Wiedensohler2, and A. Held1 1University of Bayreuth, BayCEER, Atmospheric Chemistry, 95448 Bayreuth, Germany
2Leibniz Institute for Tropospheric Research, 04318 Leipzig, Germany 3Department of Physics, University of Helsinki, 00014 Helsinki, Finland
*now at: Gasphase and Aerosol Chemistry Group, Paul Scherrer Institute, 5232 Villigen, Switzerland
Correspondence to:S. G. Gonser ([email protected])
Received: 13 December 2013 – Published in Atmos. Chem. Phys. Discuss.: 6 January 2014 Revised: 1 September 2014 – Accepted: 3 September 2014 – Published: 9 October 2014
Abstract.In this work, we examined the interaction of ions and neutral particles during atmospheric new particle for-mation (NPF) events. The analysis is based on simultane-ous field measurements of atmospheric ions and total parti-cles using a neutral cluster and air ion spectrometer (NAIS) across the diameter range 2–25 nm. The Waldstein research site is located in a spruce forest in NE Bavaria, Southern Ger-many, known for enhanced radon concentrations, presum-ably leading to elevated ionization rates. Our observations show that the occurrence of the ion nucleation mode pre-ceded that of the total particle nucleation mode during all analyzed NPF events. The time difference between the ap-pearance of 2 nm ions and 2 nm total particles was typically about 20 to 30 min. A cross correlation analysis showed a rapid decrease of the time difference between the ion and to-tal modes during the growth process. Eventually, this time delay vanished when both ions and total particles did grow to larger diameters. Considering the growth rates of ions and total particles separately, total particles exhibited enhanced growth rates at diameters below 15 nm. This observation can-not be explained by condensation or coagulation, because these processes would act more efficiently on charged par-ticles compared to neutral parpar-ticles. To explain our obser-vations, we propose a mechanism including recombination and attachment of continuously present cluster ions with the ion nucleation mode and the neutral nucleation mode, respec-tively.
1 Introduction
Wiedensohler, 1988). When the charged fraction is elevated in comparison to the equilibrium charged fraction, an aerosol is defined to be in an overcharged charging state.
When ions are involved in the nucleation process, two terms are usually used: ion-induced nucleation (IIN: e.g., Manninen et al., 2010) and ion-mediated nucleation (IMN; e.g., Yu and Turco, 2000). IIN denotes the formation of par-ticles from small ionic clusters, preserving the charge during growth process. Additionally, when interactions of ions and particles are taken into account the term IMN is used. Hence, IMN includes IIN and does also consider interactions among ions and particles, like recombination and attachment.
Yu (2006) developed a detailed model to simulate the IMN process. Results from this model point towards the domi-nant role of ions in NPF, especially, when the actual aerosol charged fraction is elevated in comparison to the equilib-rium charging state (Yu and Turco, 2011). On the other hand, when comparing formation rates of charged particles to total particle formation rates, only a small fraction (usually less than 10 %) of the particle formation can be attributed to IIN (Manninen et al., 2009a, 2010). However, this approach does not account for ion–ion and ion–particle interactions, which are potentially contributing largely to NPF (Yu and Turco, 2011). Only recently, Kulmala et al. (2013) and Kontkanen et al. (2013) published results of field measurements with a so-phisticated set of instruments, covering the size range where the very first steps of NPF take place. From their data and theoretical calculations of ion–ion recombination, Kulmala et al. (2013) and Kontkanen et al. (2013) concluded that pure neutral nucleation processes dominate over IMN.
Atmospheric ions are generally classified according to their electric mobility diameter Dm into three classes: (1) small ions or cluster ions (Dm<1.6 nm), (2) intermedi-ate ions (1.6 nm< Dm<7.4 nm) and (3) large ions (Dm> 7.4 nm) (e.g., Hirsikko et al., 2011). Small atmospheric ions are always present in the atmosphere, being mainly gener-ated by radioactive decay and cosmic radiation. The total concentration of small ions varies spatially and temporally, depending on ion sources and sinks (Hirsikko et al. (2011) and references therein). Elevated concentrations of interme-diate and large ions are usually only present during (1) NPF events, where small ions grow due to condensation of pre-cursor gases, (2) snow fall associated with high wind speeds, where friction processes between the snowflakes are thought to be a source for intermediate ions (Virkkula et al., 2007), and (3) rain, where the splashing of rain droplets generates intermediate ions due to the balloelectric effect (Tammet et al., 2009).
Only during the last decade, appropriate instrumentation became available to measure neutral and charged cluster size distributions down to diameters relevant for NPF (Kulmala et al., 2012). One instrument capable of measuring ions down to Dmof about 0.8 nm and neutral particles down to 2 nm is the neutral cluster and air ion spectrometer (NAIS) (Manninen et al., 2009b; 2011; Mirme and Mirme, 2013). In this paper, we
present measurements performed with the NAIS during NPF. A new approach to evaluate the data is proposed to elucidate the interactions of ions and neutral particles in the formation and growth of atmospheric particles.
2 Measurements and data analysis 2.1 Measurement setup
New particle formation (NPF) events were observed from 17 June to 18 August 2012 at the Waldstein ecosystem re-search site in the Fichtelgebirge mountain range, NE Bavaria, Southern Germany. The measurements were carried out in a coniferous forest (50◦08′35′′N, 11◦51′49′′E; 776 m a.s.l.)
dominated by Norway spruce. NPF was measured by means of a neutral cluster and air ion spectrometer (S/N NAIS15) (Airel Ltd., Tartu, Estonia) and a mobility particle size spec-trometer (reference system of TROPOS, Leipzig, Germany; Wiedensohler et al., 2012).
The NAIS is capable of measuring neutral particles in the diameter range from about 2 nm to 42 nm and atmospheric ions in the range of 0.8 nm to 42 nm (Manninen et al., 2011). The NAIS is composed of two cylindrical differential mobil-ity analyzers (DMA), each with a sample flow of 30 standard liters per minute (SLM) and a sheath flow of 60 SLM. Each DMA is equipped with 21 electrometers for simultaneous de-tection of ions. Positive and negative ions are analyzed sep-arately in a positive and a negative DMA, respectively. The NAIS can be used in different operating modes. In the parti-cle mode, clusters are charged by corona discharge prior to the mobility analysis in one of the DMAs. During ion mea-surement mode the sample is directed to the DMAs without any prior treatment. The offset mode is used for detection of the electrometer background noise level. To do this, charg-ing to opposite polarity and an electric filter is activated in-hibiting the introduction of ions to the DMAs. During the whole campaign the NAIS was operated alternatingly with these three modes: offset mode, ion mode and particle mode. The cycle time of the consecutive modes was 200 s, with the particle mode set to 66 s, the ion mode set to 67 s and the offset mode set to 67 s. Therefore, the overall temporal reso-lution of the NAIS was 200 s.
S. G. Gonser et al.: Ion – particle interactions during particle formation and growth 10549
Figure 1.Coagulation coefficient K, attachment coefficientβand recombination coefficient α [cm3s−1] for small cluster ions and particles (1.5 nm, solid lines) and large ions and particles (10 nm, dashed lines) as a function of ion/particle diameterDp. Shaded ar-eas denote the variability of the respective coefficients, plar-ease refer to the Appendix for details.
instruments, as was shown by an intercomparison of sev-eral NAIS instruments by Gagné et al. (2011). Therefore, total particle concentrations in this study are very likely to be overestimated. In the ion mode, no charging of the sam-ple is performed and the DMAs samsam-ple the naturally charged clusters. The NAIS is described in more detail by Manninen et al. (2009b) and Mirme and Mirme (2013).
The particle number size distributions measured with the mobility particle size spectrometer cover a diameter size range from 10 nm to 680 nm with a temporal resolution of 5 min. It was operated with a closed loop sheath flow of 5 SLM and a sample flow of 1 SLM. More details about the mobility particle size spectrometer are described in Wieden-sohler et al. (2012; cf. Fig. 1). Both instruments were located in a container on a clearing in the forest with the inlets point-ing towards east, at a height of 2 m above ground. Addition-ally, meteorological parameters including ozone concentra-tion, wind speed, wind direcconcentra-tion, temperature, relative hu-midity as well direct and diffuse solar radiation were mea-sured at the forest clearing.
To obtain robust information about the processes govern-ing NPF from measurements at a fixed location, the analyzed nucleation events have to be of regional character, and oc-cur in a generally homogenous air mass. The homogeneity of air masses was assessed by considering the following pa-rameters: wind direction, wind speed, ozone concentration, relative humidity and particle concentration in the diameter range from 4 to 10 nm. Only when wind speeds varied less than 0.5 m s−1and wind directions varied less than 60◦prior and during NPF, and all other parameters showed a contin-uous and consistent progression, the air mass was judged to be homogeneous.
The focus of this study is to determine ion interactions dur-ing NPF measured with the NAIS. Hence, the data of the
mo-bility particle size spectrometer was mainly considered for calculations of ion and total particle sink rates. For this pur-pose, the NAIS particle data were merged with this data by means of a linearly weighted merging algorithm in the over-lapping region of both instruments between 15 and 27 nm. The mobility particle size spectrometer was measuring with a 5 min temporal resolution and its size bins were different from the NAIS size bins. Both the size bins and the time resolution were interpolated to match the NAIS time reso-lution and size bins. The resultant particle number size dis-tribution between 2 nm and 680 nm was used for calculating the sink rates for ions and total particles according to Hõrrak et al. (2008); Kulmala et al. (2012) and Tammet and Kulmala (2005).
2.2 Interactions of ions and neutral particles
The major interactions of ions and neutral particles among themselves and with the background aerosol particle popula-tion are (1) coagulapopula-tion of neutral particles, (2) attachment of ions to neutral particles and (3) recombination of ions with ions of opposing polarity. The magnitude of these interac-tions can be calculated theoretically as corresponding coeffi-cients (see appendix for the formulations).
Coagulation (1) is an important sink for freshly nucleated particles and a factor enhancing the particle growth rate (GR) during NPF events (Kulmala et al., 2004b). To determine the size-dependent coagulation coefficient Kij, an approxima-tion from Tammet and Kulmala (2005) was used (cf. Eqs. A1 and A2). The theoretical approach forKijis valid for the in-teraction of neutral particles and clusters of all diametersi andj.
The ion aerosol attachment (2) is described by the at-tachment coefficientβ for the interaction of small air ions with neutral particles. β is commonly assumed constant (1×10⁻⁸cm3s−1) when determining ion formation rates,
lines), we extrapolatedβij for all measured ion size ranges, still using the formulation by Hõrrak et al. (2008).
In principle, the ion–ion recombination (3) can also be described by the attachment coefficient, assuming the in-teraction of clusters with opposite charges. Usually, the re-combination coefficient is denoted asα and assumed to be constant (1.6×10⁻⁶cm3s−1) when the interaction among
small ions is considered (Hoppel and Frick, 1990; Kulmala et al., 2013; Tammet and Kulmala, 2005). Considering the case of cluster ions of diameterj interacting with oppositely charged clusters of a similar diameterk,βj kshould be com-parable to the constant value ofα(Hoppel and Frick, 1986). In fact,βj k for ions withj=1.5 nm interacting with oppo-sitely charged ions withk=1.5 nm, as used in this study, is 1.3×10⁻⁶cm3s−1(solid orange line in Fig. 1). Therefore, βj k for the interaction of oppositely charged clusters in the sizes class j andk, i.e., the size-dependent recombination coefficient, will be denoted asαj kin the following (Eq. A5). The theory for ion attachment and recombination was de-veloped to calculate the attachment of small ions to larger particles or ions, in order to theoretically assess the parti-cle charge distribution in a bipolar ion environment (Hop-pel and Frick, 1986, 1990; Reischl et al., 1996). The interac-tion of intermediate and large ions with even larger neutral or charged particles was not the aim of these studies. Neverthe-less, the sinks and sources for all ion sizes have to be taken into account when analyzing ion interactions in NPF. There-fore, we chose to use the approximated theory from Hõrrak et al. (2008) to obtain a first order approximation of the coeffi-cients governing the behavior of larger ions, and to apply the calculations also for larger diameters. A validation of this ap-proach is given by comparing the size dependence ofβandα toK. In Fig. 1, all three coefficients are depicted for aerosols of two different diameters (1.5 and 10 nm). As electrical ef-fects will enhance the probability of an encounter of two par-ticles,K is the lower limit for the three considered interac-tions. When small ions (1.5 nm) and small neutral particles interact with each other (green solid line in Fig. 1), the elec-trical effect can enhance the collision probability by more than one order of magnitude. Considering the interaction of oppositely charged ions, the enhancement can be greater than three orders of magnitude (orange solid line in Fig. 1). The largest differences are found for interactions of small parti-cles or ions. However, when small ions interact with larger particles or ions, αandβ approachK, indicating a smaller influence of the charge on the collision probability. A similar pattern can be seen when considering the interaction of large ions with larger aerosol particles (dashed lines in Fig. 1). For the interaction of particles or ions with a diameter of 10 nm, α andβ decrease about 1–2 orders of magnitude while K is not that strongly affected. The difference among the three coefficients is less pronounced, pointing towards a smaller influence of the charge on collision probabilities when larger ions and particles are considered.
2.3 Ion–ion recombination
Knowing the recombination coefficientαj k and the number concentration of ions of both polarities, a theoretical number size distribution of neutral particles from ion–ion recombi-nation can be deduced. Kontkanen et al. (2013) and Kulmala et al. (2013) proposed a method to calculate the number size distribution resulting from recombination. Both authors used a constant value of 1.6×10⁻⁶cm3s−1 for α. This is jus-tified since only the recombination of charged clusters be-low 2.1 nm in diameter was considered. However, we use the size-dependentαj k for our approach as the recombination of charged clusters up to 42 nm is considered. Furthermore, Kulmala et al. (2013) used a very simple balance equation, by assuming recombination as the only source of neutral clusters and coagulations as the only sink. Similar to Kontkanen et al. (2013), our analysis includes additional sinks and source terms. The sources are given by the recombination of positive and negative ions contributing to size classias well as the growth of recombined neutral particles into size classi. The sinks include (1) the coagulation sink (CoagSi; cf. Eq. A6) describing the loss of the recombined neutral particles to the background neutral particles, (2) the charging sink (CharS±i ; cf. Eq. A7) defining the number of recombined neutral parti-cles in sizeibeing charged either positively or negatively by the present ions (Hõrrak et al., 2008), and (3) the growth sink, describing the growth of recombined neutral particles out of the size classi. The balance equation for recombination is therefore:
dNreci dt =
X
j k
rj kαj kNj+Nk−+Nirec−1GRi−1
1Dp −N
rec
i (1)
CoagSi+CharS
+
i +CharS
− i + GRi 1Dp ,
where,Nirecis the number concentration of recombined neu-tral particles in size classiandrj k is a coefficient allocating the recombined neutral particles to size classi. 1DpGRi is the neutral growth rate normalized by the size bin width andNj+ andNk−are the positive and negative ion number concentra-tions, respectively. Assuming steady state condiconcentra-tions, Eq. 1 provides the number of recombined neutral particles for each size classi. Breakup of the formed clusters as proposed by Kontkanen et al. (2013) and Kulmala et al. (2013) is not taken into account in our formulation. Since the concentration of recombination products did never reach the measured neutral cluster concentration, making the determination of a breakup term impossible.
S. G. Gonser et al.: Ion – particle interactions during particle formation and growth 10551
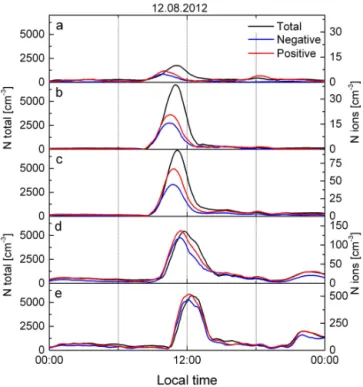
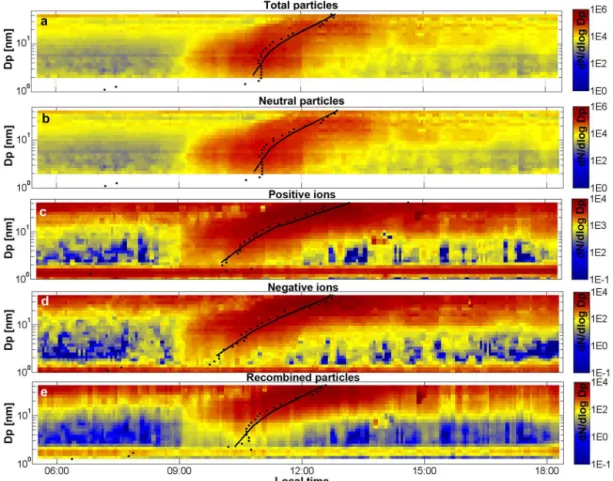
Figure 2.NPF event of 12 August 2012 as measured with the NAIS. Shown are(a)total particles,(b)neutral particles,(c)positive ions,(d)
negative ions and(e)calculated neutral particles from ion–ion recombination. Black-filled circles denote the concentration maxima for each size class, while black lines are smoothed fits in order to obtain continuous growth rates.
and the attachment of ions to the present background aerosol (cf. Eq. A8).
2.4 Formation- and growth rate
The formation rate J describes the flux of particles or ions into a defined size interval.J was calculated for every size class using Eqs. 9 and 10 from Kulmala et al. (2012).
The growth rates were also deduced for every size class, this was done separately for total particles (GRt) as well as positive (GRpos) and negative ions (GRneg). Growth rates were determined using the maximum concentration method described in detail in Sect. 6a by Kulmala et al. (2012). In order to determine the point in time of the maximum concentration (black-filled circles in Fig. 2), we applied a least square polynomial smoothing filter (Savitzky and Go-lay, 1964) to each of the NAIS size classes. Further smooth-ing of the determined times of maximum concentration re-sulted in smooth size dependent growth rates (black curves in Fig. 2). The determination of GRs from particle/ion mea-surements in the troposphere are always associated with un-certainties (Yli-Juuti et al., 2011) as the growth of a parti-cle population is a dynamic process with several
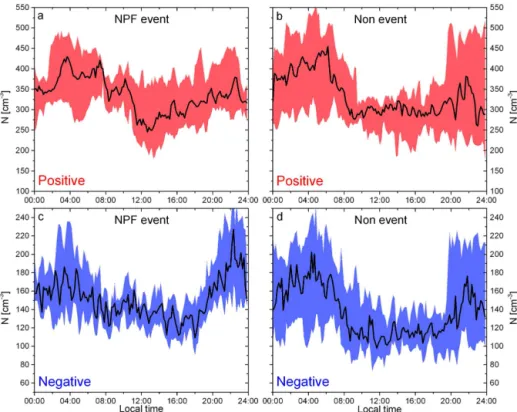
Table 1.Median, 25th and 75th percentile of cluster ion concentra-tions [cm−3] (diameter<1.6 nm) during 8 selected NPF event and 13 non-event days, measured with the NAIS during summer 2012 at the Waldstein site.
Median 25th 75th
Non-event negative 129 101 186 NPF-event negative 148 126 176 Non-event positive 314 252 422 NPF-event positive 339 285 395
3 Results
3.1 General event characteristics
Simultaneous measurements of neutral and charged clusters and particles at the Waldstein ecosystem research site from 17 June to 18 August 2012 showed a frequent occurrence of new particle formation events. Typically, the events occurred during sunny morning hours while wind directions from the east prevailed. However, several events did also occur in the afternoons and when wind directions were not from the east. A total number of 17 NPF events (28 % of measurement pe-riod) were observed, while 29 days (47 %) could not be de-fined as clear events but did still show particle formation. Non-event days were less frequent with only 15 out of 61 days. Since the measurements were taken at a fixed location, a reliable evaluation of the patterns governing the forma-tion and growth of particles were only possible in homoge-neous air masses. After careful evaluation for homogehomoge-neous air masses as described above, a total of 8 events were cho-sen for detailed analysis. Figure 2 shows a typical NPF event. Growth rates of those 8 days compare well to prior observa-tions, reporting growth rates in the range from 2.2 to 5.7 nm h−1 at the same location (Held et al., 2004). For particles in diameter range 2–3 nm median total particle growth rates (GRt), negative (GRneg) and positive growth rates (GRpos) were found to be 4.1 nm h−1, 2.4 nm h−1 and 2.8 nm h−1, respectively. Median formation rates J for 2–3 nm parti-cles were in the order of 3.5 cm−3s−1, 0.015 cm−3s−1and 0.02 cm−3s−1 for total, negative and positive particles, re-spectively.
3.2 Ion concentrations and ionization rates at Waldstein The Waldstein site is located in the Fichtelgebirge mountain range, NE Bavaria. The Fichtelgebirge is known for its en-hanced background radioactive radiation levels. In particu-lar, radon is elevated, reaching soil gas activity concentra-tions of up to 4000 kBq m−3 (Kemski et al., 2001; Lüers et al., 2007). As the primary sources for atmospheric ions are radon decay, gamma radiation and cosmic radiation (Hir-sikko et al., 2011), ion concentrations and ionization ratesQ are expected to be elevated at the Waldstein site. The
S. G. Gonser et al.: Ion – particle interactions during particle formation and growth 10553
Figure 3.Median diurnal variation of cluster ion concentrations (diameter < 1.6 nm) during 8 selected NPF event days(a, c)and 13 non-event days(b, d), as measured with the NAIS during summer 2012 at the Waldstein site. The shaded areas denote the 25th and 75th percentile.
Table 2.Event features of all 8 selected NPF events used for this study. Shown are the following: NPF event start time (CET), prevailing wind direction, time difference1tof 2–3 nm ions [min.], growth rates GR of 2–3 nm total particles and ions [nm h−1], formation ratesJ of 2–3 nm total particles and ions [cm−3s−1] and ionization ratesQfor cluster ions [cm−3s−1]. Values forQneg,Qpos,JnegandJposare probably underestimated, please refer to Sect. 3.2 for detail.
Date Start Wind 1tneg 1tpos GRt GRneg GRpos Jt Jneg Jpos Qneg Qpos sector
17 June 2012 13:00 LT W 20 5 2.8 6.3 3.2 0.4 0.02 0.02 0.4 0.4 19 June 2012 12:00 LT E −62 0 1.5 2 1.9 0.4 0.002 0.006 0.5 0.7 4 July 2012 09:30 LT E 33 22 2.9 2.4 2.3 0.5 0.006 0.007 0.7 0.9 23 July 2012 07:30 LT E 102 97 5.3 1.5 1.4 5 0.02 0.02 0.9 1 24 July 2012 08:30 LT E 67 42 9 2.4 3.7 2.3 0.004 0.01 0.8 0.9 12 August 2012 08:30 LT E 53 38 6.9 3.2 3.8 4.7 0.02 0.04 1.1 1.2 13 August 2012 07:30 LT E 17 13 6 3.5 4.4 5.2 0.02 0.05 1.3 1.6 17 August 2012 08:30 LT E 10 5 1.6 1.6 1.8 5.2 0.01 0.02 0.8 0.8
Median – – 26.5 17.5 4.1 2.4 2.75 3.5 0.015 0.02 0.8 0.9
3.3 Time difference
In all 8 evaluated NPF events, 2 nm ions (NAIS size bin limits were 1.8–2.1 nm) showed a concentration increase before the concentrations of total particles of the same size increased. Figure 4a shows the course of concentration for 2 nm total particles and ions for an exemplary NPF event on 12 Au-gust 2012. The occurrence of an earlier ion formation prior to total particle formation seems to be a typical pattern dur-ing NPF. Manninen et al. (2010) report of NAIS
Figure 4.Temporal evolution of total particle concentrations as well as positive and negative ion concentrations in diameter ranges of
(a)1.8–2.1 nm,(b) 3.7–4.3 nm,(c)7.6–8.8 nm,(d) 13.6–15.7 nm and (e)21.1–24.5 nm. The data originates from single NAIS size channels, measured during the NPF event on 12 August 2012 at Waldstein. Ion concentrations increase during the growth process, while total particle concentrations increase rapidly at the beginning of NPF but begin to decrease at diameters above 8 nm. Note that the ion concentrations (right axes) are always smaller than the par-ticle concentrations (left axes). Data was smoothed for illustrational purpose.
particles, a cross-correlation analysis was performed individ-ually for each size class. Cross-correlation analysis is a stan-dard procedure to analyze time shifts in two time series. The result of the cross-correlation analysis can be seen in Fig. 5. For small particles,1tis largest and sharply decreases as the particle diameter increases, eventually reaching 1t=0 for
diameters of about 20 nm. Therefore, the total particles seem to grow faster than ions after the onset of a NPF event, as1t becomes smaller during the growth process.
3.4 Growth rates
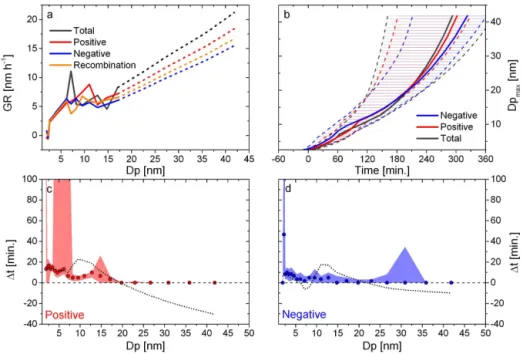
Due to the decrease of 1t during NPF, GRt is expected to differ from GRneg and GRpos, especially when considering small particle diameters. In fact, our analysis yields an in-creased GRtcompared to GRnegand GRpos. At this point, it should be mentioned once more that the growth rates above an ion/particle diameter of 20 nm are most probably overes-timated by the maximum concentration method. Figure 6a
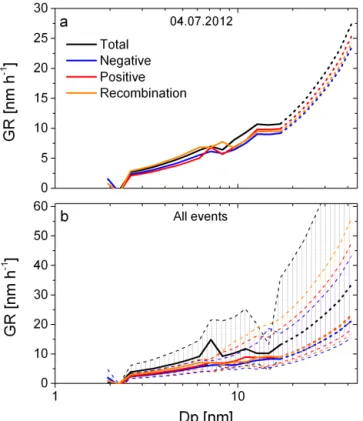
shows the growth rates for the NPF event on 4 July 2012. GRneg and GRpos are similar to each other, while the to-tal particles grow faster. Fig. 6b shows the median growth rates of all 8 regional NPF events. An enhanced GRt is ev-ident in the median values. The enhanced GRt compared to charged particle growth rates deviates from theories for pure condensational growth, where the presence of a charge en-hances the growth rates of small and intermediate ions (e.g., Yu and Turco, 2000; Yue and Chan, 1979). Therefore, con-densational growth on its own cannot explain the apparent GR differences. To further support our observations at the Waldstein site, we analyzed additional data recorded with a NAIS instrument during summer 2008 at the “Melpitz” field site in NW Saxony, Germany. In these data, the same patterns are found:1t decreases during the growth process and total particles show an enhanced growth rate compared to ions. As the determination of the growth rates is always connected to some error, the enhancement of GRtover to GRnegand GRpos cannot be regarded as significant, but still it is considered to be plausible.
3.5 Recombination
The number size distributions deduced from ion–ion recom-bination as described by Eq. 1 are generally comparable to the measured total particle distributions. However, the result-ing absolute concentrations of particles from ion–ion recom-bination are one to three orders of magnitude smaller than the observed total particle distributions. Particularly, when diam-eters below 10 nm are considered, recombination cannot ex-plain the abundance of total particles (cf. Fig. 2). This may be partly due to the performance of the NAIS. As described in Sect. 3.2 ion concentrations in our study are generally un-derestimated, while an overestimation of total particle con-centrations is a typical property of NAIS instruments (Gagné et al., 2011). Therefore, the absolute values are not taken into consideration for our study. Nevertheless, the recombination gives valuable information regarding the growth behavior of neutral particles. A measure which can still be used for our analysis is the growth rate of the recombination products (GRrec). As mentioned above, GRtis elevated at small par-ticle diameters compared to GRneg and GRpos. GRrecseems to behave similar to GRtas can be seen in Figs. 2 and 6. For most of the NPF events considered in our study, GRrecis well above GRneg and GRpos (Fig. 6b) and sometimes matches GRtquite well (Fig. 6a).
4 Discussion
S. G. Gonser et al.: Ion – particle interactions during particle formation and growth 10555
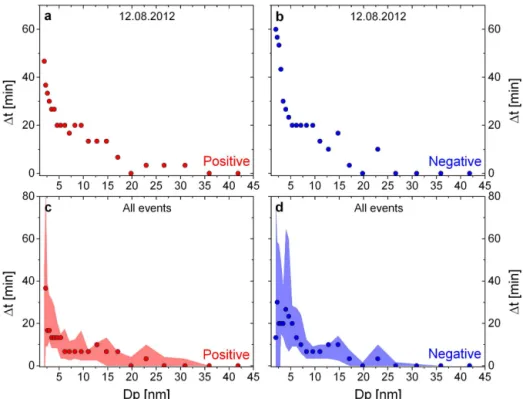
Figure 5.Results from the cross-correlation study showing the size-dependence of the time difference (1t). Appearance of(a)positive and
(b)negative ions compared to total particles measured with NAIS on 12 August 2012, and median values of1tfor all 8 selected NPF event days for(c)positive and(d)negative ions. Shaded area denote the 25th and 75th percentile.
neutral clusters and particles. The initial ion-induced nucle-ation (IIN) typically happens about 20–30 min before the first appearance of neutral particles (Fig. 5c, d; Table 2) at Wald-stein. This observation can most likely be explained by the higher stability of charged clusters over neutral ones at a cer-tain precursor gas saturation ratio (Enghoff and Svensmark, 2008; Yue and Chan, 1979). Furthermore, charged clusters clearly activate more easily and grow more quickly (e.g., Lushnikov and Kulmala, 2004; Winkler et al., 2008; Yu and Turco, 2000). Keeping this in mind and assuming no ion– ion and ion–particle interactions, the time difference between an earlier occurring ion fraction and the total particle frac-tion during the growth process should increase or remain constant. However, our measurements show a contrary be-havior: once formed, the neutral particles grow considerably faster than the ion fraction, and eventually, the earlier occur-rence of the ions vanishes completely. A possible explana-tion for the slower ion GR could be the diurnal variaexplana-tion of gas phase precursors like sulfuric acid or oxidation products of volatile organic compounds (VOCs). In the early morning hours, when the first intermediate ions are formed, the pre-cursor gas concentrations are expected to be low. On sunny days, as were most of the considered event days, the precur-sor gas concentration will increase during the day. This is due to increasing VOC emissions from the forest with rising air temperature, as well as due to photochemical processes leading to the formation of sulfuric acid and oxidation of
VOCs. Therefore, the neutral particle growth which occurs later could be enhanced due to higher concentrations of pre-cursor gases.
Additionally, ion–ion and ion–particle interactions en-hance neutral particle GRs. As the potential precursor gases were not measured in this study, the focus to explain our ob-servation will be on ion–particle interaction processes. Nev-ertheless, it is not expected that the observations can be ex-plained fully by ion–particle interactions.
Considering ion–particle interactions by applying theoret-ical parameterizations of the attachment and recombination processes to the combined NAIS and mobility particle size spectrometer measurements, we obtained the ion-mediated or -recombined fraction of neutral particles. NAIS number concentration measurements are subject to uncertainties both for ions and total particles (Asmi et al., 2009; Gagné et al., 2011). However, growth rate analyses are not influenced by the uncertainties in NAIS number concentrations. Therefore, we chose GRrecdeduced from the calculated recombination number size distribution as a measure for the influence of ions on neutral particle formation.
Figure 6.Growth rates of negative ions, positive ions and total par-ticles determined from NAIS measurements,(a)for a single event on 4 July 2012 and(b)median values for all 8 selected NPF events used for this study. Hatched areas denote the 25th and 75th per-centile. Additionally, GRrec deduced from ion–ion recombination is shown in orange. Dashed segments of the curves denote inaccu-rate growth inaccu-rates.
20 min (Fig. 7) and (2) initial 1t is smaller than 20 min (Fig. 8).
Median values of four NPF events (4 July; 23 July; 24 July; 12 August 2012; cf. Table 2) with 1t > 20 min are shown in Fig. 7. The large differences in the growth rates for ions and total particles (Fig. 7a) are remarkable. While GRneg and GRposare as expected for small diameters, GRt for small total particles is strongly elevated (cf. Table 2). This strong growth is maintained until a sharp drop for di-ameters above 10 nm is evident. The unusual sharpness of the decrease can most likely be attributed to limitations of the maximum concentration method and the inversion rou-tine of the NAIS. Nevertheless, qualitatively the decrease in GRt is considered real, indicating a change in the prevail-ing growth conditions. Figure 7b shows the time evolution of the growing mode’s diameter of maximum concentration (Dpmax) for both ion polarities as well as for total particles. More specifically,Dpmaxis the result of the maximum con-centration method for the determination of the growth rates (cf. black lines in Fig. 2). The origin of the horizontal axis (time=0) indicates the first appearance of the total particle
growing mode. The time of initial ion appearance is offset
by the median of1t at 2 nm for positive and negative ions, respectively (cf. Fig. 7c, d). The initial offset of the ion grow-ing mode is about 60 min. As total particles exhibit a higher GRt, their growing mode finally reaches the sameDpmaxas the ion modes, about 40 to 60 min after the first appearance of total particles.
Figure 7c and d show the time difference (1t) in occur-rence of ions compared to total particles.1texhibits a rapid decrease as the particles grow. Eventually, for particle diam-eters above 10 nm, the advance of ions is fairly small and continues to decreases at a slower rate, to approach1t=0
at about 20 nm. Additionally, Fig. 7c and d show the inde-pendently derived time difference between the negative and positiveDpmaxto the total one (cf. Fig. 7c, d as black dot-ted lines). Basically, this is a comparison of1tderived from the cross-correlation method with the time difference derived from the maximum concentration method. The general pat-terns of these time differences are very similar: the rapid de-crease of 1t is clearly evident until particle diameters of about 10 nm are reached. For greater particle diameters the time differences ofDpmaxbecome negative, indicating a per-sistently enhanced growth rate of the total particle growing mode. However, our data do not show an advance of the total growing mode compared to the ion modes (cf. Figs. 4, 5 and 7c, d). This discrepancy may be explained by the increasing uncertainty associated with the growth rate determination for larger diameters.
Median values for four NPF events with1t < 20 min (17 June; 19 June; 13 August; 17 August 2012; cf. Table 2) are shown in Fig. 8. The median growth rates for these events (Fig. 8a) are significantly lower compared to the high growth rates presented in Fig. 7. Additionally, there is no visible dif-ference in GRneg, GRposand GRt. They exhibit similar values throughout the whole growth process (cf. Table 2). Typically, 2 nm positive and negative ions show an earlier appearance (1t) of about 15 and 10 min, respectively (Fig. 8c, d). The decrease of1t during the growth process is relatively slow. Nevertheless, the diameter at which1t approaches zero is still at about 20 nm. The time needed for the total particle mode to grow to this size is approximately 200 min (Fig. 8b). The time difference deduced fromDpmaxbecomes negative at a diameter of about 20 nm, supporting the assumption that growth rates above this diameter are overestimated. As1t shows a slow decrease during the growth process, GRtshould be slightly enhanced compared to GRnegand GRpos. This is not visible in our data. Presumably, the accuracy of the ap-plied growth rate determination is not sufficient to resolve such slight differences.
S. G. Gonser et al.: Ion – particle interactions during particle formation and growth 10557
Figure 7.Median evolution of ions and particles for four NPF events with1t> 20 min.(a)GR for total, positive, negative and recombined particles.(b)Time evolution of the growing modes (Dpmax)of negative, positive and total particles, respectively. Hatched areas denote the 25th and 75th percentiles.(c, d)Time difference (1t) for negative and positive ions, respectively. Dotted black lines are time differences calculated from the negative and positive growing mode to the total one, in principle this is the difference between the threeDpmax-values from section b).
Figure 8.Same as Fig. 7 but for four NPF events with1t< 20 min.
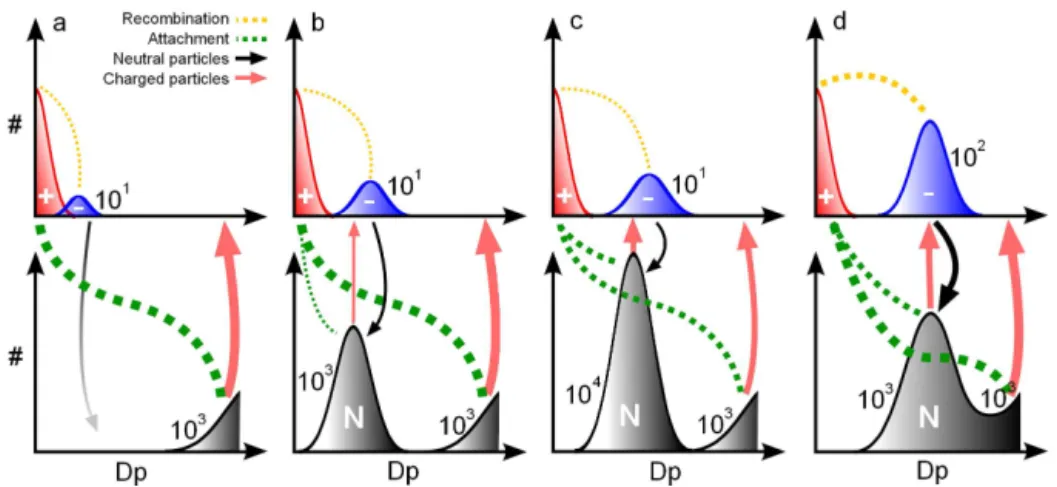
purposes, we will focus on the ion attachment (green dashed lines) and the recombination of cluster ions with the growing ion mode (yellow dashed lines) and neglect the recombina-tion of cluster ions with each other.
At the onset of NPF (Fig. 9a), first particles are formed in the ion fraction, exhibiting concentrations in the order of
Figure 9.Conceptual model of the influence of cluster ion recombination and attachment at different stages of particle nucleation and growth
(a–d). Permanently available positive cluster ions are denoted in red, the negative growing mode in blue and neutral particle modes in black. The black and red arrows denote the generation of neutral and charged particles, respectively. The size of the arrows and dashed lines denotes the prevailing mechanism. Numerals indicate the orders of magnitude of the number concentrations of the respective modes.
coefficient β at 100 nm (cf. Fig. 1, yellow and green solid lines), the probabilities for cluster ions to interact with the growing ion mode and with the neutral background particles are approximately the same. As the background aerosol is more numerous than the freshly nucleated ion mode, attach-ment to the background particles dominates over recombina-tion. Hence, only a very small number of neutral particles are formed by recombination.
Once precursor gas phase components are available in a sufficient quantity for neutral nucleation (cf. Almeida et al., 2013; Kulmala et al., 2013; Schobesberger et al., 2013), a strong nucleation burst of neutral particles occurs (Fig. 9b). The freshly nucleated neutral mode has a very small mean diameter (e.g., 1.5–2 nm) and shows typical concentrations in the order of 103cm−3. The background particle num-ber size distribution stays mostly unchanged (Dp >100 nm; 103cm−3). Now, the neutral nucleation mode and the back-ground particles are available for the attachment of cluster ions. Meanwhile, the ion mode has grown to a greater diam-eter (e.g., 4 nm), exhibiting only a slightly enhanced number concentration still in the order of 101cm−3.βfor cluster ion attachment to the background particles is elevated by 2 or-ders of magnitude compared to the neutral nucleation mode (cf. Fig. 1). Therefore, cluster ion attachment to the back-ground particles dominates over the attachment to the neutral nucleation mode, as both modes have similar concentrations. On the other hand, αfor cluster ions with the growing ion mode is elevated by 2 orders of magnitude compared toβ for the neutral growing mode. As the neutral mode exhibits approximately 2 orders of magnitude more particles, the ab-solute number of cluster ions recombining with the ion mode is comparable to the number of ions attaching to the neu-tral mode. In other words, background particles are charged strongly (bold red arrow), the neutral nucleation mode ex-periences moderate charging (red arrow), and the formation
of neutral particles by recombination is also moderate (black arrow). This moderate formation of somewhat greater neu-tral particles from recombination contributes to the growth of the neutral mode. On the other hand, the ions formed by at-tachment to the neutral mode are somewhat smaller than the mean ion mode diameter, and contribute to a slower growth of the ion mode. The absolute production of neutral and charged particles by this mechanism depends on the concen-tration of cluster ions as well as on the concenconcen-tration of the growing ion- and neutral modes, and is thought to be in the order of 0.01 cm−3s−1.
As the growth continues, the neutral particle mode reaches a number concentration peak (order of 104cm−3)at diame-ters of approximately 4–5 nm (Fig. 9c). Due to the high con-centration, the attachment probability of cluster ions to the neutral nucleation mode and the background particles is sim-ilar (green dashed lines). Meanwhile, the ion mode has grown further (e.g., 6 nm diameter), and is slightly more numerous but still in the order of 101cm−3. Therefore, recombination is somewhat enhanced compared to stage (b). Nevertheless, the neutral nucleation mode experiences a stronger loss of par-ticles due to attachment of cluster ions. As a result, the con-centration of the growing ion mode is further enhanced by the addition of somewhat smaller charged particles. Again, the loss of ions (due to recombination) and the addition of newly formed smaller ions (due to attachment) results in an apparent growth rate reduction of the ion mode. On the other hand, the concentration of the neutral mode is constantly re-duced, while its growth rate stays elevated.
S. G. Gonser et al.: Ion – particle interactions during particle formation and growth 10559 recombination to the ion and neutral growing modes. As
the neutral particles (formed from recombination) and the charged particles (formed from attachment) have approxi-mately the same diameter, an enhancement or slowing of the growth rates is not expected. This results in an equilibrium state where ions and neutral particles grow at similar rates.
5 Conclusions
Data from 8 NPF events measured with the NAIS at the Waldstein site showed an earlier appearance of the ion modes in the beginning of NPF and a higher initial growth rate of the delayed total particle mode in comparison to the ion modes. The enhanced growth of the total particle mode does eventu-ally result in the disappearance of the ion’s advance. To our knowledge, such differences of ion and total growth rates in the initial stages of cluster growth have not been presented before. Therefore, it is an interesting yet open question if these observations are just a special feature of the Waldstein site, or if they can also be found elsewhere. An earlier ap-pearance of the ion mode is plausible, as ions reduce the critical cluster size and facilitate the cluster activation (e.g., Lushnikov and Kulmala, 2004; Winkler et al., 2008; Yu and Turco, 2000; Yue and Chan, 1979). To, at least partly, explain the difference in the growth rates we have proposed a mech-anism including ion–ion recombination and ion–particle at-tachment (cf. Fig. 9).
Appendix A
According to Tammet and Kulmala (2005), the size depen-dent coagulation coefficient Kijis defined as
Kij=
2π kT Bi+Bj
Di+Dj+2h
1+γ− 0.299γ γ1.1+0.64+γ
1−p p
, (A1)
where
γ =2 Bi+Bj Di+Dj+2h
s
2π kT mimj mi+mj
. (A2)
Here,kis the Boltzmann constant [1.38×10⁻²³JK−1],T is the absolute temperature [K],B is the particle’s mechanic mobility [m N−1s−1] (Hinds, 1999), D is the particle di-ameter [m], the sticking probability p was assumed to be one, and m is the mass of an individual particle [kg]. To ac-count for van der Waals interactions, an extra distance h=
0.115×10⁻⁹m is necessary (Tammet and Kulmala, 2005).
The variability of the size-dependent coagulation coefficient due to a 20 % change in B, a doubling and a reduction to 50 % of hand the variation of p between 0.5 and 1 is de-picted as shaded areas in Fig. 1. The sticking probability ex-hibits the most pronounced influence on the values of Kij, while the other two variables only show a minor effect.
An approximation for the size dependent attachment coef-ficientβij is given by Hõrrak et al. (2008):
βij=
2π DikT Zj e
x
exp(x)−1 (A3)
s
1− 2
2+n (n−1)+Di/ (10 nm) ,
where,
x= ne
2
2π Diε0kT
. (A4)
Here, Z is the electric mobility of the ion provided by the NAIS [m2V−1s−1],eis the elementary electric charge [1.6×10⁻¹⁹C],nis the number of elementary charges car-ried by a charged particle, and ε0 is the electric constant [8.85×10⁻¹²F m−1]. The variability ofβijwas assessed by varying Z in the range of the bin width of the respective NAIS size channel (cf. Fig. 1).
For the interaction of oppositely charged ions of sizej and k, a size dependent recombination coefficientα can be de-scribed by the attachment coefficientβij (Hoppel and Frick, 1986). Therefore, the recombination coefficient (αj k)is de-fined equally to the attachment coefficient, but only for op-positely charged ions:
αj k=βj k. (A5)
The coagulation sink is calculated according to Kulmala et al. (2012):
CoagSi= l=max
X
l=i
KilNl, (A6)
where Nl is the number concentration of the background aerosol [cm−3] in the size classl.
The calculation of the charging sink follows Eq. (3) from Hõrrak et al. (2008):
CharS±i =piX j
βijNj±, (A7)
where,pi is the probability of a neutral particle in size class ito carry one elementary charge andNj±is the number con-centration of positive or negative ions in size classj [cm−3]. Hoppel and Frick (1986) proposed a simplified balance equation for the cluster ion production rate. For our work, we use a slightly altered version, not assuming symmetric concentrations of positive and negative small ions and con-sidering size-dependent attachment and recombination coef-ficients. The balance equation for the ionization rateQ±is
defined as: dN±<1.6 nm
dt =Q
±−X j k
αj kNj+Nk−− X
ij
βijpiNiNj±, (A8)
where size classesjandk <1.6 nm,Nj+andNk−are positive and negative ion concentrations in size classj andk[cm−3], Ni is the concentration of neutral particles in size class i [cm−3] andN<1.6 nm± is the number concentration of positive or negative ions with a diameter below 1.6 nm [cm−3].
Acknowledgements. This work was funded by the German
Re-search Foundation grant DFG HE5214/3-1. The authors gratefully acknowledge Xuemeng Chen, Stephanie Gagné and Sander Mirme for helpful advice and discussions.
S. G. Gonser et al.: Ion – particle interactions during particle formation and growth 10561 References
Asmi, E., Sipilä, M., Manninen, H. E., Vanhanen, J., Lehtipalo, K., Gagné, S., Neitola, K., Mirme, A., Mirme, S., Tamm, E., Uin, J., Komsaare, K., Attoui, M., and Kulmala, M.: Results of the first air ion spectrometer calibration and intercomparison workshop, Atmos. Chem. Phys., 9, 141–154, doi:10.5194/acp-9-141-2009, 2009.
Almeida, J., Schobesberger, S., Kürten, A., Ortega, I. K., Kupiainen-Määttä, O., Praplan, A. P., Adamov, A., Amorim, A., Bianchi, F., Breitenlechner, M., David, A., Dommen, J., Donahue, N. M., Downard, A., Dunne, E., Duplissy, J., Ehrhart, S., Flagan, R. C., Franchin, A., Guida, R., Hakala, J., Hansel, A., Heinritzi, M., Henschel, H., Jokinen, T., Junni-nen, H., Kajos, M., Kangasluoma, J., KeskiJunni-nen, H., Kupc, A., Kurtén, T., Kvashin, A. N., Laaksonen, A., Lehtipalo, K., Leiminger, M., Leppä, J., Loukonen, V., Makhmutov, V., Mathot, S., McGrath, M. J., Nieminen, T., Olenius, T., On-nela, A., Petäjä, T., Riccobono, F., Riipinen, I., Rissanen, M., Rondo, L., Ruuskanen, T., Santos, F. D., Sarnela, N., Schall-hart, S., Schnitzhofer, R., Seinfeld, J. H., Simon, M., Sipilä, M., Stozhkov, Y., Stratmann, F., Tomé, A., Tröstl, J., Tsagkogeor-gas, G., Vaattovaara, P., Viisanen, Y., Virtanen, A., Vrtala, A., Wagner, P. E., Weingartner, E., Wex, H., Williamson, C., Wim-mer, D., Ye, P., Yli-Juuti, T., Carslaw, K. S., Kulmala, M., Cur-tius, J., Baltensperger, U., Worsnop, D. R., Vehkamäki, H., and Kirkby, J.: Molecular understanding of sulphuric acid-amine particle nucleation in the atmosphere, Nature, 502, 359–363, doi:10.1038/nature12663, 2013.
Enghoff, M. B. and Svensmark, H.: The role of atmospheric ions in aerosol nucleation – a review, Atmos. Chem. Phys., 8, 4911– 4923, doi:10.5194/acp-8-4911-2008, 2008.
Fuchs, N. A.: On the stationary charge distribution on aerosol par-ticles in a bipolar ionic atmosphere, Geofis. Pura E Appl., 56, 185–193, doi:10.1007/BF01993343, 1963.
Gagné, S., Nieminen, T., Kurtén, T., Manninen, H. E., Petäjä, T., Laakso, L., Kerminen, V.-M., Boy, M., and Kulmala, M.: Fac-tors influencing the contribution of ion-induced nucleation in a boreal forest, Finland, Atmos. Chem. Phys., 10, 3743–3757, doi:10.5194/acp-10-3743-2010, 2010.
Gagné, S., Lehtipalo, K., Manninen, H. E., Nieminen, T., Schobes-berger, S., Franchin, A., Yli-Juuti, T., Boulon, J., Sonntag, A., Mirme, S., Mirme, A., Hõrrak, U., Petäjä, T., Asmi, E., and Kul-mala, M.: Intercomparison of air ion spectrometers: an evaluation of results in varying conditions, Atmos. Meas. Tech., 4, 805–822, doi:10.5194/amt-4-805-2011, 2011.
Held, A., Nowak, A., Birmili, W., Wiedensohler, A., Forkel, R., and Klemm, O.: Observations of particle formation and growth in a mountainous forest region in central Europe, J. Geophys. Res., 109, D23204, doi:10.1029/2004JD005346, 2004.
Hinds, W. C.: Aerosol technology: properties, behavior, and mea-surement of airborne particles, Wiley, New York, 1999. Hirsikko, A., Nieminen, T., Gagné, S., Lehtipalo, K.,
Manni-nen, H. E., Ehn, M., Hõrrak, U., KermiManni-nen, V.-M., Laakso, L., McMurry, P. H., Mirme, A., Mirme, S., Petäjä, T., Tammet, H., Vakkari, V., Vana, M., and Kulmala, M.: Atmospheric ions and nucleation: a review of observations, Atmos. Chem. Phys., 11, 767–798, doi:10.5194/acp-11-767-2011, 2011.
Hoppel, W. A. and Frick, G. M.: Ion–aerosol attachment co-efficients and the steady-state charge distribution on aerosols
in a bipolar ion environment, Aerosol Sci. Tech., 5, 1–21, doi:10.1080/02786828608959073, 1986.
Hoppel, W. A. and Frick, G. M.: The nonequilibrium character of the aerosol charge distributions produced by neutralizes, Aerosol Sci. Tech., 12, 471–496, doi:10.1080/02786829008959363, 1990.
Hõrrak, U., Aalto, P. P., Salm, J., Komsaare, K., Tammet, H., Mäkelä, J. M., Laakso, L., and Kulmala, M.: Variation and bal-ance of positive air ion concentrations in a boreal forest, Atmos. Chem. Phys., 8, 655–675, doi:10.5194/acp-8-655-2008, 2008. Iida, K., Stolzenburg, M., McMurry, P., Dunn, M. J., Smith, J. N.,
Eisele, F., and Keady, P.: Contribution of ion-induced nucleation to new particle formation: methodology and its application to at-mospheric observations in Boulder, Colorado, J. Geophys. Res., 111, D23201, doi:10.1029/2006JD007167, 2006.
Kemski, J., Siehl, A., Stegemann, R., and Valdivia-Manchego, M.: Mapping the geogenic radon potential in Germany, Sci. Total Environ., 272, 217–230, doi:10.1016/S0048-9697(01)00696-9, 2001.
Kontkanen, J., Lehtinen, K. E. J., Nieminen, T., Manninen, H. E., Lehtipalo, K., Kerminen, V.-M., and Kulmala, M.: Estimating the contribution of ion–ion recombination to sub-2 nm cluster concentrations from atmospheric measurements, Atmos. Chem. Phys., 13, 11391–11401, doi:10.5194/acp-13-11391-2013, 2013. Kulmala, M. and Kerminen, V.-M.: On the formation and growth of atmospheric nanoparticles, Atmos. Res., 90, 132–150, doi:10.1016/j.atmosres.2008.01.005, 2008.
Kulmala, M., Vehkamäki, H., Petäjä, T., Dal Maso, M., Lauri, A., Kerminen, V.-M., Birmili, W., and McMurry, P. H.: For-mation and growth rates of ultrafine atmospheric particles: a review of observations, J. Aerosol Sci., 35, 143–176, doi:10.1016/j.jaerosci.2003.10.003, 2004a.
Kulmala, M., Laakso, L., Lehtinen, K. E. J., Riipinen, I., Dal Maso, M., Anttila, T., Kerminen, V.-M., Hõrrak, U., Vana, M., and Tammet, H.: Initial steps of aerosol growth, At-mos. Chem. Phys., 4, 2553–2560, doi:10.5194/acp-4-2553-2004, 2004b.
Kulmala, M., Petäjä, T., Nieminen, T., Sipilä, M., Manni-nen, H. E., Lehtipalo, K., Dal Maso, M., Aalto, P. P., Junni-nen, H., PaasoJunni-nen, P., RiipiJunni-nen, I., LehtiJunni-nen, K. E. J., Laakso-nen, A., and KermiLaakso-nen, V.-M.: Measurement of the nucleation of atmospheric aerosol particles, Nat. Protoc., 7, 1651–1667, doi:10.1038/nprot.2012.091, 2012.
Kulmala, M., Kontkanen, J., Junninen, H., Lehtipalo, K., Man-ninen, H. E., Nieminen, T., Petaja, T., Sipila, M., Schobes-berger, S., Rantala, P., Franchin, A., Jokinen, T., Jarvinen, E., Aijala, M., Kangasluoma, J., Hakala, J., Aalto, P. P., Paaso-nen, P., Mikkila, J., VanhaPaaso-nen, J., Aalto, J., Hakola, H., Makko-nen, U., RuuskaMakko-nen, T., Mauldin, R. L., Duplissy, J., Vehka-maki, H., Back, J., Kortelainen, A., Riipinen, I., Kurten, T., Johnston, M. V., Smith, J. N., Ehn, M., Mentel, T. F., Lehtinen, K. E. J., Laaksonen, A., Kerminen, V.-M., and Worsnop, D. R.: Direct observations of atmospheric aerosol nu-cleation, Science, 339, 943–946, doi:10.1126/science.1227385, 2013.
measure-ments, Atmos. Chem. Phys., 7, 1333–1345, doi:10.5194/acp-7-1333-2007, 2007.
Leppä, J., Anttila, T., Kerminen, V.-M., Kulmala, M., and Lehti-nen, K. E. J.: Atmospheric new particle formation: real and ap-parent growth of neutral and charged particles, Atmos. Chem. Phys., 11, 4939–4955, doi:10.5194/acp-11-4939-2011, 2011. Lüers, J., Smaczny, J., Kies, A., and Bareiss, J.: Dynamik der
Austauschprozesse von CO2 und Radon zwischen Waldboden, Waldbestand und Atmosphäre, Berichte Meteorol. Institutes Uiv-ersität Freiburg, 16, 147–52, 2007.
Lushnikov, A. A. and Kulmala, M.: Charging of aerosol particles in the near free-molecule regime, Eur. Phys. J.-Atmos. Mol. Opt. Plasma Phys., 29, 345–355, doi:10.1140/epjd/e2004-00047-9, 2004.
Makkonen, R., Asmi, A., Kerminen, V.-M., Boy, M., Arneth, A., Hari, P., and Kulmala, M.: Air pollution control and decreas-ing new particle formation lead to strong climate warmdecreas-ing, At-mos. Chem. Phys., 12, 1515–1524, doi:10.5194/acp-12-1515-2012, 2012.
Manninen, H. E., Nieminen, T., Riipinen, I., Yli-Juuti, T., Gagné, S., Asmi, E., Aalto, P. P., Petäjä, T., Kerminen, V.-M., and Kul-mala, M.: Charged and total particle formation and growth rates during EUCAARI 2007 campaign in Hyytiälä, Atmos. Chem. Phys., 9, 4077–4089, doi:10.5194/acp-9-4077-2009, 2009a. Manninen, H. E., Petaja, T., Asmi, E., Riipinen, I., Nieminen, T.,
Mikkila, J., Horrak, U., Mirme, A., Mirme, S., Laakso, L., Ker-minen, V.-M., and Kulmala, M.: Long-term field measurements of charged and neutral clusters using Neutral cluster and Air Ion Spectrometer (NAIS), Boreal Environ. Res., 14, 591–605, 2009b. Manninen, H. E., Nieminen, T., Asmi, E., Gagné, S., Häkkinen, S., Lehtipalo, K., Aalto, P., Vana, M., Mirme, A., Mirme, S., Hõr-rak, U., Plass-Dülmer, C., Stange, G., Kiss, G., Hoffer, A., Törö, N., Moerman, M., Henzing, B., de Leeuw, G., Brinken-berg, M., Kouvarakis, G. N., Bougiatioti, A., Mihalopoulos, N., O’Dowd, C., Ceburnis, D., Arneth, A., Svenningsson, B., Swi-etlicki, E., Tarozzi, L., Decesari, S., Facchini, M. C., Birmili, W., Sonntag, A., Wiedensohler, A., Boulon, J., Sellegri, K., Laj, P., Gysel, M., Bukowiecki, N., Weingartner, E., Wehrle, G., Laakso-nen, A., Hamed, A., Joutsensaari, J., Petäjä, T., KermiLaakso-nen, V.-M., and Kulmala, M.: EUCAARI ion spectrometer measurements at 12 European sites – analysis of new particle formation events, Atmos. Chem. Phys., 10, 7907–7927, doi:10.5194/acp-10-7907-2010, 2010.
Manninen, H. E., Franchin, A., Schobesberger, S., Hirsikko, A., Hakala, J., Skromulis, A., Kangasluoma, J., Ehn, M., Jun-ninen, H., Mirme, A., Mirme, S., Sipilä, M., Petäjä, T., Worsnop, D. R., and Kulmala, M.: Characterisation of corona-generated ions used in a Neutral cluster and Air Ion Spectrometer (NAIS), Atmos. Meas. Tech., 4, 2767–2776, doi:10.5194/amt-4-2767-2011, 2011.
Merikanto, J., Spracklen, D. V., Mann, G. W., Pickering, S. J., and Carslaw, K. S.: Impact of nucleation on global CCN, At-mos. Chem. Phys., 9, 8601–8616, doi:10.5194/acp-9-8601-2009, 2009.
Mirme, S. and Mirme, A.: The mathematical principles and design of the NAIS – a spectrometer for the measurement of cluster ion and nanometer aerosol size distributions, Atmos. Meas. Tech., 6, 1061–1071, doi:10.5194/amt-6-1061-2013, 2013.
Reischl, G. P., Mäkelä, J. M., Karch, R., and Necid, J.: Bipolar charging of ultrafine particles in the size range below 10 nm, J. Aerosol Sci., 27, 931–949, doi:10.1016/0021-8502(96)00026-2, 1996.
Savitzky, A. and Golay, M. J.: Smoothing and Differentiation of Data by Simplified Least Squares Procedures, Anal. Chem., 36, 1627, 1964.
Schobesberger, S., Junninen, H., Bianchi, F., Lönn, G., Ehn, M., Lehtipalo, K., Dommen, J., Ehrhart, S., Ortega, I. K., Franchin, A., Nieminen, T., Riccobono, F., Hutterli, M., Du-plissy, J., Almeida, J., Amorim, A., Breitenlechner, M., Dow-nard, A. J., Dunne, E. M., Flagan, R. C., Kajos, M., Keskinen, H., Kirkby, J., Kupc, A., Kürten, A., Kurtén, T., Laaksonen, A., Mathot, S., Onnela, A., Praplan, A. P., Rondo, L., Santos, F. D., Schallhart, S., Schnitzhofer, R., Sipilä, M., Tomé, A., Tsagko-georgas, G., Vehkamäki, H., Wimmer, D., Baltensperger, U., Carslaw, K. S., Curtius, J., Hansel, A., Petäjä, T., Kulmala, M., Donahue, N. M., and Worsnop, D. R.: Molecular understand-ing of atmospheric particle formation from sulfuric acid and large oxidized organic molecules, P. Natl. Acad. Sci. USA, 110, 17223–17228, doi:10.1073/pnas.1306973110, 2013.
Spracklen, D. V., Carslaw, K. S., Kulmala, M., Kerminen, V.-M., Mann, G. W., and Sihto, S.-L.: The contribution of boundary layer nucleation events to total particle concentrations on re-gional and global scales, Atmos. Chem. Phys., 6, 5631–5648, doi:10.5194/acp-6-5631-2006, 2006.
Tammet, H. and Kulmala, M.: Simulation tool for atmospheric aerosol nucleation bursts, J. Aerosol Sci., 36, 173–196, doi:10.1016/j.jaerosci.2004.08.004, 2005.
Tammet, H., Hõrrak, U., and Kulmala, M.: Negatively charged nanoparticles produced by splashing of water, Atmos. Chem. Phys., 9, 357–367, doi:10.5194/acp-9-357-2009, 2009.
Virkkula, A., Hirsikko, A., Vana, M., Aalto, P. P., Hillamo, R., and Kulmala, M.: Charged particle size distributions and analysis of particle formation events at the Finnish Antarctic research station Aboa, Boreal Environ. Res., 12, 397–408, 2007.
Wiedensohler, A.: An approximation of the bipolar charge distribu-tion for particles in the submicron size range, J. Aerosol Sci., 19, 387–389, doi:10.1016/0021-8502(88)90278-9, 1988.
Wiedensohler, A., Birmili, W., Nowak, A., Sonntag, A., Wein-hold, K., Merkel, M., Wehner, B., Tuch, T., Pfeifer, S., Fiebig, M., Fjäraa, A. M., Asmi, E., Sellegri, K., Depuy, R., Venzac, H., Villani, P., Laj, P., Aalto, P., Ogren, J. A., Swi-etlicki, E., Williams, P., Roldin, P., Quincey, P., Hüglin, C., Fierz-Schmidhauser, R., Gysel, M., Weingartner, E., Riccobono, F., Santos, S., Grüning, C., Faloon, K., Beddows, D., Harrison, R., Monahan, C., Jennings, S. G., O’Dowd, C. D., Marinoni, A., Horn, H.-G., Keck, L., Jiang, J., Scheckman, J., McMurry, P. H., Deng, Z., Zhao, C. S., Moerman, M., Henzing, B., de Leeuw, G., Löschau, G., and Bastian, S.: Mobility particle size spectrom-eters: harmonization of technical standards and data structure to facilitate high quality long-term observations of atmospheric par-ticle number size distributions, Atmos. Meas. Tech., 5, 657–685, doi:10.5194/amt-5-657-2012, 2012.
S. G. Gonser et al.: Ion – particle interactions during particle formation and growth 10563 Yli-Juuti, T., Nieminen, T., Hirsikko, A., Aalto, P. P., Asmi, E.,
Hõrrak, U., Manninen, H. E., Patokoski, J., Dal Maso, M., Petäjä, T., Rinne, J., Kulmala, M., and Riipinen, I.: Growth rates of nucleation mode particles in Hyytiälä during 2003– 2009: variation with particle size, season, data analysis method and ambient conditions, Atmos. Chem. Phys., 11, 12865–12886, doi:10.5194/acp-11-12865-2011, 2011.
Yu, F.: From molecular clusters to nanoparticles: second-generation ion-mediated nucleation model, Atmos. Chem. Phys., 6, 5193– 5211, doi:10.5194/acp-6-5193-2006, 2006.
Yu, F. and Turco, R. P.: Ultrafine aerosol formation via ion-mediated nucleation, Geophys. Res. Lett., 27, 883–886, doi:10.1029/1999GL011151, 2000.
Yu, F. and Turco, R. P.: Case studies of particle formation events observed in boreal forests: implications for nucleation mecha-nisms, Atmos. Chem. Phys., 8, 6085–6102, doi:10.5194/acp-8-6085-2008, 2008.
Yu, F. and Turco, R. P.: The size-dependent charge fraction of sub-3-nm particles as a key diagnostic of competitive nucleation mech-anisms under atmospheric conditions, Atmos. Chem. Phys., 11, 9451–9463, doi:10.5194/acp-11-9451-2011, 2011.
![Figure 1. Coagulation coefficient K, attachment coefficient β and recombination coefficient α [cm 3 s −1 ] for small cluster ions and particles (1.5 nm, solid lines) and large ions and particles (10 nm, dashed lines) as a function of ion/particle diameter](https://thumb-eu.123doks.com/thumbv2/123dok_br/16444441.197035/3.918.79.441.102.323/coagulation-coefficient-attachment-coefficient-recombination-coefficient-particles-particles.webp)
![Table 1. Median, 25th and 75th percentile of cluster ion concentra- concentra-tions [cm −3 ] (diameter < 1.6 nm) during 8 selected NPF event and 13 non-event days, measured with the NAIS during summer 2012 at the Waldstein site.](https://thumb-eu.123doks.com/thumbv2/123dok_br/16444441.197035/6.918.118.394.181.282/percentile-cluster-concentra-concentra-diameter-selected-measured-waldstein.webp)