ACPD
15, 33253–33282, 2015Time-resolved primary and secondary particle
emissions of a gasoline vehicle
P. Karjalainen et al.
Title Page
Abstract Introduction
Conclusions References
Tables Figures
◭ ◮
◭ ◮
Back Close
Full Screen / Esc
Printer-friendly Version
Interactive Discussion
Discussion
P
a
per
|
Discussion
P
a
per
|
Discussion
P
a
per
|
Discussion
P
a
per
|
Atmos. Chem. Phys. Discuss., 15, 33253–33282, 2015 www.atmos-chem-phys-discuss.net/15/33253/2015/ doi:10.5194/acpd-15-33253-2015
© Author(s) 2015. CC Attribution 3.0 License.
This discussion paper is/has been under review for the journal Atmospheric Chemistry and Physics (ACP). Please refer to the corresponding final paper in ACP if available.
Time-resolved characterization of primary
and secondary particle emissions of a
modern gasoline passenger car
P. Karjalainen1, H. Timonen2, E. Saukko1, H. Kuuluvainen1, S. Saarikoski2, P. Aakko-Saksa3, T. Murtonen3, M. Dal Maso1, E. Ahlberg4,5, B. Svenningsson5, W. H. Brune6, R. Hillamo2, J. Keskinen1, and T. Rönkkö1
1
Aerosol Physics Laboratory, Department of Physics, Tampere University of Technology, P.O. Box 692, 33101 Tampere, Finland
2
Atmospheric Composition Research, Finnish Meteorological Institute, P.O. Box 503, 00101 Helsinki, Finland
3
VTT Technical Research Centre of Finland Ltd., P.O. Box 1000, 02044 VTT, Espoo, Finland
4
Centre for Environmental and Climate research, Lund University, Box 118, 22100 Lund, Sweden
5
Division of Nuclear Physics, Lund University, Box 118, 221 00 Lund, Sweden
6
ACPD
15, 33253–33282, 2015Time-resolved primary and secondary particle
emissions of a gasoline vehicle
P. Karjalainen et al.
Title Page
Abstract Introduction
Conclusions References
Tables Figures
◭ ◮
◭ ◮
Back Close
Full Screen / Esc
Printer-friendly Version
Interactive Discussion
Discussion
P
a
per
|
Discussion
P
a
per
|
Discussion
P
a
per
|
Discussion
P
a
per
Received: 10 November 2015 – Accepted: 16 November 2015 – Published: 25 November 2015
Correspondence to: T. Rönkkö ([email protected])
ACPD
15, 33253–33282, 2015Time-resolved primary and secondary particle
emissions of a gasoline vehicle
P. Karjalainen et al.
Title Page
Abstract Introduction
Conclusions References
Tables Figures
◭ ◮
◭ ◮
Back Close
Full Screen / Esc
Printer-friendly Version
Interactive Discussion
Discussion
P
a
per
|
Discussion
P
a
per
|
Discussion
P
a
per
|
Discussion
P
a
per
|
Abstract
Changes in traffic systems and vehicle emission reduction technologies significantly
affect traffic-related emissions in urban areas. In many densely populated areas the
amount of traffic is increasing, keeping the emission level high or even increasing. To
understand the health effects of traffic related emissions, both primary and secondary
5
particles that are formed in the atmosphere from gaseous exhaust emissions need to be characterized. In this study we used a comprehensive set of measurements to characterize both primary and secondary particulate emissions of a modern gasoline passenger car. Our aerosol particle study covers the whole process chain in emission
formation, from the engine to the atmosphere, and takes into account also differences
10
in driving patterns. We observed that in mass terms, the amount of secondary parti-cles was 13 times higher than the amount of primary partiparti-cles. The formation,
compo-sition, number, and mass of secondary particles was significantly affected by driving
patterns and engine conditions. The highest gaseous and particulate emissions were observed at the beginning of the test cycle when the performance of the engine and
15
the catalyst was below optimal. The key parameter for secondary particle formation was the amount of gaseous hydrocarbons in primary emissions; however, also the pri-mary particle population had an influence. Thus, in order to enhance human health and wellbeing in urban areas, our study strongly indicates that in future legislation, special attention should be directed into the reduction of gaseous hydrocarbons.
20
1 Introduction
Vehicular emissions deteriorate the air quality locally (Wehner et al., 2002; Pirjola et al., 2012; Lähde et al., 2014) and contribute significantly to the air pollution levels in urban areas. Air pollution components like particulate matter contribute to adverse health ef-fects of people (e.g. Pope III and Dockery, 2006). The human exposure on pollutants
25
ad-ACPD
15, 33253–33282, 2015Time-resolved primary and secondary particle
emissions of a gasoline vehicle
P. Karjalainen et al.
Title Page
Abstract Introduction
Conclusions References
Tables Figures
◭ ◮
◭ ◮
Back Close
Full Screen / Esc
Printer-friendly Version
Interactive Discussion
Discussion
P
a
per
|
Discussion
P
a
per
|
Discussion
P
a
per
|
Discussion
P
a
per
verse health effects and exposure of people by pollutants, the emission regulation for
motor vehicles include limits for particulate mass (PM), and in Europe for some vehicle types, particle number (PN), of which the PN limit is considered to be stricter. Limits for gaseous compounds cover total hydrocarbon emissions, nitrogen oxides and carbon
monoxide. Both particulate and gaseous emissions are strongly affected by technology
5
development (e.g. catalysts and filters), driven by legislation activities. This
technol-ogy development has, in general also other effects than required by emission
legisla-tion, for example fuel sulfur content limitations affect the emissions of nanoparticles.
It should be noted that semi-volatile compounds (e.g. low-volatility organics, sulphuric compounds) are not directly regulated even though they are partially detected in the
10
gravimetric PM determination as particles or adsorbed gas phase artefacts (Chase et al., 2004; Högström et al., 2012).
In the gasoline vehicle fleet the port-fuel injection (PFI) techniques has been widely replaced by gasoline direct injection (GDI) technologies due to the need to decrease
fuel consumption and NOx emissions of passenger cars (e.g. Alkidas, 2007; CARB,
15
2010). The disadvantage of GDI technologies is the increased primary particle emis-sion (Aakko and Nylund, 2003; Mohr et al., 2006; Braisher et al., 2010). The GDI vehicle exhaust particle number concentrations are typically significantly lower than the diesel exhaust particle concentrations without a diesel particulate filter (DPF) but higher than concentrations with a DPF (Mathis et al., 2005). The GDI engine exhaust particle size
20
distribution has been observed to be bi-modal (Barone et al., 2012; Sementa et al., 2012; Sgro et al., 2012; Maricq et al., 1999; Karjalainen et al., 2014; Pirjola et al., 2015a) and the emission is dominated by elemental carbon (EC) (Maricq et al., 2012). Organic carbon (OC) constitutes only a small fraction of particle emissions. Particles are (in number) mainly in ultrafine particle sizes (e.g. Maricq et al., 1999; Harris and
25
Maricq, 2001; Khalek et al., 2010; Karjalainen et al., 2014). According to the study
of Karjalainen et al. (2014), the GDI exhaust particles can be divided into four diff
agglomer-ACPD
15, 33253–33282, 2015Time-resolved primary and secondary particle
emissions of a gasoline vehicle
P. Karjalainen et al.
Title Page
Abstract Introduction
Conclusions References
Tables Figures
◭ ◮
◭ ◮
Back Close
Full Screen / Esc
Printer-friendly Version
Interactive Discussion
Discussion
P
a
per
|
Discussion
P
a
per
|
Discussion
P
a
per
|
Discussion
P
a
per
|
ated soot like particles with mean particle size between 30 and 60 nm, lubricant oil originating particles consisting of metallic ash components (Rönkkö et al., 2014) and semivolatile nucleation particles (see also Mathis et al., 2005; Li et al., 2013). The highest emissions of primary particles take place under acceleration and deceleration conditions (Karjalainen et al., 2014).
5
Secondary aerosol formation happens in the atmosphere through oxidation pro-cesses that tend to lower the saturation vapor pressures of organic species. Thus, more oxidized compounds, mostly organic compounds, are more likely found in the particle phase (Robinson et al., 2007). Fresh exhaust emissions contain a variety of
different organic compounds, in the scale of hundreds or thousands of different
com-10
ponents (Rogge et al., 1993). Part of those has low saturation vapor pressure already when emitted and thus they are observed in primary particulate emission or in partic-ulate phase after the exhaust has been diluted rapidly into the atmospheric conditions (Tobias et al., 2001; Sakurai et al., 2003; Arnold et al., 2012; Pirjola et al., 2015b). However, even the majority of organic compounds in the exhaust are primarily
emit-15
ted to atmosphere in gaseous phase. Also, sulfur compounds such as SO2as well as
nitrogen oxides can play a role in the secondary aerosol formation processes in the atmosphere.
There are studies of engine exhaust related secondary organic aerosol (SOA) for-mation for gasoline (Suarez-Bertoa et al., 2015; Nordin et al., 2013) and diesel
vehi-20
cles (e.g. Weitkamp et al., 2007; Chirico et al., 2010; Gordon et al., 2013). In these, the secondary particulate emissions of gasoline vehicles have been studied using a smog chamber so that diluted exhaust gas has been led to the smog chamber during a test cycle, a constant speed operation or idling condition (Suarez-Bertoa et al., 2015; Nordin et al., 2013). However, in the emission’s perspective this represents only the
25
average over the test, and more detailed analysis of the effect of driving pattern and
engine conditions on SOA formation is lacking. With the potential aerosol mass (PAM) concept (Kang et al., 2007) SOA emissions can be studied in a shorter time scale
ACPD
15, 33253–33282, 2015Time-resolved primary and secondary particle
emissions of a gasoline vehicle
P. Karjalainen et al.
Title Page
Abstract Introduction
Conclusions References
Tables Figures
◭ ◮
◭ ◮
Back Close
Full Screen / Esc
Printer-friendly Version
Interactive Discussion
Discussion
P
a
per
|
Discussion
P
a
per
|
Discussion
P
a
per
|
Discussion
P
a
per
OH, HO2). Secondary aerosol formation processes are accelerated so that few minute
residence time corresponds the atmospheric ageing of several days or even weeks. In principle, the PAM reactor enables real-time measurements of secondary particulate emissions during the driving cycle. The PAM concept has been previously applied in
vehicular exhaust studies e.g. by Tkacik et al. (2014) who used the reactor in a traffic
5
tunnel to study the secondary aerosol properties, and by Pourkhesalian et al. (2015) who used the PAM reactor in connection with diesel exhaust particle volatility and Re-active Oxygen Species (ROS) studies. High oxidant concentrations, (100–1000 times
atmospheric concentrations of O3, OH, HO2) and UV lights used in the chamber are
shown to simulate SOA formation in the atmosphere (Kang et al., 2007, 2011). The
ag-10
ing as the sample flows through the chamber is shown to represent several day aging in the atmosphere (Kang et al., 2011; Ortega et al., 2013).
In this work the aim is to show how the driving conditions of modern gasoline
vehi-cle affect the emissions, especially the secondary particulate emission. To meet this
goal, a comprehensive set of real-time instruments was used to study the physical
15
and chemical characteristics of primary and secondary particle emissions as well as gaseous emissions of a modern GDI passenger car. The sampling of exhaust for pri-mary emission measurements was conducted by mimicking the real-world atmospheric dilution. Secondary emission was studied by using a PAM reactor designed to mimic
atmospheric ageing of aerosol. Experiments were performed for the official European
20
test cycle for passenger cars that is the New European Driving Cycle (NEDC). Special attention was paid to the temporal behavior of primary and secondary particle
emis-sions, e.g. emissions during the engine cold start and in different driving patterns.
2 Materials and methods
The test vehicle was a modern gasoline passenger car (model year 2011, 1.4 L
25
ACPD
15, 33253–33282, 2015Time-resolved primary and secondary particle
emissions of a gasoline vehicle
P. Karjalainen et al.
Title Page
Abstract Introduction
Conclusions References
Tables Figures
◭ ◮
◭ ◮
Back Close
Full Screen / Esc
Printer-friendly Version
Interactive Discussion
Discussion
P
a
per
|
Discussion
P
a
per
|
Discussion
P
a
per
|
Discussion
P
a
per
|
commercial E10 (max 10 % ethanol). The driving cycle used in the study was New Eu-ropean Driving Cycle (NEDC). The EuEu-ropean exhaust emissions driving cycle “NEDC” is defined in the UN ECE R83 regulation. The car was tested on a chassis
dynamome-ter in a climatic test cell at+23◦C. NEDC totals 11.0 km, divided into three test phases
to study emissions at cold start and with warmed-up engines. The first and second test
5
phases (later called as cold start urban driving cycle, CSUDC, and hot urban driving cycle, HUDC) each consisted of 2.026 km driving, and the third test phase, the extra-urban driving cycle (EUDC), was 6.955 km.
Particle sampling was conveyed by a partial exhaust sampling system (Ntziachristos et al., 2004) at the exhaust transfer line. The sampling system consisted of a porous
10
tube diluter (PTD) (dilution ratio (DR) 12), residence time chamber (2.5 s) and sec-ondary dilution conducted by Dekati Diluter (DR 8). In terms of exhaust nucleation particle formation, the sampling system mimics the real exhaust dilution and nanoparti-cle formation processes in the atmosphere (Rönkkö et al., 2006; Keskinen and Rönkkö, 2010). A PAM (Potential aerosol mass) chamber (Lambe et al., 2011) was used to
eval-15
uate SOA formation during the NEDC cycle. The PAM chamber was installed between the ageing chamber and secondary dilution units of sampling system. The sample flow
through the PAM chamber was set to∼9.75 L min−1resulting average residence time
of 84 s. The voltage of the two UV lamps was at maximum value, 190 V. Relative hu-midity (RH) and temperature were measured prior to the PAM with the typical values
20
of 60 % and 22◦C, respectively. Ozone concentration after the PAM was on average
6 ppm. The PAM chamber was calibrated using average experiment conditions and fol-lowing the same procedure described by Lambe et al. (2011). All cycles were firstly run without the PAM chamber to measure primary emissions and secondly with the PAM chamber in order to study the formation of secondary particulate material.
25
The particle instrumentation was located downstream of the secondary diluter. The particle size distributions were measured on-line (1 Hz time resolution) with a
High-resolution low-pressure impactor (HRLPI) (Arffman et al., 2014), fitted into an ELPI
parti-ACPD
15, 33253–33282, 2015Time-resolved primary and secondary particle
emissions of a gasoline vehicle
P. Karjalainen et al.
Title Page
Abstract Introduction
Conclusions References
Tables Figures
◭ ◮
◭ ◮
Back Close
Full Screen / Esc
Printer-friendly Version
Interactive Discussion
Discussion
P
a
per
|
Discussion
P
a
per
|
Discussion
P
a
per
|
Discussion
P
a
per
cle sizer (EEPS, TSI Inc.) (Johnson et al., 2004). The particle number concentration was also measured with an ultrafine condensation particle counter (UCPC, TSI Inc. model 3025) that was located downstream of a passive nanoparticle diluter (DR 42). A SP-AMS was used to measure chemical composition (ions, organic carbon, refrac-tory black carbon and some metals) of emitted submicron (50–800 nm) particulate
mat-5
ter (PM). SP-AMS is a high resolution time-of-flight aerosol mass spectrometer (HR-ToF-AMS) with added laser (intracavity Nd:YAG, 1064 nm) vaporizer (Schwarz et al., 2008). The HR-ToF-AMS is described in detail by (DeCarlo et al., 2006; Jayne et al., 2000) and SP-AMS is described by (Schwarz et al., 2008). Briefly, in the SP-AMS an aerodynamic lens is used to form a narrow beam of particles that is transmitted into
10
the detection chamber, where the species are flash-vaporized with the laser and non-BC containing particles are vaporized either by normal tungsten vaporizer in (600) to analyze inorganic ion and OC concentrations and with SP laser (intracavity Nd:YAG, 1064 nm) in order to analyze black carbon and metals. The vaporized compounds are ionized using electron impact ionization (70 eV). Ions formed are guided to the
time-of-15
flight chamber. A multi-channel plate (MCP) is used as a detector. The time resolution of AMS measurements was five seconds. One-minute detection limits for
submicrom-eter particles are<0.04 µg m−3for all species in the V-mode. The IGOR 6.11
(Wave-metrics, Lake Oswego, OR), Squirrel 1.53 (Sueper, 2013) and PIKA 1.12F were used to analyze the SP-AMS data.
20
Equipment used in the measurement of the CO, HC, and NOx emissions conforms to the specifications of the Directive 70/220/EEC and its amendments. The true oxy-gen contents and densities of the fuels were used in the calculation of the results. A flame ionization detector (FID) was used for the measurement of hydrocarbons (all carbon-containing compounds, also oxygenates) (Sandström-Dahl et al., 2010;
Aakko-25
Saksa et al., 2014). The calculation method chosen uses the density of 0.619 g dm−3
(different from the EC regulation 692/2008). A number of gaseous compounds (19 in
ACPD
15, 33253–33282, 2015Time-resolved primary and secondary particle
emissions of a gasoline vehicle
P. Karjalainen et al.
Title Page
Abstract Introduction
Conclusions References
Tables Figures
◭ ◮
◭ ◮
Back Close
Full Screen / Esc
Printer-friendly Version
Interactive Discussion
Discussion
P
a
per
|
Discussion
P
a
per
|
Discussion
P
a
per
|
Discussion
P
a
per
|
ethanol, formaldehyde and acetaldehyde were measured on-line with two-second time resolution using Fourier transformation infrared (FTIR) equipment (Gasmet Cr-2000).
3 Results and discussion
3.1 Primary particulate and gaseous emissions of a gasoline passenger car
3.1.1 Particle size distributions 5
The driving cycle used in the study was NEDC being a statutory cycle in emission testing in Europe. The cycle consists of several patterns describing typical driving in urban environments and high-way driving (Fig. 1a) with total duration and length of the cycle is 1200 s and 11.0 km, respectively. Figure 1 shows the speed of the test vehicle during the test cycle and particle number concentration, particle volume concentration
10
and particle size distribution of vehicle exhaust, all measured with high time resolution (1 s).
The exhaust particle number concentration was strongly dependent on driving con-dition (Fig. 1b). Large particle number concentrations were observed during accelera-tions, especially during the first two accelerations when the engine had not yet reached
15
steady temperature conditions, and they were therefore associated with high engine loading and altering combustion conditions. In addition to soot particles (particle di-ameters of 30–100 nm, see Fig. 1c), there were also frequent observations of small
particles (Dp<10 nm), especially in the middle part of the cycle. These nanoparticles
are most likely associated with deceleration and engine braking conditions (Rönkkö
20
et al., 2014; Karjalainen et al., 2014). The largest particle volume concentrations were observed at the beginning, just after ignition and, on the other hand, at the end of the test cycle when the driving was at high speed and engine load. High total particle vol-ume concentrations were strongly linked with the existence of soot mode particles in the exhaust.
ACPD
15, 33253–33282, 2015Time-resolved primary and secondary particle
emissions of a gasoline vehicle
P. Karjalainen et al.
Title Page
Abstract Introduction
Conclusions References
Tables Figures
◭ ◮
◭ ◮
Back Close
Full Screen / Esc
Printer-friendly Version
Interactive Discussion
Discussion
P
a
per
|
Discussion
P
a
per
|
Discussion
P
a
per
|
Discussion
P
a
per
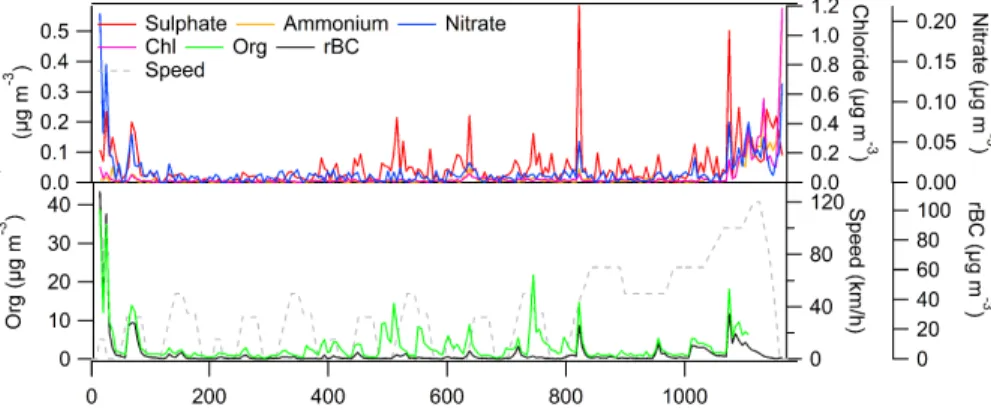
3.1.2 Chemical composition
Figure 2 shows the chemical composition of primary exhaust particles during the NEDC cycle. The lower pane shows the major components, revealing that the large particle emission at the beginning of the cycle consists mainly of organic compounds and re-fractory black carbon (rBC). When compared to Fig. 1, it can be seen that the organic
5
compounds together with rBC forms the so called soot mode, which dominate the par-ticle volume concentration due to its large parpar-ticle size. While the rBC has formed in the engine due to the incomplete combustion of fuel forming agglomerated soot par-ticles (Heywood, 1988), the organic compounds have likely been condensed onto the soot particle surface mainly during cooling dilution process of exhaust. Figure 2 shows
10
that later, after the starting phase of the test cycle the relative concentration of rBC decreases and remains at low levels with the exception of the accelerations at the highway part of the cycle. Interestingly, the concentration of organic compounds was very significant in the middle part of the cycle, i.e. when the emissions of nanoparticles (see Fig. 1) were observed to be high. Thus, while the high emission of organic
com-15
pounds seems to be linked with high soot/rBC emission at the beginning of the cycle, in the middle part the organics and rBC emissions seemed not to be interlinked.
Concentrations of inorganic species (SO4, NH4, NO3, Chl) are shown in the upper
pane of Fig. 2. Note that the concentration axes differ. In general, the highest sulfate
and nitrate concentrations existed during accelerations, and had a good correlation with
20
soot/rBC emissions. The sulfate concentration increases also during certain periods in the middle part of the cycle, clearly linked with similar peaks in organic compounds concentration (see Fig. 2). Interestingly, during highway driving and the following de-celeration, also significant concentration of ammonium, nitrate and chloride ions were observed.
ACPD
15, 33253–33282, 2015Time-resolved primary and secondary particle
emissions of a gasoline vehicle
P. Karjalainen et al.
Title Page
Abstract Introduction
Conclusions References
Tables Figures
◭ ◮
◭ ◮
Back Close
Full Screen / Esc
Printer-friendly Version
Interactive Discussion
Discussion
P
a
per
|
Discussion
P
a
per
|
Discussion
P
a
per
|
Discussion
P
a
per
|
3.1.3 Gaseous emissions
The time series of total hydrocarbons, ammonia and NOx during the NEDC test cycle
are presented in Fig. 3. The largest hydrocarbon emissions were observed at the be-ginning of the cycle due to low engine and exhaust gas temperatures, which lowers the
efficiency of the oxidation process in the three-way catalytic converter, in addition to
5
higher formation rates of gaseous hydrocarbons during combustion. The hydrocarbon emissions are in line with the measurements of the chemical composition of particles, which shows that the highest emissions of particulate organic compounds occur at the beginning of the cycle. However, during the middle part of the cycle the emissions of gaseous hydrocarbons and organic particulate matter did not correlate; although in
10
particle phase organics (see Fig. 2) the concentrations reached high values also during middle part of the cycle, the gaseous hydrocarbons remained at very low level until to
the highway driving part of the cycle. The NOxemissions were the highest at the
begin-ning of the cycle and during the last part of the cycle when the driving speed and com-bustion temperatures were high. Ammonium concentrations were at the level of 10 ppm
15
during most of the cycle, even higher than 100 ppm concentration was measured dur-ing the accelerations at the end of the cycle. The highest ammonia concentrations were clearly linked with acceleration, under conditions when the air-to-fuel ratio can be be-low 1 (rich mixture). This is in line with the findings by Meija-Centeno et al. (2007) and Heeb et al. (2006) showing ammonia formation in the three-way catalyst in slightly rich
20
air-to-fuel ratios, which are prevailing during acceleration
3.2 Secondary particle emissions of a gasoline passenger car
3.2.1 Particle size distributions
Figure 4 shows the secondary particle number concentrations, volume concentrations and size distributions of gasoline passenger car exhaust during the NEDC cycle. In
25
sec-ACPD
15, 33253–33282, 2015Time-resolved primary and secondary particle
emissions of a gasoline vehicle
P. Karjalainen et al.
Title Page
Abstract Introduction
Conclusions References
Tables Figures
◭ ◮
◭ ◮
Back Close
Full Screen / Esc
Printer-friendly Version
Interactive Discussion
Discussion
P
a
per
|
Discussion
P
a
per
|
Discussion
P
a
per
|
Discussion
P
a
per
ondary particles were significantly larger than those of the primary particles, throughout the cycle. Periodic behaviour similar to that of the primary particles can be observed: first a period with large soot mode particles, then a period with a large number of small nanoparticles, and finally the highway part of the cycle.
As shown above, after the ignition the emissions of gaseous precursors
(hydrocar-5
bons and nitrogen containing species) and primary particles were observed to be high (Fig. 3). This combined with the information seen in Fig. 4 indicates that the existence of gaseous precursors in the exhaust significantly increases the secondary particu-late matter formation, resulting as a high volume concentration of large particles at the beginning of the test cycle (Fig. 3). Compared to other periods of the cycle, at
10
the beginning the volume concentration of secondary particles was three times higher, highlighting the role of cold starts in total secondary particle emission of gasoline vehi-cles.
The high oxidant concentrations in the PAM chamber result also in high concen-trations of condensing compounds, which causes a possibility for nucleation in the
15
chamber. In this study we measured higher particle number concentrations for the sample treated by the PAM than for the untreated sample. However, the increase of particle number was not very significant and, in principle, may also be caused by the increase of particle size into the measurement range of aerosol instruments. Interest-ingly, nanoparticles were not observed in the primary emission during the first period
20
of cycle (Fig. 1), when both the precursor gas concentration and resulted volume of secondary particulate matter was the highest. During the first period, also the mean particle number concentrations were on a relatively similar level both in the primary and secondary aerosol. Instead, nanoparticles were observed in the sample treated by the PAM during the second phase (starting at 400 s) of the cycle. During this part of the
25
ACPD
15, 33253–33282, 2015Time-resolved primary and secondary particle
emissions of a gasoline vehicle
P. Karjalainen et al.
Title Page
Abstract Introduction
Conclusions References
Tables Figures
◭ ◮
◭ ◮
Back Close
Full Screen / Esc
Printer-friendly Version
Interactive Discussion
Discussion
P
a
per
|
Discussion
P
a
per
|
Discussion
P
a
per
|
Discussion
P
a
per
|
mean particle size and thus how effectively they are detected by aerosol instruments;
e.g. the particle size range of aerosol mass spectrometers do not typically cover par-ticles smaller than 50 nm, and in several studies the particle number size distribution measurement is limited to sizes above 10 nm.
As stated above, in the middle part of the cycle, a large number of primary
nanopar-5
ticles was introduced into the chamber from the exhaust. Figure 3 shows that these sub-5 nm particles grew in the chamber to particle sizes similar to primary soot parti-cles. This takes approximately 60–80 s, corresponding to the mean residence time in the PAM. In general, it seems that both the primary soot particles and primary nanopar-ticles can have an important role in secondary particle formation dynamics resulting
10
e.g. in the size distribution of aged exhaust aerosol.
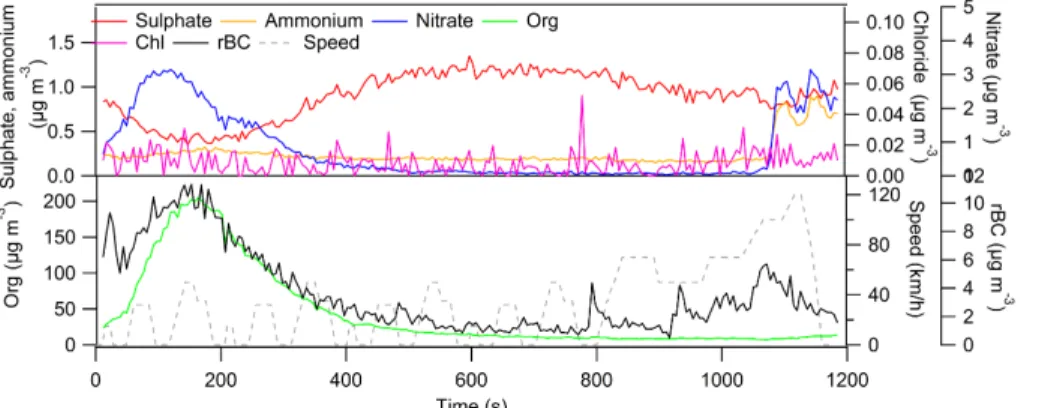
3.2.2 Chemical composition of secondary particles
The secondary aerosol mass consisted mainly of organic compounds and rBC (Fig. 5, lower pane). At the beginning of the test cycle, the concentrations of organic com-pounds in the secondary particulate matter were about 100 times higher than their
15
concentrations in primary particles. During other parts of the cycle the concentrations of the organic compounds were significantly lower and remained relatively stable. The rBC concentration level did not change significantly because rBC is a primary compo-nent.
At the beginning of the cycle the incomplete combustion causes high emissions of
20
rBC and gaseous hydrocarbons. Simultaneously the temperature of the three-way cat-alytic converter is low and thus the reduction of hydrocarbons is not optimal. In the PAM reactor, the oxidation of hydrocarbons lowers their volatility which results in high emissions of secondary particulate matter consisting of organic compounds. During highway part of the cycle, the incomplete combustion again causes the emission of
25
soot/rBC during certain acceleration phases. However, during highway part the
tem-perature of the catalyst used in the vehicle is very high, approximately 700◦C (see
ACPD
15, 33253–33282, 2015Time-resolved primary and secondary particle
emissions of a gasoline vehicle
P. Karjalainen et al.
Title Page
Abstract Introduction
Conclusions References
Tables Figures
◭ ◮
◭ ◮
Back Close
Full Screen / Esc
Printer-friendly Version
Interactive Discussion
Discussion
P
a
per
|
Discussion
P
a
per
|
Discussion
P
a
per
|
Discussion
P
a
per
emissions at a very low level. Thus, during the highway part the concentration of or-ganic precursors is low in the exhaust, resulting in a low concentration of secondary organic particulate material.
In addition to rBC and organic compounds, during the middle part of the cycle the concentrations of inorganic species were observed to be stable. Only a slight increase
5
in sulfate concentration was observed, simultaneously with the existence of nanopar-ticles in secondary aerosol. This observation is in line with primary particle measure-ments where sulfate peaks were observed during the middle part of the cycle. During the highway part of the cycle the concentrations of inorganic species in the secondary particulate matter increases when compared to the previous parts of the cycle. This is
10
seemingly caused by high exhaust temperatures linked with high emissions of gaseous nitrogen compounds (see Fig. 3). Results indicate that also these compounds may
have a significant role in traffic related secondary aerosol formation. However, this kind
of aerosol is very specifically formed only at high vehicle speeds.
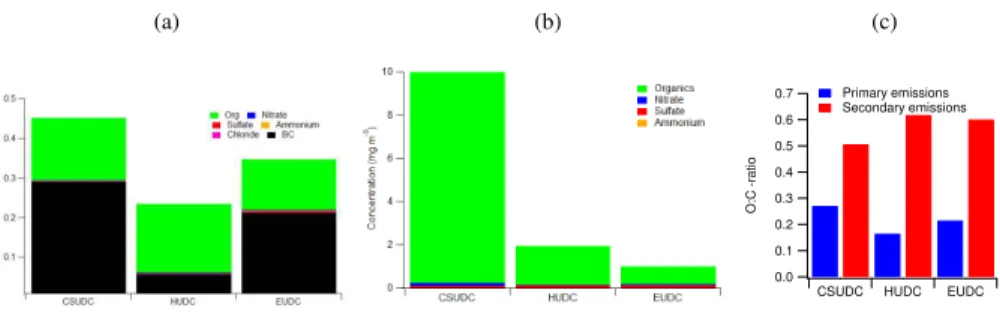
3.2.3 Influence of driving conditions to emission characteristics 15
The results presented above indicate that both the primary and secondary emissions
vary strongly as a function of the driving cycle. To clarify the effects of driving
condi-tions on the concentracondi-tions of secondary and primary particles the cycle was divided into three sections according to the engine and speed profile conditions: CSUDC (0– 391 s), HUDC (392–787 s) and EUDC (788–1180 s). The CSUDC represents cold start
20
situation, the HUDC represents typical city driving with warm engine and the EUDC represents typical highway driving. Figure 6 shows chemical composition and O : C ra-tios of primary and secondary exhaust particles for these three sections. O : C rara-tios were determined for organic compounds based on chemical composition measured by the SP-AMS, so that inorganic species and rBC were excluded. Emission factors for
25
condi-ACPD
15, 33253–33282, 2015Time-resolved primary and secondary particle
emissions of a gasoline vehicle
P. Karjalainen et al.
Title Page
Abstract Introduction
Conclusions References
Tables Figures
◭ ◮
◭ ◮
Back Close
Full Screen / Esc
Printer-friendly Version
Interactive Discussion
Discussion
P
a
per
|
Discussion
P
a
per
|
Discussion
P
a
per
|
Discussion
P
a
per
|
tions, the rBC concentration was four times higher during CSUDC. Again, during the EUDC section of the cycle higher rBC concentration was observed in the exhaust. In
contrast, for the organics similar differences between the sections of the test cycle were
not observed. Inorganic species concentrations were relatively low in all cycle sections representing on average 3.6 % of particulate mass.
5
On average, the secondary particulate emissions were 13 times higher than the primary particle emissions. This value is higher or at similar level than observed in previous studies reported. For instance, Suarez-Bertoa et al. (2015) reported 2–4 times higher values for the secondary particle emissions of gasoline vehicle when compared to the primary organics and BC. In the diesel exhaust study of Chirico et al. (2010), the
10
secondary and primary particle emissions were at similar level. However, in the study of Platt et al. (2013) SOA emission was around 14 times higher than primary organic aerosol (POA) emission when they measured the emissions of gasoline vehicle for the NEDC cycle. All of these studies were conducted using a batch chamber while in our
study a flow through chamber was used. The differences between the studies can be
15
due to the differences in the emissions but also due to the differences in wall losses.
The chemical composition of secondary particles differed significantly from primary
particles; in secondary particles most of the particulate matter consisted of organics whereas the relative role of rBC was higher in primary particles. The calculative
sec-ondary organics concentration was high especially during CSUDC, even 9.9 mg m−3.
20
This highlights the important role primary and secondary emissions during cold start
and the effects of emissions during cold start on atmospheric particulate pollutant
lev-els. It should be noted that the emission factors of both primary and secondary particles were lowest during the EUDC (see Supplement).
O : C ratios were relatively stable for primary emissions, slightly higher O : C ratio
25
(0.27) was observed for the CSUDC. Similar O : C ratios have been typically observed
for fresh traffic emissions in urban ambient measurements (Timonen et al., 2013;
Car-bone et al., 2014). For the secondary emissions the O : C ratios were between 0.5–0.6.
ACPD
15, 33253–33282, 2015Time-resolved primary and secondary particle
emissions of a gasoline vehicle
P. Karjalainen et al.
Title Page
Abstract Introduction
Conclusions References
Tables Figures
◭ ◮
◭ ◮
Back Close
Full Screen / Esc
Printer-friendly Version
Interactive Discussion
Discussion
P
a
per
|
Discussion
P
a
per
|
Discussion
P
a
per
|
Discussion
P
a
per
gaseous compounds at the beginning of the cycle likely affect, as well as, differences
in oxidant levels in chamber are likely reasons for observed differences. Also previous
study for gasoline vehicle reported high O : C ratios (up to 0.7) for secondary organic exhaust aerosol (Suarez-Bertoa et al., 2015).
4 Conclusions 5
In this study we characterized primary and secondary particulate emission and gaseous compounds emitted by a modern gasoline vehicle. All the measurements were made in real time with high time resolution. Measurements were conducted un-der driving conditions representing typical urban driving cycles. Our aim was to create a basis for understanding the links between driving conditions, primary emissions of
10
aerosols and their precursors and the formation of secondary particulate material. We approached this issue by using a potential aerosol mass (PAM) chamber enabling the characterization of secondary emissions in real time, combined with comprehensive characterization of PM and gaseous compounds.
Our results indicated higher or similar level secondary particulate matter emissions
15
compared to the previous studies (Suarez-Bertoa et al., 2015; Platt et al., 2013). Com-pared to primary particle emissions, our study indicated 13 times higher secondary particulate emissions, dominated by organics. The study of Suarez-Bertoa et al. (2015) indicated 2–4 times higher emissions for secondary particles, instead, in the study of Platt et al. (2013) SOA emission was around 9–15 times higher than POA emission for
20
the NEDC cycle. For reference, the primary particle emissions measured in this study were at similar levels than in previous studies for modern gasoline vehicles (Karjalainen et al., 2014).
We observed that during ignition and during the first few minutes of the test cycle, i.e. when the engine and the catalyst had not reached normal operation temperatures, the
25
ACPD
15, 33253–33282, 2015Time-resolved primary and secondary particle
emissions of a gasoline vehicle
P. Karjalainen et al.
Title Page
Abstract Introduction
Conclusions References
Tables Figures
◭ ◮
◭ ◮
Back Close
Full Screen / Esc
Printer-friendly Version
Interactive Discussion
Discussion
P
a
per
|
Discussion
P
a
per
|
Discussion
P
a
per
|
Discussion
P
a
per
|
with a warmed engine produced significantly lower primary and secondary particulate
emissions. This indicates that the adverse effects of traffic are likely to be the largest
in city areas where driving distances are typically short, near houses and workplaces. However, we note that the formation of secondary particulate matter is a longer-time atmospheric process and thus not directly linked with human exposure and human
5
health at the site of emission. Also, it is reasonable to assume that this problem at least from the viewpoint of secondary aerosol precursor emissions is magnified under cold climatic conditions.
Both primary and secondary emissions were highly dependent on driving conditions, such as speed, acceleration and deceleration profiles. At high speed (EUDC), both
10
particulate mass and size distribution were different when compared to low speed
driv-ing (HUDC). In addition, under deceleration conditions very small nanoparticles were observed in primary exhaust. These nanoparticles grew in particle size due to the condensation of highly oxidized engine origin compounds; these oxidized compounds were formed in our experiment in the PAM chamber but in reality they are formed in
15
the atmosphere. Thus, our results indicate that also nanoparticles can contribute to atmospheric secondary aerosol formation, especially on size distribution of secondary particles. Due to that it is clear that current legislation focusing on larger particles (PM mass or number of particles larger than 23 nm in diameter) is not optimal from the view-point of realistic urban air quality, since it takes into account only the largest primary
20
particles.
This study highlights the importance of reduction of precursor gases as mean to reduce secondary pollutants. A reduction of the emission of precursor gases can be achieved by properly designed emission control technologies. Also by smart city plan-ning it is possible to reduce PM emissions by reducing the driving conditions where PM
25
ACPD
15, 33253–33282, 2015Time-resolved primary and secondary particle
emissions of a gasoline vehicle
P. Karjalainen et al.
Title Page
Abstract Introduction
Conclusions References
Tables Figures
◭ ◮
◭ ◮
Back Close
Full Screen / Esc
Printer-friendly Version
Interactive Discussion
Discussion
P
a
per
|
Discussion
P
a
per
|
Discussion
P
a
per
|
Discussion
P
a
per
adverse health effects caused by traffic, our urban society should be designed taking
into account all different subsystems, such as vehicle technologies, road and building
structures, atmospheric processes and air quality, and emission related legislation.
The Supplement related to this article is available online at doi:10.5194/acpd-15-33253-2015-supplement.
5
Acknowledgements. We acknowledge support by Tekes (the Finnish Funding Agency for
In-novation), Cleen Ltd (MMEA project), the Academy of Finland (Grant no. 259016), IEA-AMF Annex 44 and the Swedish Research Councils VR and Formas.
References
Aakko, P. and Nylund, N.-O.: Particle emissions at moderate and cold temperatures using
dif-10
ferent fuels, SAE Technical Paper, 2003-01-3285, doi:10.4271/2003-01-3285, 2003.
Aakko-Saksa, P., Rantanen-Kolehmainen, L., and Skyttä, E.: Ethanol, isobutanol, and biohy-drocarbons as gasoline components in relation to gaseous emissions and particulate matter, Environ. Sci. Technol., 48, 10489–10496, doi:10.1021/es501381h, 2014.
Alkidas, A. C.: Combustion advancements in gasoline engines, Energy Convers. Manage., 48,
15
2751–2761, doi:10.1016/j.enconman.2007.07.027, 2007.
Arffman, A., Yli-Ojanperä, J., Kalliokoski, J., Harra, J., Pirjola, L., Karjalainen, P., Rönkkö, T.,
and Keskinen, J.: High-resolution low-pressure cascade impactor, J. Aerosol Sci., 78, 97– 109, doi:10.1016/j.jaerosci.2014.08.006, 2014.
Arnold, F., Pirjola, L., Rönkkö, T., Reichl, U., Schlager, H., Lähde, T., Heikkilä, J., and
Keski-20
nen, J.: First online measurements of sulfuric acid gas in modern heavy-duty diesel engine exhaust: implications for nanoparticle formation., Environ. Sci. Technol., 46, 11227–11234, doi:10.1021/es302432s, 2012.
Barone, T. L., Storey, J. M. E., Youngquist, A. D., and Szybist, J. P.: An analysis of direct-injection spark-ignition (DISI) soot morphology, Atmos. Environ., 49, 268–274,
25
ACPD
15, 33253–33282, 2015Time-resolved primary and secondary particle
emissions of a gasoline vehicle
P. Karjalainen et al.
Title Page
Abstract Introduction
Conclusions References
Tables Figures
◭ ◮
◭ ◮
Back Close
Full Screen / Esc
Printer-friendly Version
Interactive Discussion
Discussion
P
a
per
|
Discussion
P
a
per
|
Discussion
P
a
per
|
Discussion
P
a
per
|
Braisher, M., Stone, R., and Price, P.: Particle Number Emissions from a Range of European Vehicles, SAE Technical Paper, 2010-01-0786, doi:10.4271/2010-01-0786, 2010.
CARB: Proposed amendments to Californias low-emission vehicle regulations – particulate matter mass, ultrafine solid particle number, and black carbon emissions, Workshop report, California Air Resources Board, 18 May 2010, El Monte, California, 1–24, 2010.
5
Carbone, S., Aurela, M., Saarnio, K., Saarikoski, S., Timonen, H., Frey, A., Sueper, D., Ulbrich, I. M., Jimenez, J. L., Kulmala, M., Worsnop, D. R., and Hillamo, R. E.: Win-tertime aerosol chemistry in sub-Arctic urban air, Aerosol Sci. Tech., 48, 313–323, doi:10.1080/02786826.2013.875115, 2014.
Chase, R. E., Duszkiewicz, G. J., Richert, J. F. O., Lewis, D., Maricq, M. M., and Xu, N.: PM
10
Measurement Artifact: Organic Vapor Deposition on Different Filter Media, SAE Technical
Paper, 2004-01-0967, doi:10.4271/2004-01-0967, 2004.
Chirico, R., DeCarlo, P. F., Heringa, M. F., Tritscher, T., Richter, R., Prévôt, A. S. H., Dom-men, J., Weingartner, E., Wehrle, G., Gysel, M., Laborde, M., and Baltensperger, U.: Impact of aftertreatment devices on primary emissions and secondary organic aerosol formation
po-15
tential from in-use diesel vehicles: results from smog chamber experiments, Atmos. Chem. Phys., 10, 11545–11563, doi:10.5194/acp-10-11545-2010, 2010.
DeCarlo, P. F., Kimmel, J. R., Trimborn, A., Northway, M. J., Jayne, J. T., Aiken, A. C., Go-nin, M., Fuhrer, K., Horvath, T., Docherty, K. S., Worsnop, D. R., and Jimenez, J. L.: Field-deployable, high-resolution, time-of-flight aerosol mass spectrometer, Anal. Chem., 78,
20
8281–8289, doi:10.1021/ac061249n, 2006.
Gordon, T. D., Tkacik, D. S., Presto, A. A., Zhang, M., Jathar, S. H., Nguyen, N. T., Massetti, J., Truong, T., Cicero-Fernandez, P., Maddox, C., Rieger, P., Chattopadhyay, S., Maldonado, H., Maricq, M. M., and Robinson, A. L.: Primary gas- and particle-phase emissions and sec-ondary organic aerosol production from gasoline and diesel off-road engines, Environ. Sci.
25
Technol., 47, 14137–14146, doi:10.1021/es403556e, 2013.
Harris, S. J. and Maricq, M. M.: Signature size distributions for diesel and gasoline engine exhaust particulate matter, J. Aerosol Sci., 32, 749–764, doi:10.1016/S0021-8502(00)00111-7, 2001.
Heeb, N. V., Forss, J. A.-M., Brühlmann, S., Lüscher, R., Saxer, C. J., and Hug, P.:
Corre-30
ACPD
15, 33253–33282, 2015Time-resolved primary and secondary particle
emissions of a gasoline vehicle
P. Karjalainen et al.
Title Page
Abstract Introduction
Conclusions References
Tables Figures
◭ ◮
◭ ◮
Back Close
Full Screen / Esc
Printer-friendly Version
Interactive Discussion
Discussion
P
a
per
|
Discussion
P
a
per
|
Discussion
P
a
per
|
Discussion
P
a
per
Heywood, J. B.: Internal Combustion Engine Fundamentals, McGraw-Hill Education, New York, 1988.
Högström, R., Karjalainen, P., Yli-Ojanperä, J., Rostedt, A., Heinonen, M., Mäkelä, J. M., and Keskinen, J.: Study of the PM gas-phase filter artifact using a setup for mixing diesel-like soot and hydrocarbons, Aerosol Sci. Tech., 46, 1045–1052, doi:10.1080/02786826.2012.689118,
5
2012.
Jayne, J. T., Leard, D. C., Zhang, X., Davidovits, P., Smith, K. A., Kolb, C. E., and Worsnop, D. R.: Development of an aerosol mass spectrometer for size and composition analysis of submi-cron particles, Aerosol Sci. Tech., 33, 49–70, doi:10.1080/027868200410840, 2000.
Johnson, T., Caldow, R., Pocher, A., Mirmem, A., and Kittelson, D.: A New Electrical
Mobil-10
ity Particle Sizer Spectrometer for Engine Exhaust Particle Measurements, SAE Technical Paper, 2004-01-13, doi:10.4271/2004-01-1341, 2004.
Kang, E., Root, M. J., Toohey, D. W., and Brune, W. H.: Introducing the concept of Potential Aerosol Mass (PAM), Atmos. Chem. Phys., 7, 5727–5744, doi:10.5194/acp-7-5727-2007, 2007.
15
Kang, E., Toohey, D. W., and Brune, W. H.: Dependence of SOA oxidation on organic aerosol mass concentration and OH exposure: experimental PAM chamber studies, Atmos. Chem. Phys., 11, 1837–1852, doi:10.5194/acp-11-1837-2011, 2011.
Karjalainen, P., Pirjola, L., Heikkilä, J., Lähde, T., Tzamkiozis, T., Ntziachristos, L., Keskinen, J., and Rönkkö, T.: Exhaust particles of modern gasoline vehicles: a laboratory and an on-road
20
study, Atmos. Environ., 97, 262–270, doi:10.1016/j.atmosenv.2014.08.025, 2014.
Keskinen, J. and Rönkkö, T.: Can real-world diesel exhaust particle size distribution be re-produced in the laboratory? A critical review, J. Air Waste Manage., 60, 1245–1255, doi:10.3155/1047-3289.60.10.1245, 2010.
Khalek, I. A., Bougher, T., and Jetter, J. J.: Particle emissions from a 2009 gasoline direct
25
injection engine using different commercially available fuels, SAE Int. J. Fuels Lubr., 3, 623–
637, doi:10.4271/2010-01-2117, 2010.
Lahde, T., Niemi, J. V, Kousa, A., Ronkko, T., Karjalainen, P., Keskinen, J., Frey, A., Hillamo, R., and Pirjola, L.: Mobile particle and NOx emission characterization at Helsinki
Down-town: comparison of different traffic flow areas, Aerosol Air Qual. Res., 14, 1372–1382,
30
doi:10.4209/aaqr.2013.10.0311, 2014.
ACPD
15, 33253–33282, 2015Time-resolved primary and secondary particle
emissions of a gasoline vehicle
P. Karjalainen et al.
Title Page
Abstract Introduction
Conclusions References
Tables Figures
◭ ◮
◭ ◮
Back Close
Full Screen / Esc
Printer-friendly Version
Interactive Discussion
Discussion
P
a
per
|
Discussion
P
a
per
|
Discussion
P
a
per
|
Discussion
P
a
per
|
and Onasch, T. B.: Characterization of aerosol photooxidation flow reactors: heterogeneous oxidation, secondary organic aerosol formation and cloud condensation nuclei activity mea-surements, Atmos. Meas. Tech., 4, 445–461, doi:10.5194/amt-4-445-2011, 2011.
Li, T., Chen, X., and Yan, Z.: Comparison of fine particles emissions of light-duty gasoline vehicles from chassis dynamometer tests and on-road measurements, Atmos. Environ., 68,
5
82–91, doi:10.1016/j.atmosenv.2012.11.031, 2013.
Maricq, M., Podsiadlik, D., Brehob, D., and Haghgooie, M.: Particulate emissions from a direct-injection spark-ignition (DISI) engine, SAE Techical Paper, 1999-01-1530, doi:10.4271/1999-01-1530, 1999.
Maricq, M. M., Szente, J. J., and Jahr, K.: The impact of ethanol fuel blends on
10
PM emissions from a light-duty GDI vehicle, Aerosol Sci. Tech., 46, 576–583, doi:10.1080/02786826.2011.648780, 2012.
Mathis, U., Mohr, M., and Forss, A.: Comprehensive particle characterization of modern gaso-line and diesel passenger cars at low ambient temperatures, Atmos. Environ., 39, 107–117, doi:10.1016/j.atmosenv.2004.09.029, 2005.
15
Mejia-Centeno, I., Martínez-Hernández, A., and Fuentes, G.: Effect of low-sulfur fuels upon
NH3 and N2O emission during operation of commercial three-way catalytic converters, Top. Catal., 42–43, 381–385, doi:10.1007/s11244-007-0210-2, 2007.
Mohr, M., Forss, A., and Lehmann, U.: Particle emissions from diesel passenger cars equipped with a particle trap in comparison to other technologies, Environ. Sci. Technol., 40, 2375–
20
2383, doi:10.1021/es051440z, 2006.
Nordin, E. Z., Eriksson, A. C., Roldin, P., Nilsson, P. T., Carlsson, J. E., Kajos, M. K., Hel-lén, H., Wittbom, C., Rissler, J., Löndahl, J., Swietlicki, E., Svenningsson, B., Bohgard, M., Kulmala, M., Hallquist, M., and Pagels, J. H.: Secondary organic aerosol formation from idling gasoline passenger vehicle emissions investigated in a smog chamber, Atmos. Chem. Phys.,
25
13, 6101–6116, doi:10.5194/acp-13-6101-2013, 2013.
Ntziachristos, L., Giechaskiel, B., Pistikopoulos, P., Samaras, Z., Mathis, U., Mohr, M., Ris-timäki, J., Keskinen, J., Mikkanen, P., Casati, R., Scheer, V., and Vogt, R.: Performance eval-uation of a novel sampling and measurement system for exhaust particle characterization, SAE Technical Paper, 2004-01-1439, doi:10.4271/2004-01-1439, 2004.
30
oxida-ACPD
15, 33253–33282, 2015Time-resolved primary and secondary particle
emissions of a gasoline vehicle
P. Karjalainen et al.
Title Page
Abstract Introduction
Conclusions References
Tables Figures
◭ ◮
◭ ◮
Back Close
Full Screen / Esc
Printer-friendly Version
Interactive Discussion
Discussion
P
a
per
|
Discussion
P
a
per
|
Discussion
P
a
per
|
Discussion
P
a
per
tion from biomass-burning smoke in a flow reactor during FLAME-3, Atmos. Chem. Phys., 13, 11551–11571, doi:10.5194/acp-13-11551-2013, 2013.
Pierce, J. R., Engelhart, G. J., Hildebrandt, L., Weitkamp, E. A., Pathak, R. K., Donahue, N. M., Robinson, A. L., Adams, P. J., and Pandis, S. N.: Constraining particle evolution from wall losses, coagulation, and condensation-evaporation in smog-chamber experiments: optimal
5
estimation based on size distribution measurements, Aerosol Sci. Tech., 42, 1001–1015, doi:10.1080/02786820802389251, 2008.
Pirjola, L., Lähde, T., Niemi, J. V., Kousa, A., Rönkkö, T., Karjalainen, P., Keskinen, J., Frey, A., and Hillamo, R.: Spatial and temporal characterization of traffic emissions
in urban microenvironments with a mobile laboratory, Atmos. Environ., 63, 156–167,
10
doi:10.1016/j.atmosenv.2012.09.022, 2012.
Pirjola, L., Karjalainen, P., Heikkilä, J., Saari, S., Tzamkiozis, T., Ntziachristos, L., Kulmala, K., Keskinen, J., and Rönkkö, T.: Effects of fresh lubricant oils on particle emissions emitted by
a modern gasoline direct injection passenger car, Environ. Sci. Technol., 49, 3644–3652, doi:10.1021/es505109u, 2015a.
15
Pirjola, L., Karl, M., Rönkkö, T., and Arnold, F.: Model studies of volatile diesel exhaust par-ticle formation: organic vapours involved in nucleation and growth?, Atmos. Chem. Phys. Discuss., 15, 4219–4263, doi:10.5194/acpd-15-4219-2015, 2015b.
Platt, S. M., El Haddad, I., Zardini, A. A., Clairotte, M., Astorga, C., Wolf, R., Slowik, J. G., Temime-Roussel, B., Marchand, N., Ježek, I., Drinovec, L., Močnik, G., Möhler, O.,
20
Richter, R., Barmet, P., Bianchi, F., Baltensperger, U., and Prévôt, A. S. H.: Secondary or-ganic aerosol formation from gasoline vehicle emissions in a new mobile environmental reac-tion chamber, Atmos. Chem. Phys., 13, 9141–9158, doi:10.5194/acp-13-9141-2013, 2013. Pope III, C. A. and Dockery, D. W.: 2006 critical review: health effects of fine particulate air
pollution: lines that connect, J. Air Waste Manage., 56, 709–742, 2006.
25
Pourkhesalian, A. M., Stevanovic, S., Rahman, M. M., Faghihi, E. M., Bottle, S. E., Masri, A. R., Brown, R. J., and Ristovski, Z. D.: Effect of atmospheric aging on volatility and reactive
oxygen species of biodiesel exhaust nano-particles, Atmos. Chem. Phys., 15, 9099–9108, doi:10.5194/acp-15-9099-2015, 2015.
Robinson, A. L., Donahue, N. M., Shrivastava, M. K., Weitkamp, E. A., Sage, A. M.,
30
ACPD
15, 33253–33282, 2015Time-resolved primary and secondary particle
emissions of a gasoline vehicle
P. Karjalainen et al.
Title Page
Abstract Introduction
Conclusions References
Tables Figures
◭ ◮
◭ ◮
Back Close
Full Screen / Esc
Printer-friendly Version
Interactive Discussion
Discussion
P
a
per
|
Discussion
P
a
per
|
Discussion
P
a
per
|
Discussion
P
a
per
|
Rogge, W. F., Hildemann, L. M., Mazurek, M. a., Cass, G. R., and Simoneit, B. R. T.: Sources of fine organic aerosol. 2. Noncatalyst and catalyst-equipped automobiles and heavy-duty diesel trucks, Environ. Sci. Technol., 27, 636–651, doi:10.1021/es00041a007, 1993.
Rönkkö, T., Virtanen, A., Vaaraslahti, K., Keskinen, J., Pirjola, L., and Lappi, M.: Effect of dilution
conditions and driving parameters on nucleation mode particles in diesel exhaust: laboratory
5
and on-road study, Atmos. Environ., 40, 2893–2901, doi:10.1016/j.atmosenv.2006.01.002, 2006.
Rönkkö, T., Pirjola, L., Ntziachristos, L., Heikkilä, J., Karjalainen, P., Hillamo, R., and Keski-nen, J.: Vehicle engines produce exhaust nanoparticles even when not fueled, Environ. Sci. Technol., 48, 2043–2050, doi:10.1021/es405687m, 2014.
10
Sakurai, H., Tobias, H. J., Park, K., Zarling, D., Docherty, K. S., Kittelson, D. B., McMurry, P. H., and Ziemann, P. J.: On-line measurements of diesel nanoparticle composition and volatility, Atmos. Environ., 37, 1199–1210, doi:10.1016/S1352-2310(02)01017-8, 2003.
Sandström-Dahl, C., Erlandsson, L., Gasste, J., and Lindgren, M.: Measurement methodolo-gies for hydrocarbons, ethanol and aldehyde emissions from ethanol fuelled vehicles, SAE
15
Int. J. Fuels Lubr., 3, 453–466, doi:10.4271/2010-01-1557, 2010.
Schwarz, J. P., Spackman, J. R., Fahey, D. W., Gao, R. S., Lohmann, U., Stier, P., Watts, L. A., Thomson, D. S., Lack, D. a., Pfister, L., Mahoney, M. J., Baumgardner, D., Wilson, J. C., and Reeves, J. M.: Coatings and their enhancement of black carbon light absorption in the tropical atmosphere, J. Geophys. Res.-Atmos., 113, 1–10, doi:10.1029/2007JD009042, 2008.
20
Sementa, P., Maria Vaglieco, B., and Catapano, F.: Thermodynamic and optical charac-terizations of a high performance GDI engine operating in homogeneous and strati-fied charge mixture conditions fueled with gasoline and bio-ethanol, Fuel, 96, 204–219, doi:10.1016/j.fuel.2011.12.068, 2012.
Sgro, L. A., Sementa, P., Vaglieco, B. M., Rusciano, G., D’Anna, A., and Minutolo, P.:
Investigat-25
ing the origin of nuclei particles in GDI engine exhausts, Combust. Flame, 159, 1687–1692, doi:10.1016/j.combustflame.2011.12.013, 2012.
Suarez-Bertoa, R., Zardini, A. A., Keuken, H., and Astorga, C.: Impact of ethanol containing gasoline blends on emissions from a flex-fuel vehicle tested over the Worldwide Harmonized Light duty Test Cycle (WLTC), Fuel, 143, 173–182, doi:10.1016/j.fuel.2014.10.076, 2015.
30
Charac-ACPD
15, 33253–33282, 2015Time-resolved primary and secondary particle
emissions of a gasoline vehicle
P. Karjalainen et al.
Title Page
Abstract Introduction
Conclusions References
Tables Figures
◭ ◮
◭ ◮
Back Close
Full Screen / Esc
Printer-friendly Version
Interactive Discussion
Discussion
P
a
per
|
Discussion
P
a
per
|
Discussion
P
a
per
|
Discussion
P
a
per
teristics, sources and water-solubility of ambient submicron organic aerosol in springtime in Helsinki, Finland, J. Aerosol Sci., 56, 61–77, doi:10.1016/j.jaerosci.2012.06.005, 2013. Tkacik, D. S., Lambe, A. T., Jathar, S., Li, X., Presto, A. A., Zhao, Y., Blake, D., Meinardi, S.,
Jayne, J. T., Croteau, P. L., and Robinson, A. L.: Secondary organic aerosol formation from in-use motor vehicle emissions using a potential aerosol mass reactor, Environ. Sci. Technol.,
5
48, 11235–11242, doi:10.1021/es502239v, 2014.
Tobias, H. J., Beving, D. E., Ziemann, P. J., Sakurai, H., Zuk, M., McMurry, P. H., Zarling, D., Waytulonis, R., and Kittelson, D. B.: Chemical analysis of diesel engine nanoparticles using a nano-DMA/thermal desorption particle beam mass spectrometer, Environ. Sci. Technol., 35, 2233–2243, 2001.
10
Wehner, B., Birmili, W., Gnauk, T., and Wiedensohler, A.: Particle number size distributions in a street canyon and their transformation into the urban-air background: measurements and a simple model study, Atmos. Environ., 36, 2215–2223, doi:10.1016/S1352-2310(02)00174-7, 2002.
Weitkamp, E. A., Sage, A. M., Pierce, J. R., Donahue, N. M., and Robinson, A. L.: Organic
15
ACPD
15, 33253–33282, 2015Time-resolved primary and secondary particle
emissions of a gasoline vehicle
P. Karjalainen et al.
Title Page
Abstract Introduction
Conclusions References
Tables Figures
◭ ◮
◭ ◮
Back Close
Full Screen / Esc
Printer-friendly Version
Interactive Discussion
Discussion
P
a
per
|
Discussion
P
a
per
|
Discussion
P
a
per
|
Discussion
P
a
per
|
ACPD
15, 33253–33282, 2015Time-resolved primary and secondary particle
emissions of a gasoline vehicle
P. Karjalainen et al.
Title Page
Abstract Introduction
Conclusions References
Tables Figures
◭ ◮
◭ ◮
Back Close
Full Screen / Esc
Printer-friendly Version
Interactive Discussion
Discussion
P
a
per
|
Discussion
P
a
per
|
Discussion
P
a
per
|
Discussion
P
a
per
|
ACPD
15, 33253–33282, 2015Time-resolved primary and secondary particle
emissions of a gasoline vehicle
P. Karjalainen et al.
Title Page
Abstract Introduction
Conclusions References
Tables Figures
◭ ◮
◭ ◮
Back Close
Full Screen / Esc
Printer-friendly Version
Interactive Discussion
Discussion
P
a
per
|
Discussion
P
a
per
|
Discussion
P
a
per
|
Discussion
P
a
per
|
ACPD
15, 33253–33282, 2015Time-resolved primary and secondary particle
emissions of a gasoline vehicle
P. Karjalainen et al.
Title Page
Abstract Introduction
Conclusions References
Tables Figures
◭ ◮
◭ ◮
Back Close
Full Screen / Esc
Printer-friendly Version
Interactive Discussion
Discussion
P
a
per
|
Discussion
P
a
per
|
Discussion
P
a
per
|
Discussion
P
a
per
0.7
0.6
0.5
0.4
0.3
0.2
0.1
0.0
O:
C -r
a
tio
CSUDC HUDC EUDC Primary emissions Secondary emissions
(a) (b) (c)
Figure 6.Chemical composition of primary(a)and secondary(b)particulate material and the O : C ratios of primary and secondary particulate matter (c) for different parts of the NEDC