Determination
of Kingpin Axis from Wheel
Points Using Dual Quaternion Analysis
Yung-Chang Chen, Hsing-Hui Huang, Ching-Hsu Hsieh and Jia-Bin Lin
Abstract—Kingpin axis geometry is crucial to the design of a suspension system. Suspension construction is truly three-dimensional, and the screw axis theory allows for a more accurate kinematic analysis. This study aims to present a dual quaternion analysis (DQA) method for calculating the kingpin axis geometry. The corresponding parameters include the caster angle, SAI angle, toe angle, caster trail and scrub radius. An ADAMS/Car simulation model for the strut-SLA suspension is employed to assess the efficiency of the proposed method. Two distinctive marker sets and the marker coordinates are extracted from the kinematic model. In addition, the finite screw axis (FSA) method is employed for purposes of comparison with the DQA method. The results reveal that the marker distribution has a significant effect on calculating the position of the screw axis. In contrast to the FSA method, the DQA analysis is immune to any singularities because it enables the simultaneous matrix of rotation and translation. Thus, the proposed method is suitable for determining the kingpin axis and its related parameters in a K&C test.
Index Terms— suspension system, kingpin axis, dual quaternion analysis, finite screw axis
I. INTRODUCTION
HE kingpin axis (steering axis) geometry and its related parameters are crucial to the design of a suspension. Many driving characteristics, such as straight running stability, steering response, steering self-alignment, required steering force, breaking response and rolling response, are affected significantly by this virtual axis. SAE defines the kingpin axis as “the axis of rotation of the knuckle relative to the vehicle sprung mass when steered [1].” The kingpin axis is typically determined when the steering system is free of loads. Owing to the suspension kinematics and compliances, however, the kingpin axis may shift as the steering angle changes.
In general, a 3D rigid body motion can be defined by a combination of rotations about an axis and a translation
parallel to that axis. Several screw axis methods, such as the finite displacement screw axis (FSA) and the instant screw axis (ISA) have been widely used in the field of robotics and biomechanics [2-4]. However, the error in the direction and on the position of the FSA is much higher than the error of the measurement system. In addition, the information of the first derivative of the displacement signal is required for ISA analysis, which limits the use of ISA calculations in various practical measurements [5].
The measurement of the kingpin axis benefits an awareness of the characteristics of a car’s motion. Geometrical calculation and analytical method based on the FSA and ISA have been used for analyzing the imaginary kingpin axis [6]. ADAMS/Car, for example, offers geometric and instant axes methods for calculating the kingpin axis [7]. These methods always need the geometric data of the suspension system. Kinematic and compliance (K&C) test machines cannot measure directly the locations of suspension hard points. Therefore, wheel orientations, such as toe, camber and spin, are usually taken for calculating the kingpin axis parameters [8-10].
In this paper, the dual quaternion algebra (DQA) method for the kinematic analysis of the kingpin axis of a suspension has been presented. For this method, a dual quaternion representing a rotation and translation of a rigid body in 3D space was estimated, and this method has been proven to consistently outperform the singular value decomposition method. This approach was first utilized in the kingpin axis analysis of a car, with the landmark coordinates extracted from the kinematic model of ADAMS/Car. A strut-SLA suspension was analyzed. Then, the results of the proposed method were compared to those of the FSA and ADAMS analyses.
II. KINGPIN AXIS AND RELATED SUSPENSION PARAMETERS
Figure 1 shows the kingpin axes for ordinary types of suspensions. On an SLA or strut-SLA suspension, the kingpin axis is an imaginary line running through the center of the ball joints of the upper and lower control arms. On a strut suspension, the line runs through the upper strut mount and the lower ball joint. However, for a multi-link suspension, such as a five-link suspension, the kingpin axis cannot be determined geometrically [11].
Manuscript submitted on November 19, 2010 and has been accepted for the WCE 2011. This work was supported in part by the Metal Industries Research & Development Center, Taiwan.
Y-C Chen is with the Automotive Engineering Department, National Pingtung University of science and technology, Taiwan. (corresponding author, phone: +886-918519261; fax: +886-8-7740398; e-mail: c123@
mail.npust.edu.tw). The related parameters of the kingpin axis geometry are
shown in Figs. 2 and 3. The caster is a directional stability angle. Increases in the caster also tend to increase the caster trail, and therefore, contribute partially to an increase in steering stiffness. However, designers can increase the caster angle without increasing the caster trail by moving the caster line behind the center of the wheel. The caster will affect the
T
H-H Huang is with the Automotive Engineering Department, National Pingtung University of science and technology, Taiwan. (e-mail: sanlyhuang @ mail.npust.edu.tw).
C-H Hsieh is a graduate student at the Automotive Engineering Department, National Pingtung University of science and technology, Taiwan. (e-mail: [email protected]).
camber as well during cornering if it is not zero. This is referred to as the camber roll. A camber roll can wear both edges of a tire, and changes in the camber always cause changes in the toe.
SAI is another important directional control angle for the car. SAI and caster are somewhat similar in their effects because both of them are defined by the same kingpin axis. The kingpin axis offset at the ground is called scrub radius. A larger scrub radius makes the steering stiffness and tire wear increase. Moreover, whether the scrub radius is positive or negative will influence the toe specifications and braking stability.
Fig. 1. Kingpin axes for ordinary types of suspensions
Fig. 2. Kingpin axis geometry (front and side view)
Fig. 3. Kingpin axis geometry (top view)
III. DUAL QUATERNION ALGEBRA ANALYSIS
Due to the intrinsic shortcomings of FSA and ISA, an alternative method for the DQA for the kingpin axis calculation has been proposed in this study. 3D rotations can be represented as 3 numbers (Euler angles), but such a representation is non-linear and difficult to work with. Once the 3D space of the rotations is mapped to a 4D hypersphere, it becomes linear. Quaternion algebra is one possible way to represent 3D orientation or other rotational quantity associated with a solid 3D object. It is easier to interpolate between quaternions. Moreover, quaternions are easier to normalize than matrices; that is, quaternion algebra can cancel out a build up of small rounding errors [12-14].
Quaternions have 4 dimensions, also known as Euler symmetric parameters, one real dimension and 3 imaginary
dimensions. Quaternions are limited to representing rotation in a full 3D transformation; therefore, the translation vector must be expressed by another quaternion. A dual quaternion, however, provides a framework that can be used to represent both rotation and translation. Thus, the screw motion of a rigid body can be described as a dual angular displacement about a dual vector axis. Figure 4 shows the screw transformation for a dual quaternion.
Fig. 4. Screw transformation for a dual quaternion
A dual quaternion,
qˆ
, can be defined as:s
r
qˆ
=
+
ε
(1) where r and s are real quaternions and ε is defined as ε2 =0. r and s denote the real part and the dual part, respectively. The unit dual quaternion can be written as:⎥ ⎥ ⎦ ⎤ ⎢ ⎢ ⎣ ⎡ = /2) ˆ cos( nˆ /2) ˆ sin( qˆ θ
θ (2)
where and are the dual angle and the dual vector of the screw axis, respectively. They can be expressed as:
θ
ˆ
nˆ
d
ˆ θ ε
θ = + (3)
n p n
nˆ= +ε × (4) where θ and d are the angle rotating about the screw axis and the distance translating along the screw axis, respectively. In addition, the unit direction vector of n and a point p on the screw axis geometrically define the screw axis position. The resulting transformation of a screw axis in space then can be expressed directly as:
* '
qˆ
nˆ
qˆ
nˆ
=
(5) where is the transformed dual vector of the screw axis and is the conjugate of . Calculating from Eqns. (1)-(4), r and s can be easily obtained. Simultaneously, the two constraints, as below, will be satisfied:'
nˆ
*qˆ
qˆ
1
r
r
T=
(6)0
s
r
T=
(7) The two matrices for quaternion q, W(q) and Q(q), derived from a rotation matrix are defined as:⎥ ⎦ ⎤ ⎢ ⎣ ⎡ = s v q q
q (8)
⎥ ⎦ ⎤ ⎢ ⎣ ⎡ = s T v v v s q q q ) K(q -I q
W(q) (9)
⎥ ⎦ ⎤ ⎢ ⎣ ⎡ + = s T v v v s q q q ) K(q I q
skew-symmetric matrix. If, with the exact data, the position quaternions of a set of landmarks are denoted as p0i, when they move into the next configuration with the rigid body, the position quaternions are denoted as p0i′. The transformation becomes:
0i T T
0i W(r) s W(r) Q(r)p
p′ = + (11) Inherently, all measurements may contain experimental or numerical errors. Let pi and pi′ be the measured quaternions in the first and second configurations, respectively. pi can be expressed as: ⎥ ⎦ ⎤ ⎢ ⎣ ⎡ = 0 P 2 1
pi i (12)
where Pi is the position vector of the landmark. An estimate of the r and s is made to minimize the error function subject to the constraints of Eqs. (6) and (7). Three matrices, C1, C2 and C3, are computed from pi and pi′:
) W(p ) p Q( -2 C i T i i
1=
∑
α ′ (13)∑
= I
C2 αi (14)
∑
′=2 [W(p)-Q(p)]
C3 αi i i (15)
where αi is the weight factor reflecting the reliability of the data points. A 4×4 symmetric matrix, A, then, can be computed from C1, C2 and C3:
)] C -C -C ) C (C [C (1/2) A T 1 1 3 -1 T 2 2 T 3 +
= (16)
r r
A =λ (17) The quaternion r is an eigenvector of matrix A and λ is the corresponding eigenvalue. If the largest positive eigenvalue is selected, the error is minimized. Once r is obtained, quaternion s can be derived using the following equation:
r C ) C -(C s 3 -1 T 2 2+
= (18) Then, the transformation matrix can be derived from r and s:
Q(r) W(r) 1 0 0 R T
T ⎥=
⎦ ⎤ ⎢ ⎣
⎡ (19)
s W(r) t 0 2
1 = T
⎥ ⎦ ⎤ ⎢ ⎣
⎡ (20)
where R is the rotation matrix and t is the translation vector. The orientation vector of rotation axis n, rotation angle θ, translation distance d and point p on the axis also can be calculated as:
r / r
n= v (21)
) r / (r 2cos s -1 =
θ (22) /2)
/sin( 2s
d= s θ (23) /2) /2)n]/sin( (d/2)cos( -[s K(-n)
p= -1 θ θ (24)
where rv and rs represent the vector and scalar parts of quaternion r, respectively.
IV. KINEMATIC ANALYSIS
The front strut-SLA suspension was modeled by ADAMS/Car software, as shown in Fig. 5. Steering analysis is usually employed to investigate how the suspension and steering characteristics change through the steering range of motion of the suspension. A steering analysis steers the wheels over the specified steering-wheel angle or rack travel displacement from the upper to the lower bound. The
application of steering motion results in a wheel displacement at the specified wheel height. In this study, the geometrical method was adopted for the ADAMS/Car steering analysis.
The steering analysis was completed with a steering-wheel input of -540°~540° and, the gear ratio for the strut-SLA suspension was 0.11. Let the distinctive three points on the clamp of the front wheel be one set of landmarks. Depending on the curve of the steered wheel, the upright rotated around a virtual axis in space. The successive positional data of the landmarks with the interval of one degree steering-wheel were extracted for analytic screw analysis. As shown in Fig. 6, two sets of landmarks, denoted as Am and Bm, were entered into the calculation of the kingpin axis. The arrangement of the landmark locations in this model was similar to that of a real K&C test machine, thus providing a compatible base for future data analysis.
Fig. 5. Kinematic model of the Fig. 6. Wheel clamp and marker strut-SLA suspension set positions
V. VALIDATION OF RESULTS
The simulation results were primarily used to validate the calculated results from the DQA analysis. The kingpin axis locations and the related parameters, including caster, SAI, caster trail and scrub radius, were compared systematically. Moreover, the FSA method was selected in order to compare its effectiveness with the DQA method.To simplify the DQA analysis, the weight factor αi was set to 1. A Matlab code with the DQA algorithms was developed to compute all the matrices and eigenvalue, then the kingpin axis locations.
A. Orientations of Kingpin Axis
Based on the DQA and FSA analyses for the strut-SLA suspension, the caster, SAI and rotation (toe) angles during the steering motion were calculated from the screw axes. Figures 7-12 show the comparison of those curve-fitting data with the ADAMS/Car results.
Fig. 8. Caster angle (marker set B)
Fig. 9. SAI angle (marker set A)
Fig. 10. SAI angle (marker set B)
Fig. 11. Toe angle (marker set A)
Fig. 12. Toe angle (marker set B)
The castor and SAI angle are responsible for the change of camber angle when steering. It can be seen that the shift of the kingpin axis was rather small in the total range of steering. In the ADAMS/Car analysis, there was about a 0.35% and 0.64% maximum change for the caster and SAI angles, respectively. The difference in the calculating algorithms of the DQA, FSA and ADAMS/Car analyses reflected the difference of the caster and SAI angles, which also led to a variation in the results of the different marker sets used.
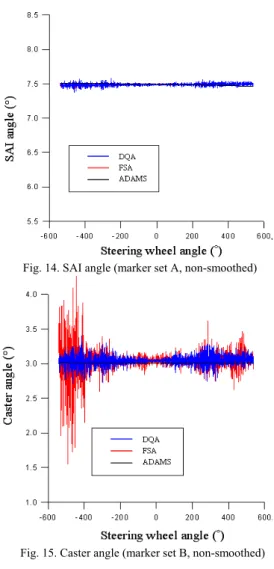
Figures 13 and 14show the non-smoothed caster and SAI angles calculated from the position data of the marker set Am. The perturbed caster and SAI curves caused by cyclic changes of the matrices’ components were found in the DQA and FSA analyses. However, they were reasonably close to the ADAMS/Car results while smoothing. It is noticed that the perturbations were much stronger when the marker set Bm was used, an example as shown in Fig. 15.The reason was that the variations of the successive markers’ positions in each coordinate axis were too close for two markers in turn. Figures 16 and 17, respectively; show the coordinate changes of marker set A and B. The fitted caster and SAI curves also matched well to the ADAMS/Car results due to the symmetry of perturbations. The rotation angles of the kingpin axis calculated from both screw axis methods, however, agreed very well with the toe angle results of ADAMS.
Figure 18 shows the camber angle results. The values computed from the planes of both marker sets were near the same with those of ADAMS/Car except around the wheel lock position of left-turn. This might be caused by the inconsistent camber change rate due to the slightly toe angle variations.
Fig. 14. SAI angle (marker set A, non-smoothed)
Fig. 15. Caster angle (marker set B, non-smoothed)
Fig. 16. Coordinate changes of marker set A
Fig. 17. Coordinate changes of marker set B
Fig. 18. Camber angles (marker sets A and B)
Using the FSA method to describe the kinematics of kingpin axis geometry has a drawback in that the orientation and position of the screw axis are dependent on the coordinate system. Furthermore, it is considerably sensitive to the direction of the marker’s displacement. If the direction is nearly parallel to the screw axis, significant fluctuations may appear in the successive calculated data. The latter situation happens occasionally and is not easy to control; as, for example, when using the same marker set to calculate the roll axis in a K&C test machine (the author’s previous study). The DQA method was immune to any singularities because it enabled the simultaneous matrix of rotation and translation. In addition, it cooperated this way to deal with the noisy data. The efficiency of the DQA method has been confirmed in this study. Having the advantages as mentioned, the DQA method can be used for calculating kingpin axis successfully.
B. Parameters Related to the Kingpin Axis
Figures 19-22 show the caster trail and scrub radius with respect to the steering wheel angle for the strut-SLA suspension. These fitted data resulted from the DQA, FSA and ADAMS analyses separately.
Fig. 20. Caster trail (marker set B)
Fig. 21. Scrub radius (marker set A)
Fig. 22. Scrub radius (marker set B)
The caster offset, also referred as the mechanical trail, generates a movement around the z-axis of the steering axis during cornering. In the DQA and FSA analyses, the caster trails calculated from the two marker sets of Am and Bm were nearly equal. However, there was a constant difference of 5% from the ADAMS results. This discrepancy was the consequence of the different measurement methods for the wheel contact point.
With regard to the scrub radius, the results of DQA method were also close to those of FSA. But an evident deviation from ADAMS was found when making a right turn of the wheel. Same as the caster trail, this variation was related to the different positions of kingpin axes and wheel contact points. The scrub radius for the strut-SLA suspension changed only slightly. It was used to calculate the influence of braking and driving forces on the steering wheel. The marker distribution proved to have a significant effect on
calculating the screw axis. Thus, a stronger perturbation of the caster trail and scrub radius curves were also found when using marker set Bm.
VI. CONCLUSION
This paper has presented a new application for calculating the kingpin axis of a strut-SLA suspension during steering motion by the method of DQA. The conclusions for this study are summarized as follows:
1.The marker distribution proved to have a significant effect on calculating the screw axis, but the rotation angle was insensitive to it.
2.The perturbations were found on caster and SAI curves in the DQA and FSA analyses. It was caused by the cyclic changes of the matrices’ components. However, these curves were reasonably close to the ADAMS/Car results while smoothing.
3.In contrast to the FSA method, the DQA analysis enabled the simultaneous matrix of rotation and translation. Thus, it was immune to any singularities. This method can be used to calculate the kingpin axis geometry successfully.
REFERENCES
[1] SAE, Vehicle Dynamics Terminology, SAE J670e, last revised 1976.
[2] R. G. Fenton and R.A. Willgoss, “Comparison of Methods for
Determining Screw Parameters of Infinitesimal Rigid Body Motion From Position and Velocity Data,” ASME Journal of Dynamic Systems, Measurement, and Control, 112, pp. 711-716, 1990.
[3] A. R. Vithani and K. C. Gupta, “Estimation of Object Kinematics From Point Data,” ASME Journal of Mechanical Design, 126, pp. 16-21, 2004.
[4] Á. Page, H. D. Rosario, V. Mata and C. Atienza, ”Experimental Analysis of Rigid Body Motion: A Vector Method to Determine Finite and Infinitesimal Displacements From Point Coordinates,” ASME Journal of Mechanical Design, 131, pp. 031005-1-031005-8, 2009. [5] C. H. Suh, “Suspension Analysis with Instant Screw Axis Theory,”
SAE Paper 910017, 1991.
[6] L. Unkoo and A. Byeongeul, “A Method to Analyze the Imaginary Kingpin Axis in Multi-Link Type Suspension Systems,” SAE Paper 930262, pp. 11-26, 1993.
[7] MSC software, ADAMS User’s Manual, Santana, California, 2007.
[8] W. C. Mitchell, R. Simons, T. Sutherland and K. L. Michael,
“Suspension Geometry: Theory vs. K&c Measurement,” SAE Paper 2008-01-2948, 2008.
[9] J. -H. Heo, U. -K. Lee, and S. -H. Lee, “Development of a Method to Compute the Kingpin Axis Using Screw Axis Theory Based on Suspension-Parameter- Measuring Device Data,” Proc. IMechE, Part D: J. Automobile Engineering, Vol. 223, pp. 519-531, 2009.
[10] T. Best, S. J. Neads, J. P. Whitehead and I. R. Willows, “Design and Operation of a New Vehicle Suspension Kinematics and Compliance Facility,” SAE Paper 970096, 1997.
[11] W. Lamers, “Development and Analysis of a Multi-Link Suspension for Racing Applications,” Master’s Thesis, Eindhoven University of Technology, the Netherlands, 2008.
[12] R. Aissaoui, H. Mecheri, N Hagemeister and J.A. de Guise, “Robust estimation of screw axis from 3D pose using dual quaternion algebra,” Ninth International Symposium on the 3D Analysis of Human Movement,” Valenciennes, France, Jun. 2006.
[13] M. W. Walker and L. Shao, “Estimating 3-D Location Parameters Using Dual Number Quaternions,” CVGIP: Image Understanding, Vol. 54, No. 3, pp. 358-367, 1991.
[14] E. Most, J. Axe, H. Rubash, and G. Li, “Sensitivity of the joint kinematics calculation to selection of flexion axes,” J. Biomech., Vol. 37, pp. 1743-1748, 2004.G. O. Young, “Synthetic structure of industrial plastics (Book style with paper title and editor),” in