www.atmos-chem-phys.net/10/10917/2010/ doi:10.5194/acp-10-10917-2010
© Author(s) 2010. CC Attribution 3.0 License.
Chemistry
and Physics
Different photolysis kinetics at the surface of frozen freshwater vs.
frozen salt solutions
T. F. Kahan1,*, N.-O. A. Kwamena1, and D. J. Donaldson1,2
1Department of Chemistry, University of Toronto, 80 Saint George Street, Toronto, M5S 3H6 Ontario, Canada 2Department of Physical and Environmental Sciences, University of Toronto at Scarborough, Canada
*currently at: Department of Chemistry, University of California Irvine, Irvine, California, 92697, USA Received: 21 April 2010 – Published in Atmos. Chem. Phys. Discuss.: 7 May 2010
Revised: 10 November 2010 – Accepted: 15 November 2010 – Published: 22 November 2010
Abstract.Reactions at air-ice interfaces can proceed at very
different rates than those in aqueous solution, due to the unique disordered region at the ice surface known as the quasi-liquid layer (QLL) . The physical and chemical nature of the surfacial region of ice is greatly affected by solutes such as sodium halide salts. In this work, we studied the effects of sodium chloride and sodium bromide on the pho-tolysis kinetics of harmine, an aromatic organic compound, in aqueous solution and at the surface of frozen salt solutions above the eutectic temperature. In common with other aro-matic organic compounds we have studied, harmine photol-ysis is much faster on ice surfaces than in aqueous solution, but the presence of NaCl or NaBr – which does not affect photolysis kinetics in solution – reduces the photolysis rate on ice. The rate decreases monotonically with increasing salt concentration; at the concentrations found in seawater, harmine photolysis at the surface of frozen salt solutions pro-ceeds at the same rate as in aqueous solution. These results suggest that the brine excluded to the surfaces of frozen salt solutions is a true aqueous solution, and so it may be possi-ble to use aqueous-phase kinetics to predict photolysis rates at sea ice surfaces. This is in marked contrast to the result at the surface of frozen freshwater samples, where reaction kinetics are often not well-described by aqueous-phase pro-cesses.
1 Introduction
Chemical reactions in snow and ice can affect pollutant fate and atmospheric composition (Domine and Shepson 2002; Grannas et al., 2007b) in urban and remote centres. Vari-ous aspects of snowpack chemistry have been investigated
Correspondence to:D. J. Donaldson
(jdonalds@chem.utoronto.ca)
through field, laboratory, and theoretical studies (ibid). How-ever, there is not yet a fundamental understanding of the role of snow and ice as reaction media; thus, accurately predict-ing the chemical fate of species in snow and ice remains an elusive goal.
no reaction is observed (Kahan et al., 2010a). These results suggest that liquid inclusions in ice (such as those at grain boundaries) present similar reaction environments to liquid water, but that the QLL presents a unique reaction environ-ment.
It is likely that many atmospheric reactions occur in the QLL, since reagents can both be excluded to the air-ice in-terface during freezing, and be deposited there from the gas phase. As discussed above, reactivity in the QLL can be quite different from that either in aqueous solution or liquid inclu-sions in bulk ice; therefore, measurements must selectively probe the air-ice interface in order to describe physical prop-erties of the QLL, and to properly report reaction kinetics that occur there.
One would certainly expect that the physical properties of ice surfaces could affect chemical reactions which occur there. However, few studies have investigated these proper-ties under environmentally relevant conditions; most inves-tigations of QLL properties have used single-crystalline ice in pristine conditions in the absence of solutes. In the en-vironment, ice is generally polycrystalline, and it is rarely pristine. Common solutes such as halide salts can signifi-cantly alter the molecular structure at air-ice interfaces, and thus possibly affect reaction kinetics there.
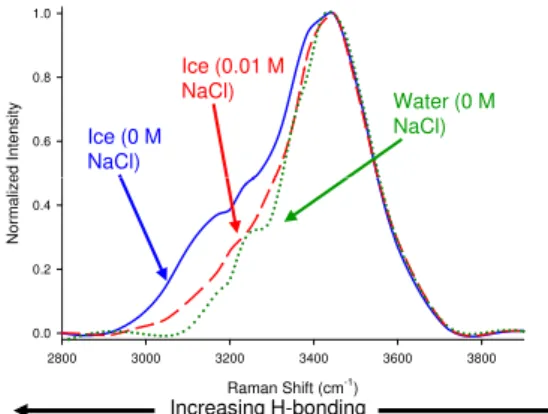
During freezing of a solution, ionic compounds such as halide salts are excluded from the ice matrix. Below the eutectic temperature of a salt-water mixture, a solid solu-tion of ice and salt is formed. Above the eutectic tempera-ture, halide exclusion results in the formation of concentrated brines in veins and pockets within bulk ice, as well as at the air-ice interface (Carignano et al., 2007; Cho et al., 2002; Eicken 1992). The exclusion of salts to the air-ice inter-face may also be inferred from their influence on the Raman spectrum of water molecules present there. Figure 1 shows glancing-angle Raman spectra (Kahan et al., 2007) of vari-ous aquevari-ous interfaces acquired in this laboratory. The spec-trum observed from the surface of a frozen freshwater sam-ple (solid blue trace) is asymmetric, with a broad shoulder around 3100 cm−1. This feature, which is not observed at the liquid water surface (shown as the dotted green trace) arises from a more extensive hydrogen bonded network present at the ice surface, compared to liquid water (Kahan et al., 2007). The shoulder is not observed at the surface of frozen NaCl so-lutions, as illustrated by the red dashed trace in Fig. 1. This observation implies that the surface of frozen salt solutions represent a different hydrogen bonding environment than that at the freshwater ice-air interface.
The decreased hydrogen bonding at the surface of frozen saltwater solutions has two possible explanations. First, the halide ions could disrupt the QLL by competing for hydrogen bonds with the water molecules present there. An alternate explanation is that the halide ions cause the formation of a true liquid brine at the ice surface. This is an important dis-tinction because, as discussed previously, reaction kinetics in the QLL can be very different from kinetics in aqueous
so-e
d I
n
tens
it
y
0.6 0.8 1.0
Ice (0 M NaCl)
Ice (0.01 M
NaCl) Water (0 M
NaCl)
2800 3000 3200 3400 3600 3800
N
o
rm
aliz
e
0.0 0.2 0.4
Raman Shift (cm-1)
Increasing H-bonding
Fig. 1. Intensity-normalized glancing-angle Raman spectra of the
surface of freshwater ice, of a frozen 0.01 mol L−1NaCl solution,
and of the surface of liquid freshwater. The lower relative intensity at lower wavenumbers for the frozen salt solution and the liquid freshwater is indicative of reduced hydrogen bonding there.
lution. Therefore, we might expect quite different kinetics at the surfaces of frozen salt solutions depending on which explanation is correct. If halide ions simply disrupt the QLL structure, reactions on sea ice surfaces could occur at sim-ilar rates as on frozen freshwater surfaces. However, if a concentrated liquid brine exists at thesurfaceof frozen salt solutions, as well as within the liquid inclusions present in the iced matrix, one might expect the reaction kinetics to be similar to those in aqueous solution. In fact, recent mea-surements of the heterogeneous ozonation kinetics at the sur-face of frozen NaBr and NaI solutions (Wren et al., 2010) show kinetics which are consistent with the reaction occur-ring in concentrated aqueous solutions. In the present study, we measure photolysis kinetics of an organic probe molecule in aqueous solution and at the surfaces of frozen freshwater and salt solutions to determine whether the reaction environ-ment at the surface of frozen salt solutions is more similar to a QLL or to aqueous solution.
2 Experimental
The aromatic compound harmine (7-methoxy-1-methyl-9H-pyrido[3,4-b]indole) was chosen as a molecular probe be-cause its fluorescence is not strongly quenched in high ionic strength environments (Clifford et al., 2007). Solutions containing 1×10⁻⁷mol L−1 harmine (Aldrich, 98%) and a known concentration of either NaCl or NaBr (both ACP Chemicals, 99%) were prepared daily in 18 Mcm deion-ized water. Samples were irradiated by the output of a 75 W xenon arc lamp which passed through a 295 nm longpass cutoff filter. A first-surface mirror with maximum reflectiv-ity at 355 nm directed the lamp’s output downward onto the sample at an angle of approximately 45◦
.
reaction chamber which has been described previously (Ka-han and Donaldson, 2007). Briefly, the chamber consists of a Teflon box with cooling tubes running beneath the copper floor of the chamber; the floor was maintained at ∼253 K for experiments on ice. Approximately 1 mL of solution was pipetted onto a small copper plate on the chamber floor and allowed to freeze from bottom to top. The ice samples, which froze over the course of∼10 min, resembled small pancakes with diameters of approximately 1.5 cm and heights of 1– 2 mm. The ice that was formed was transparent, with bubbles visible throughout the sample.
Kinetics were determined by monitoring harmine fluores-cence intensity during irradiation. Fluoresfluores-cence was induced by the unfocussed 337 nm output of a nitrogen laser, and col-lected by a liquid light guide (LLG). For aqueous samples in cuvettes, the LLG was positioned to the side of the cu-vette, perpendicular to the laser beam. For experiments on ice, the laser beam entered the reaction chamber through a quartz window at a shallow angle (>85◦ from the surface
normal), such that it impinged upon the ice surface. The LLG was positioned approximately 7 mm above the sample. This geometry affords us surface sensitivity (Kahan et al., 2007), and allows us to measure kinetics at air-ice interfaces (Ka-han and Donaldson 2007, 2008, 2010; Ka(Ka-han et al., 2010a, b; Wren et al., 2010).
The emission collected by the LLG passed through a monochromator set to 430 nm, where harmine emits strongly, then was detected by a photomultiplier tube whose output was collected on a digital oscilloscope. The fluorescence de-cay was averaged over 64 laser shots; a 500 ns slice of the decay was captured and stored for analysis. Fluorescence in-tensity was measured in the dark for several minutes at the beginning of each experiment to ensure that no dark loss was occurring. The sample was then irradiated for up to 4 hours, with fluorescence intensity acquired at known time intervals ranging from 1–10 min. The xenon arc lamp was blocked during data acquisition.
3 Results and discussion
Figure 2a shows representative semi-logarithmic results for the loss of harmine, measured via its fluorescence intensity, observed during irradiation in aqueous solution and at an air-ice interface. In aqueous solution, the fluorescence decay is well-described by a single exponential fit, indicating that the reaction is first-order in harmine. At the air-ice inter-face, some experiments showed an initial very fast loss of harmine followed by a slower loss, which was several times more rapid than seen in the liquid. For these results, both single and double exponentials provide good fits to the data, with the double exponential generally providing a slightly better fit. In this work we present the first-order rate con-stants based on single-exponential fits to the data. To check that the photolytic loss was not due a self-reaction on the ice
0
(a)
n
(I
/Io
)
-2 -1
In aqueous solution (a)
ln
-4 -3
N N
CH3
H
O
CH3 On ice
0.12
Time (min)
0 10 20 30 40 50
4
(b)
(Intens
ity
)
-1
0.06 0.08 0.10
0 10 20 30 40 50
0.00 0.02 0.04
Time (min)
Fig. 2. (a)Loss of harmine emission intensity as a function of
irra-diation time in aqueous solution and at an air-ice interface shown as semi-log plots (first-order kinetics). The solid traces are linear fits to the data. The inset displays the chemical structure of harmine;
(b)the change in (harmine emission intensity)−1as a function of
irradiation time at an air-ice interface (second-order kinetics). The solid trace is a linear fit to the data.
surface, a second-order kinetic analysis was carried out, il-lustrated in Fig. 2b. Second-order kinetic analysis provides a poor fit to the data, implying that the reaction is not bimolec-ular.
The measured photolysis rate is approximately 4 times greater on ice than in aqueous solution. Many bimolecu-lar reactions show enhanced rates in frozen solution, due to solute exclusion yielding enhanced concentrations in liq-uid regions within the ice matrix (Pincock, 1969). This freeze-concentration effect has recently been demonstrated for a bimolecular reaction in ice under atmospheric condi-tions (Grannas et al., 2007a). However, solute exclusion (harmine in the present case) can not explain the enhanced reaction rate we observe at the air-ice interface: The kinet-ics we observe are first-order with respect to harmine, which means that the reaction is unimolecular, and thus the rate con-stant is independent of concentration.
1.0 Ice
a
liz
ed In
tensit
y
0.6 0.8
Norm
a
0 0 0.2 0.4
Water
Excitation Wavelength (nm)
280 300 320 340
0.0
Fig. 3.The solid trace shows an absorption spectrum of harmine in
room temperature aqueous solution; the crosses indicate an excita-tion spectrum of harmine at an air-ice interface at 253 K.
Donaldson, 2007), we measured identical first order rate con-stants at the air-ice interface whether anthracene was frozen from solution (in which case freeze-concentration effects could influence the kinetics) or whether it was deposited from the gas phase. The kinetics were also insensitive to the amount of anthracene deposited on the surface, further argu-ing against enhanced concentrations on ice beargu-ing responsible for the faster photolysis kinetics there.
There are several possibilities other than reagent concen-tration which could explain the different reaction rates mea-sured in aqueous solution and at air-ice interfaces. We have discussed these at length previously (Kahan and Donaldson 2007, 2010; Kahan et al., 2010b). Aromatic compounds tend to self-associate at air-ice interfaces, even at low surface coverages (Ardura et al., 2009; Kahan and Donaldson 2007, 2008, 2010). Even in the absence of self-reaction, such as-sociation can lead to red-shifts in the absorption spectra. For species which absorb primarily at wavelengths below 295 nm in aqueous solution, even a slight red-shift can significantly enhance the photolysis kinetics, as we reported for the case of benzene on ice (Kahan and Donaldson 2010). In the present case, there appears to be no such red shift, however. Fig-ure 3 compares the absorption spectrum of harmine in aque-ous solution with the excitation spectrum measured at the air-ice interface. There is significant spectral overlap, with the majority of light absorption occurring at wavelengths above 295 nm in both media. Therefore, a red-shift in harmine ab-sorbance on ice does not explain the enhanced reaction rates we observe there.
Another factor that can affect photochemical reaction rates is photon flux. It is quite likely that scattering by the ice gives rise to a different light intensity at the ice surface than that occurring in aqueous solution. We have recently inves-tigated the effect of varying light intensity on the photol-ysis kinetics of strongly absorbing aromatic compounds in aqueous solution and at ice surfaces (Kahan and Donaldson 2010; Kahan et al., 2010b). Surprisingly, both in solution and on ice surfaces we found a saturation in the first order
0.0012
s
(s
-1)
0.0006 0.0008
0.0010 NaCl (296 K) NaCl (253 K) NaBr (253 K)
kob
0.0002 0.0004
4
[NaX] in solution (mol L-1
)
0.0 0.2 0.4 0.9 1.0 0.0000
4
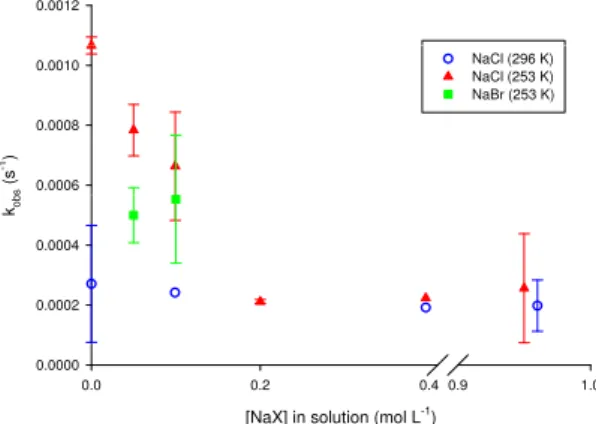
Fig. 4.Observed rate constants for harmine photolysis as a function
of salt concentration: In aqueous solution at room temperature (hol-low blue circles); at the surface of frozen aqueous NaCl solutions at 253 K (solid red triangles) and at the surface of frozen aqueous NaBr solutions at 253 K (solid green squares). Error bars represent the uncertainty about the mean for at least three trials.
photolysis rates of anthracene above an irradiance thresh-old of about 1×10¹³ photon cm−2s−1. The lamp power used in the present experiments corresponds to photon fluxes of∼3×10¹³photon cm−2s−1. Given the similar absorption strengths for harmine and anthracene in the actinic spectral region, it seems unlikely that the faster harmine photolysis kinetics on ice are due to differences in light intensity there.
The discussion above outlines why we are confident that the enhanced photolysis rates on ice are due to differences in the physical nature of the QLL at the air-ice interface com-pared to that of liquid water. The situation becomes different at the surface of frozen salt solutions. Figure 4 shows the rate constants obtained from the slopes of plots like those shown in Fig. 2 for harmine photolysis in aqueous solution and at air-ice interfaces under a range of salt concentrations. As displayed by the hollow symbols, the presence of salt does not affect harmine photolysis kinetics in aqueous solution up to 1 mol L−1NaCl, which roughly corresponds to seawa-ter concentrations. At air-ice inseawa-terfaces atT=253 K, how-ever, increasing the salt concentration of the solution prior to freezing decreases the photolysis rate, indicated by the red triangles, until NaCl concentrations exceed ∼0.2 mol L−1, at which point the observed rate at the ice surface becomes identical to that in aqueous solution. Experiments were also performed on frozen solutions of NaBr at 253 K having ini-tial [NaBr] of 0.05 and 0.1 mol L−1, as indicated by the green squares in Fig. 4. The photolysis rate is more suppressed in the presence of NaBr than NaCl for a similar solution salt concentration.
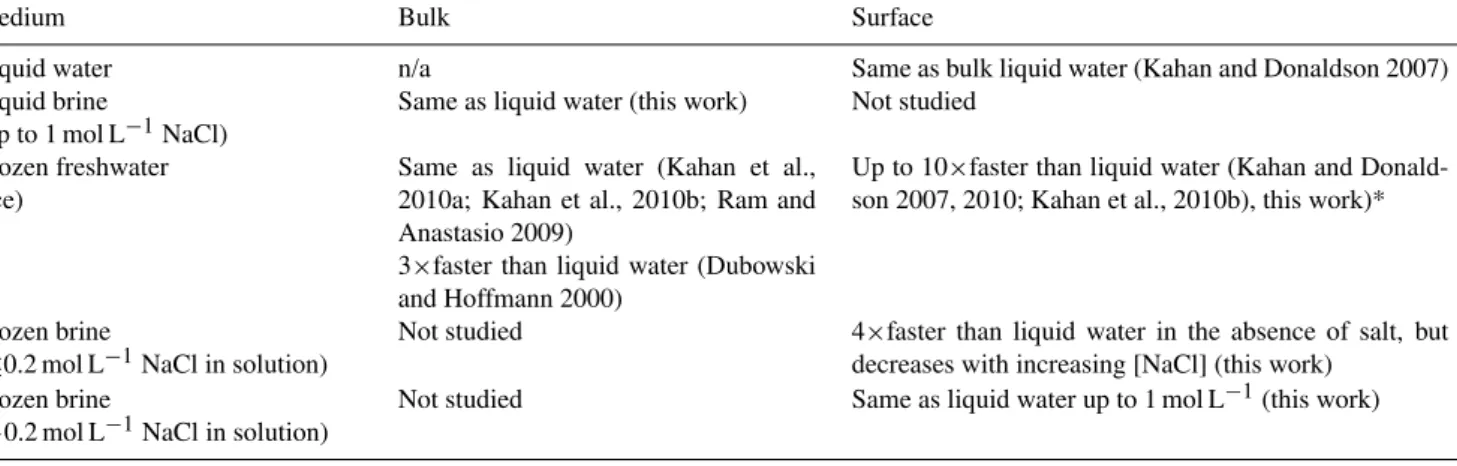
Table 1. Predicted photochemical behaviour of aromatic compounds in and at the surface of liquid and frozen aqueous media, relative to those in bulk liquid water
Medium Bulk Surface
Liquid water n/a Same as bulk liquid water (Kahan and Donaldson 2007) Liquid brine
(up to 1 mol L−1NaCl)
Same as liquid water (this work) Not studied
Frozen freshwater (ice)
Same as liquid water (Kahan et al., 2010a; Kahan et al., 2010b; Ram and Anastasio 2009)
3×faster than liquid water (Dubowski and Hoffmann 2000)
Up to 10×faster than liquid water (Kahan and Donald-son 2007, 2010; Kahan et al., 2010b), this work)*
Frozen brine
(≤0.2 mol L−1NaCl in solution)
Not studied 4×faster than liquid water in the absence of salt, but decreases with increasing [NaCl] (this work)
Frozen brine
(>0.2 mol L−1NaCl in solution)
Not studied Same as liquid water up to 1 mol L−1(this work)
∗The rate enhancements for benzene and naphthalene are due at least in part to red-shifts in the absorption spectra. It is possible that other aromatic species display greater rate
enhancements on ice than the factor of 10 reported here.
sample at equilibrium should consist of a mixture of solid ice and NaCl solution, having a concentration of∼4.5 mol L−1. The overall amount of this brine is dependent on the over-all amount of NaCl present; however, how this is dis-tributed among the air-ice interface, liquid inclusions and grain boundaries is not predicted. The results of Cho et al. (Cho et al., 2002) indicate that brine exists in all of these locations. Nevertheless, comparison of the NaCl and NaBr phase diagrams suggests that under our experimental condi-tions, the NaBr system should contain a greater volume of brine at 253 K than does frozen NaCl having the same over-all salt concentration.
With this in mind, we interpret the dependence of the ice surface photolysis rate on initial salt concentration to arise from increasing amounts of liquid brine being excluded to the air-ice interface as the salt concentration increases. Thus the observed kinetics at low initial [NaX] represent a combi-nation of “true” QLL kinetics (fast), with those appropriate for the aqueous surface (slow); as the overall [NaX] increases the fraction of the air-ice interface which is well described as a true brine increases, giving rise to a decrease in the ob-served rate. Eventually (at [NaCl]>0.2 mol L−1)the surface is completely coated in brine, so that the kinetics are well described by those seen on the liquid surface.
This interpretation, based on equilibrium phase behaviour, should be used with caution, however, and is unlikely to give quantitative predictions. One study of NMR spectra of frozen brine solutions (Cho et al., 2002) suggested that salt con-centrations in frozen brines above the eutectic temperature are well-described by thermodynamic phase diagrams even with more rapid cooling than was used in our experiments. However, Thibert and Domine show that environmental ice and snow is not equilibrated with potential solutes (in their
case gas phase HCl) (Thibert and Domine 1997). Given the further uncertainties in whether the same brine concentra-tion exists at the interface as in liquid inclusions within the ice matrix, over reliance on thermodynamic phase diagrams seems unwarranted.
The results of this study expand our understanding of en-vironmental ice surfaces as reaction substrates. The ob-served harmine photolysis kinetics suggest that the liquid brine formed at the surface of frozen seawater has physical properties more similar to liquid water than to the QLL at air-ice interfaces. Halide concentrations in remote inland po-lar regions are orders of magnitude lower than those in sea-water (Grannas et al., 2007b), and should not form liquid brines. In urban snows, however, chloride concentrations of
∼0.02 mol L−1have been reported (Tatarniuk et al., 2009), due primarily to road salt. At this concentration, reaction ki-netics may differ from those at the surface of the relatively pristine ice found for example in polar regions.
To conclude, we present a summary (shown in Table 1) of the photochemical transformation behaviour observed for aromatic compounds in and on ice in this study and oth-ers (Dubowski and Hoffmann 2000; Kahan and Donaldson 2007, 2010; Kahan et al., 2010b; Ram and Anastasio 2009). It is clear that in order to accurately predict the fate of species in snowpacks, we must understand both the composition of the ice and the partitioning of the reagents (i.e. sequestered within the bulk versus present at the air-ice interface).
Acknowledgements. The authors thank NSERC and CFCAS for funding. T. F. K. thanks NSERC for a CGS doctoral scholarship. The authors thank F. Domin´e and P. B. Shepson for helpful discussions.
References
Akinfiev, N. N., Mironenko, M. V., and Grant, S. A.: Thermody-namic properties of NaCl solutions at subzero temperatures, J. Solution Chem., 30, 1065–1080, 2001.
Ardura, D., Kahan, T. F. and Donaldson, D. J.: Self-association of naphthalene at the air-ice interface, J. Phys. Chem. A, 113, 7353– 7359, 2009.
Carignano, M. A., Shepson, P. B., and Szleifer, I.: Ions at the ice/vapor interface, Chem. Phys. Lett., 436, 99–103, 2007. Cho, H., P. B. Shepson, L. A. Barrie, et al.: NMR investigation
of the quasi-brine layer in ice/brine mixtures, J. Phys. Chem. B, 106, 11226-11232, 2002.
Chu, L. and Anastasio, C.: Quantum yields of hydroxyl radical and nitrogen dioxide from the photolysis of nitrate on ice, J. Phys. Chem., 107, 9594–9602, 2003.
Chu, L. and Anastasio, C.: Formation of hydroxyl radical from the photolysis of frozen hydrogen peroxide, J. Phys. Chem. A 109, 6264–6271, 2005.
Chu, L. and Anastasio, C.: Temperature and wavelength depen-dence of nitrite photolysis in frozen and aqueous solutions, Env-iron. Sci. Technol., 41, 3626–3632, 2007.
Clifford, D., Bartels-Rausch, T., and Donaldson, D. J.: Suppres-sion of aqueous surface hydrolysis by monolayers of short chain organic amphiphiles, Phys. Chem. Chem. Phys., 9, 1362–1369 2007.
Domine, F. and Shepson, P. B.: Air-snow interactions and atmo-spheric chemistry, Science, 297, 1506–1510, 2002.
Dubowski, Y. and Hoffmann, M. R.: Photochemical transforma-tions in ice: Implicatransforma-tions for the fate of chemical species, Geo-phys. Res. Lett., 27, 3321–3324, 2000.
Eicken, H.: Salinity Profiles of Antarctic Sea Ice – Field Data and Model Results, J. Geophys. Res. Oceans, 97, 15545–15557, 1992.
Grannas, A. M., Bausch, A. R., and Mahanna, K. M.: Enhanced aqueous photochemical reaction rates after freezing, J. Phys. Chem. A, 111, 11043–11049, 2007a.
Grannas, A. M., Jones, A. E., Dibb, J., Ammann, M., Anastasio, C., Beine, H. J., Bergin, M., Bottenheim, J., Boxe, C. S., Carver, G., Chen, G., Crawford, J. H., Domine, F., Frey, M. M., Guzman, M. I., Heard, D. E., Helmig, D., Hoffmann, M. R., Honrath, R. E., Huey, L. G., Hutterli, M., Jacobi, H. W., Klan, P., Lefer, B., McConnell, J., Plane, J., Sander, R., Savarino, J., Shepson, P. B., Simpson, W. R., Sodeau, J. R., von Glasow, R., Weller, R., Wolff, E. W., and Zhu, T.: An overview of snow photochem-istry: evidence, mechanisms and impacts, Atmos. Chem. Phys., 7, 4329–4373, doi:10.5194/acp-7-4329-2007, 2007b.
Jacobi, H. W., Annor, T., and Quansah, E.: Investigation of the photochemical decomposition of nitrate, hydrogen peroxide, and formaldehyde in artificial snow, J. Photochem. Photobiol. A-Chem., 179, 330–338, 2006.
Kahan, T. F. and Donaldson, D. J.: Photolysis of polycyclic aro-matic hydrocarbons on water and ice surfaces, J. Phys. Chem. A, 111, 1277–1285, 2007.
Kahan, T. F. and Donaldson, D. J.: Heterogeneous ozonation kinet-ics of phenanthrene at the air-ice interface, Environ. Res. Lett., 3, 045006, doi:10.1088/1748-9326/3/4/045006, 2008.
Kahan, T. F. and Donaldson, D. J.: Benzene photolysis at air-ice interfaces: Implications for the fate of organic pollutants in the winter, Environ. Sci. Technol., 44, 3819–3824, 2010.
Kahan, T. F., Reid, J. P. and Donaldson, D. J.: Spectroscopic probes of the quasi-liquid layer on ice, J. Phys. Chem. A, 111, 11006– 11012, 2007.
Kahan, T. F., Zhao, R., and Donaldson, D. J.: Reactivity of Hy-droxyl Radicals at Air-Ice Interfaces, Atmos. Chem. Phys., 10, 843–854, 2010a,
http://www.atmos-chem-phys.net/10/843/2010/.
Kahan, T. F., Zhao, R., Jumaa, K. B. and Donaldson, D. J.: An-thracene Photolysis in Aqueous Solution and Ice: Photon Flux Dependence and Comparison of Kinetics in Bulk Ice and at the Air-Ice Interface, Environ. Sci. Technol., 44, 1303–1306, 2010b. Matykiewiczova, N., Kurkova, R., Klanova, J., and Klan, P.: Pho-tochemically induced nitration and hydroxylation of organic aro-matic compounds in the presence of nitrate or nitrite in ice, J. Photochem. Photobiol. A-Chem., 187, 24–32, 2007.
Pincock, R. E.: Reactions in frozen systems, Acc. Chem. Res., 2, 97–103, 1969.
Ram, K. and Anastasio, C.: Photochemistry of phenanthrene, pyrene, and fluoranthene in ice and snow, Atmos. Environ., 43, 2252–2259, 2009.
Tang, M., Tao, W. H., Wu, C. C. and Chen, Y. P.: Solid-liquid equi-librium and heat capacity measurements of water plus sodium bromide and water plus sodium carbonate binary mixtures, J. Chin. Inst. Chem. Eng., 34, 599–603, 2003.
Tatarniuk, C., Donahue, R., and Sego, D.: Snow Characterization at a City Snow Storage Facility, J. Cold Regions Eng., 23, 136–142, 2009.
Thibert, E. and Domine, F.: Thermodynamics and kinetics of the solid solution of HCl in ice, J. Phys. Chem. B, 101, 3554–3565, 1997.
Wei, X., Miranda, P. B., and Shen, Y. R.: Surface vibrational spec-troscopic study of surface melting of ice, Phys. Rev. Lett., 86, 1554–1557, 2001.
Wren, S. N., Kahan, T. F., Jumaa, K. B., and Donaldson, D. J.: Spectroscopic studies of the heterogeneous reaction be-tween O3(g) and halides at the surface of frozen salt