www.nat-hazards-earth-syst-sci.net/13/1015/2013/ doi:10.5194/nhess-13-1015-2013
© Author(s) 2013. CC Attribution 3.0 License.
Natural Hazards
and Earth System
Sciences
Geoscientiic
Geoscientiic
Geoscientiic
Geoscientiic
Characteristics of rainfall triggering of debris flows in the
Chenyulan watershed, Taiwan
J. C. Chen1, C. D. Jan2, and W. S. Huang2
1Dept. of Environmental and Hazards-Resistant Design, Huafan University, New Taipei, Taiwan 2Dept. of Hydraulic and Ocean Engineering, National Cheng Kung University, Tainan, Taiwan
Correspondence to:J. C. Chen ([email protected])
Received: 12 June 2012 – Published in Nat. Hazards Earth Syst. Sci. Discuss.: – Revised: 4 February 2013 – Accepted: 21 March 2013 – Published: 19 April 2013
Abstract.This paper reports the variation in rainfall charac-teristics associated with debris flows in the Chenyulan water-shed, central Taiwan, between 1963 and 2009. The maximum hourly rainfallIm, the maximum 24 h rainfall Rd, and the rainfall indexRI(defined as the productRdIm) were analysed for each rainfall event that triggered a debris flow within the watershed. The corresponding number of debris flows initi-ated by each rainfall event (N) was also investigated via im-age analysis and/or field investigation. The relationship be-tweenN andRIwas analysed. HigherRIof a rainfall event would trigger a larger number of debris flows. This paper also discusses the effects of the Chi-Chi earthquake (CCE) on this relationship and on debris flow initiation. The results showed that the criticalRIfor debris flow initiation had sig-nificant variations and was sigsig-nificantly lower in the years immediately following the CCE of 1999, but appeared to re-vert to the pre-earthquake condition about five years later. Under the same extreme rainfall event ofRI=365 cm2h−1, the value ofNin the CCE-affected period could be six times larger than that in the non-CCE-affected periods.
1 Introduction
Over the last few decades, global-warming-induced climate change has manifested in a number of ways including ex-treme rainfall events (for example, Katz and Brown, 1992; Fauchereau et al., 2003; Fowler et al., 2005; Sillmann and Roeckner, 2008). As a consequence, higher frequencies and larger magnitudes of rainfall-induced landslides and/or de-bris flows have been reported worldwide (Eybergen and Ime-son, 1989; Rickenmann and Zimmermann, 1993; Evans and
Clague, 1994; Van Steijn, 1996; Jomelli et al., 2007; Pelfini and Santilli, 2008; Floris et al., 2010). This paper examines the variation in the characteristics of rainfall events triggering debris flows and the effects on the number of debris flows in the Chenyulan watershed, central Taiwan. Chen et al. (2012) found that the number of extreme rainfall events within the watershed showed an increasing trend, which was associated with the greater number and magnitude of debris flows dur-ing the last decade. Landslides and debris flows caused by severe rainfall events affect the volume of loose debris within a watershed, which may change the critical rainfall threshold for the initiation of debris flow in subsequent rainfall events. Therefore, understanding the variation in rainfall character-istics and its influence on debris flow initiation is important for debris flow warning and hazard mitigation.
1016 J. C. Chen et al.: Characteristics of rainfall triggering of debris flows
Table 1.Debris flow events and related rainfall characteristics in the Chenyulan watershed between 1963 and 2009 (Modified from Chen et al., 2012).
Year Date of the rainfall event
Name of rainfall event
Number of debris flows
N
Maximum hourly rainfall,
Im(mm h−1)
Maximum 24 h rainfall, Rd (mm)
Rainfall duration,T(h)
Rainfall index,
RI(cm2h−1)
1963 10–12 Sep Typhoon Gloria 1∗ 36.1 668.1 82.0 241.2
1985 23–25 Aug Typhoon Nelson 2∗ 47.2 418.8 50.0 197.7
1986 21–22 Aug Typhoon Wayne 2∗ 50.8 329.8 18.0 167.5
1992 30–31 Aug Typhoon Polly 1∗ 41.3 479.5 41.0 198.0
1996 31 July–1 Aug Typhoon Herb 37 71.6 1181.6 35.0 846.0
1998 7–8 June Rainstorm 3 28.1 227.8 40.0 64.0
1998 4–5 Aug Typhoon Otto 4 64.6 311.7 19.0 201.4
1998 15–16 Oct Typhoon Zeb 2 24.6 251.0 31.0 61.7
1999 27–28 May Rainstorm 2 24.3 254.3 32.0 61.8
2000 01 Apr Rainstorm 2 20.0 75.1 8.0 15.0
2000 25 Apr Rainstorm 1 8.4 30.6 9.0 2.6
2000 28–29 Apr Rainstorm 1 7.9 78.2 14.0 6.2
2000 2 May Rainstorm 1 8.1 30.6 5.0 2.5
2000 12–14 June Rainstorm 4 18.0 228.1 47.0 41.1
2000 18 July Rainstorm 3 12.7 30.0 3.0 3.8
2000 22 July Rainstorm 3 16.3 20.7 2.0 3.4
2000 5 Aug Rainstorm 4 11.6 38.8 10.0 4.5
2000 22–23 Aug Typhoon Bilis 2 20.6 234.5 24.0 48.3
2001 5 June Rainstorm 1 7.5 27.0 8.0 2.0
2001 14–15 June Rainstorm 3 18.4 200.1 24.0 36.8
2001 29–30 July Typhoon Toraji 78 78.5 587.6 18.0 461.3
2001 10 Aug Rainstorm 3 22.4 22.4 1.0 5.0
2001 17 Sep Typhoon Nari 4 35.7 252.5 23.0 90.1
2002 31 May Rainstorm 4 14.4 53.0 7.0 7.6
2002 3–4 July Rainstorm 2 13.3 117.9 19.0 15.7
2002 12 Aug Rainstorm 1 17.1 26.5 3.0 4.5
2004 2–3 July Typhoon Mindulle 17 54.0 681.4 38.0 368.0
2004 23–25 Aug Typhoon Aere 2 35.0 385.4 47.0 134.9
2005 4–5 Aug Typhoon Matsa 1 42.3 411.9 34.0 174.2
2005 31 Aug–1 Sep Rainstorm 1 44.3 495.0 27.0 219.3
2006 8–11 June Rainstorm 10 77.5 682.8 78.0 529.2
2006 13–15 July Typhoon Bilis 2 29.9 371.7 56.0 111.1
2007 17–20 Aug Typhoon Sepat 1 31.6 328.4 66.0 103.8
2007 6–7 Oct Typhoon Krosa 1 54.3 669.4 35.0 363.5
2008 17–18 July Typhoon Kalmaegi 3 67.2 515.7 18.0 346.6
2008 12–15 Sep Typhoon Sinlaku 2 35.0 612.4 66.0 214.3
2009 6–11 Aug Typhoon Morakot 41 85.5 1192.6 110.0 1019.7
Note:∗: Debris flow data obtained only from scientific papers/reports before 1996; no aerial photographs and
satellite images were available to identify debris flows in the whole watershed before Typhoon Herb.N=total number of individual debris flow triggered by each rainfall event in the Chenyulan watershed;Im= maximum hourly rainfall in each rainfall event;Rd=maximum 24 h rainfall amount in each rainfall event;RI=rainfall index,RI=RdIm.
Extreme rainfall causes numerous landslides and debris flows in mountainous watersheds, which generally deposit large amounts of loose debris in gullies and on slopes (Dong et al., 2009; Chen et al., 2012). The supply of loose debris plays an important role in the occurrence of future debris flows during subsequent rainfall events (Jakob et al., 2005). Both the critical rainfall threshold for debris flow initiation and the number of debris flows caused by a rainfall event may differ before and after an extreme rainfall event or a major earthquake. This study analysed the characteristics of rain-fall related to debris flow occurrence between 1963 and 2009 in the Chenyulan watershed, in order to investigate (1) the variation in the regional rainfall conditions related to debris flow occurrences, and (2) the empirical relationship between
rainfall characteristics and the corresponding number of de-bris flows.
2 Debris flow events and their corresponding rainfall
events
2.1 Debris flows in the Chenyulan watershed
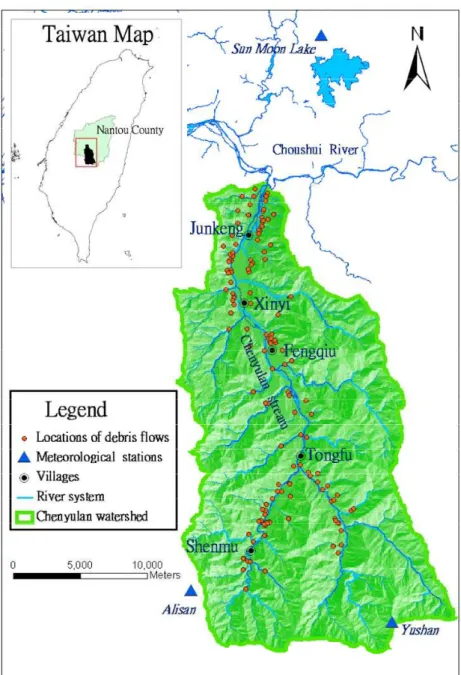
The watershed of Chenyulan stream, located in Nantou County, central Taiwan (Fig. 1), has an area of 449 km2, main stream length of 42 km, average stream-bed gradi-ent of 4◦
, and elevations ranging from 310 to 3952 m. The annual regional rainfall in the watershed is between 2000 and 5000 mm, with an average of approximately 3500 mm.
Fig. 1.Locations of debris flows and meteorological stations in the Chenyulan watershed (Modified from Chen et al., 2012).
Approximately 80 % of the annual rainfall occurs in the rainy season between May and October, especially during typhoons, which generally occur three or four times annu-ally. Owing to steep topography, loose soils, young (3 million years) and weak (due to ongoing orogenesis) geological for-mations, heavy rainfall and active earthquakes, many debris flows were triggered by more than 30 rainfall events between 1963 and 2009 in the watershed, as shown in Table 1. The most significant debris flow events were those caused by heavy rainfall brought by Typhoon Herb in 1996, Typhoon Toraji in 2001 and Typhoon Morakot in 2009. During the two day period from 31 July to 1 August 1996, Typhoon Herb brought an unexpectedly high cumulative rainfall of
1018 J. C. Chen et al.: Characteristics of rainfall triggering of debris flows
a maximum hourly rainfall of 123 mm and 48 h rainfall of 2361 mm (measured at Alishan rainfall station), and caused numerous debris flows that buried more than 20 houses, es-pecially in Shenmu, Tongfu and Xinyi villages (Chen et al., 2011).
2.2 Identification of debris flow events
Naturally occurring high-discharge flows of water and sed-iment in open channels vary over a wide and continuous spectrum of sediment concentration and particle-size distri-bution (Pierson, 2005). Water floods normally transport rel-atively small quantities of mostly fine sediment. At the other end of the spectrum, high-discharge debris flows may trans-port more sediment than water. The term “debris flood” or “mud flood” is often applied to flows intermediate between these two extremes (Pierson, 2005). For hazard management purposes, only a debris flow that occurs in a watershed with an area more than 3.0 ha and of main upstream slope more than 10◦
is officially recognised as a debris flow in Taiwan; otherwise, the flow would be treated as a sediment-laden flow, a debris flood or a mud flood. Therefore, the present study also adopts this classification when counting the num-ber of debris flows triggered during a rainfall event. Debris flow data prior to 1996 was obtained from the scientific lit-erature (such as Yu and Chen, 1987; Chiang and Lin, 1991; Chang et al., 2001). No aerial photographs and satellite im-ages were available to identify debris flows in the whole wa-tershed before 1996. After 1996, according to their specific features, debris flows were identified through interpretation of aerial photographs, satellite images or/and field investiga-tions. The identification of debris flows involved two basic stages. In the first stage, the possible locations of debris flow were identified from media reports (local newspapers, TV news), related documents and papers (Lin and Jeng, 2000; Cheng et al., 2005; Jan and Chen, 2005; Chen et al., 2009, 2012; Chen, 2011), and interpretation of images, such as aerial photographs and satellite images (SPOT images before 2004; FORMOSAT2 images after 2004) to assess whether the event was classified as a debris flow. The second stage was to conduct a field investigation to confirm whether the event identified in the first stage qualified as a debris flow.
Identifying debris flows, it was decided that each of the soil slip, flow path and deposits should be identifiable from the images – that is, the source, transportation, and deposi-tion zones should be identifiable from aerial photographs or satellite images. These features on aerial photographs were previously used by Liu et al. (2008) to identify debris flows. A debris flow is a rapid movement of debris materials along the flow path. Some important features of a debris flow in-clude traces of channelised stream flow, a large erosion ca-pacity (such as sharp bank erosion, fallen tree trunks), the transport of large boulders, the formation of levees, uneven and poorly sorted deposits, and scarring high on streamsides and deposits high in trees (Costa, 1984). These features
pro-vide epro-vidence of debris flow, and can be used to identify de-bris flow in field investigation. In this study, only gullies with obvious patterns of debris flow were identified as debris flow events.
Table 1 shows 37 rainfall events, including 18 rainstorms and 19 typhoon-induced heavy rainfall events, that triggered debris flows in the Chenyulan watershed during the study pe-riod; and the number of debris flow events (N) for each rain-fall event throughout the watershed. Table 1 shows that most rainfall events triggered four or fewer debris flows, but that some particularly severe events, such as those associated with heavy rainstorms in 2006, and with Typhoons Herb (1996), Toraji (2001), Mindulle (2004) and Morakot (2009), in-duced ten or more debris flows. The maximum number of de-bris flows was 78, which were triggered by Typhoon Toraji, approximately two years after the Chi-Chi earthquake; Ty-phoons Herb and Morakot triggered 37 and 41 debris flows, respectively, within the watershed.
2.3 Regional rainfall characteristics versus debris flows
To investigate the variation in rainfall characteristics in the Chenyulan watershed, long-term rainfall records were ob-tained from three meteorological stations (Sun Moon Lake, Yushan and Alisan stations, as shown in Fig. 1). These data were used to estimate the regional rainfall characteristics for the whole Chenyulan watershed, via the reciprocal-distance-squared (RDS) method (Chow et al., 1988). The estimated point using this method was taken at the centroid of the watershed area. The rainfall characteristics estimated by the RDS method may not actually reflect the rainfall character-istics at specific locations when local rainfall varied signifi-cantly owing to abrupt changes in elevation, but it is a sim-ple method to directly compute the regional average rainfall characteristics for a watershed. Moreover, the regional aver-age rainfall estimated using the RDS method can easily rep-resent the variation trend for regional rainfall characteristics throughout the Chenyulan watershed (Chen et al., 2012). The present paper calculated regional hourly rainfall, cumulative rainfall and rainfall duration, etc., of each rainfall event as-sociated with debris flow occurrence, in order to study the relationship between rainfall characteristics and debris flow occurrence.
Parameters such as peak hourly rainfall, daily rainfall, maximum daily rainfall, cumulative rainfall, average rain-fall intensity and rainrain-fall duration have been used by pre-vious researchers to investigate the occurrence of debris flows. The choice of rainfall parameters reflects different re-search objectives. For example, the empirical relationship between average rainfall intensity and rainfall duration was used to assess the potential for debris flow occurrence in a rainfall event (Caine, 1980; Keefer et al., 1987; Chen, 2011). Rainfall data on a daily scale, such as maximum 24 h rainfall, daily rainfall, or 3 day rainfall, have been used to analyse the influence of rainfall change on debris flow
J. C. Chen et al.: Characteristics of rainfall triggering of debris flows 1019
1960 1965 1970 1975 1980 1985 1990 1995 2000 2005 2010 Year 0 200 400 600 800 1000 1200 1400 Rd (m m/ h ) TH TT HR TM EQ TMi : Rainfall events triggering 10 or more debris flows
TH : Typhoon Herb (July 31Aug 01, 1996) CCE : Chi-Chi earthquake (Sep 21, 1999) TT : Typhoon Toraji (July 2930, 2001) TMi: Typhoon Mindulle (July 0203, 2004) HR : Heavy rainstorm (June 0811, 2006) TM : Typhoon Morakot ( Aug 0611, 2009)
: Rainfall events triggering 9 or less debris flows
Critical rainfall condition (Rd = 580 mm/h) for triggering 10 or more debris flows in a rainfall event
(a)
R
dindex
d
1960 1965 1970 1975 1980 1985 1990 1995 2000 2005 2010
Year 0 20 40 60 80 100 Im (mm/ h ) TH TT HR TM EQ TMi : Rainfall events triggering 10 or more debris flows
TH : Typhoon Herb (July 31Aug 01, 1996) CCE : Chi-Chi earthquake (Sep 21, 1999) TT : Typhoon Toraji (July 2930, 2001) TMi: Typhoon Mindulle (July 0203, 2004) HR : Heavy rainstorm (June 0811, 2006) TM : Typhoon Morakot ( Aug 0611, 2009)
: Rainfall events triggering 9 or less debris flows
Critical rainfall condition (Im = 54 mm/h)
for triggering 10 or more debris flows in a rainfall event
(b)
I
mindex
RI
(b)
I
mindex
1960 1965 1970 1975 1980 1985 1990 1995 2000 2005 2010 Year 0 200 400 600 800 1000 1200 RI (c m 2/h )
: Rainfall events triggering 10 or more debris flows
Critical rainfall condition (RI = 365 cm2/h)
for triggering 10 or more debris flows in a rainfall event TH : Typhoon Herb (July 31Aug 01, 1996)
CCE : Chi-Chi earthquake (Sep 21, 1999) TT : Typhoon Toraji (July 2930, 2001) TMi: Typhoon Mindulle (July 0203, 2004) HR : Heavy rainstorm (June 0811, 2006) TM : Typhoon Morakot ( Aug 0611, 2009)
TH TT HR TM CCE TMi : Rainfall events triggering 9 or less debris flows
(c)
RI
index
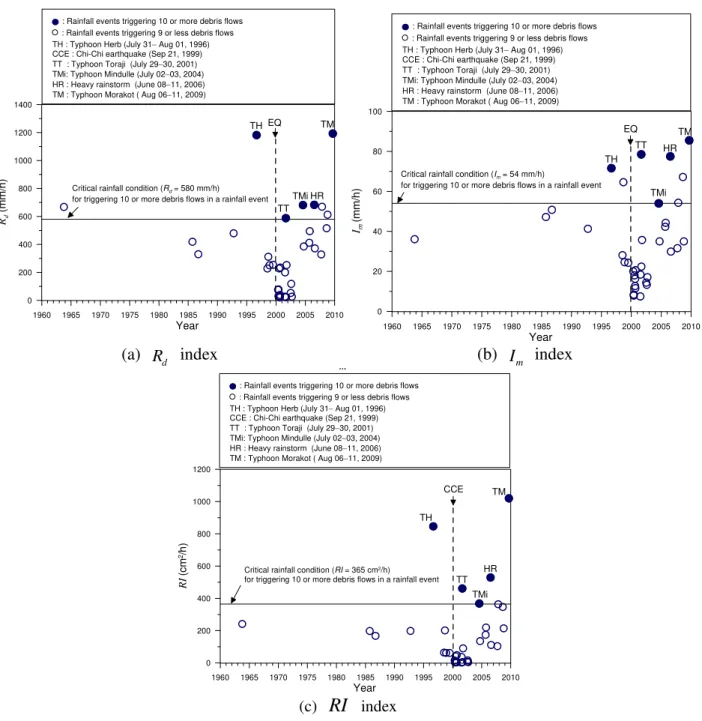
riations in three rainfall parameters contributing to debris flows between 1963
Fig. 2.Variations in three rainfall parameters contributing to debris flows between 1963 and 2009 in the Chenyulan watershed. The Chi-Chi earthquake significantly lowered the rainfall threshold for debris flow occurrence, during approximately the subsequent 5 yr.
activity (Rebetez et al., 1997; Zhuang et al., 2011; Chen et al., 2012). Extreme rainfall refers to events of relatively high rainfall intensity and/or high cumulative rainfall. De-bris flows caused by a rainfall event generally occurred within the period of the maximum 24 h rainfall, and were closely related to the maximum hourly rainfallIm(Lin and Jeng, 2000; Chen et al., 2011, 2012). The corresponding Im and Rd for debris flow events in the Chenyulan water-shed between 1963 and 2009 (see Table 1) shows that Ty-phoons Herb (1996), Toraji (2001), Mindulle (2004), heavy
rainstorm in 2006, and Typhoon Morakot (2009), all had the extreme characteristics, of Rd>580 mm (this thresh-old was used by Chen et al. (2012) to analyse the vari-ation of extreme rainfall events in the Chenyulan water-shed) and Im>54 mm h−1, especially Typhoon Morakot, withRd=1192.6 mm andIm=85.5 mm h−1. Each of these five extreme rainfall events caused 10 or more debris flows. However, as shown in Table 1 and Fig. 2a and b, only five of the eightRd>580 mm orIm>54 mm h−1extreme rain-fall events caused 10 or more debris flows. Therefore, it is
1020 J. C. Chen et al.: Characteristics of rainfall triggering of debris flows
inappropriate to apply a single rainfall parameter such asRd orImas a critical condition for the occurrence of multiple debris flows. The occurrence of debris flow is related to not only accumulated rainfall, but also rainfall intensity. A trig-gering indexRIof a rainfall event, defined as the product of RdandIm(i.e.,RI=RdIm), could be used as a critical condi-tion for the occurrence of multiple debris flows. As shown in Fig. 2c, forRI>365 cm2h−1, all five of the extreme rainfall events caused multiple debris flows, withN≥10. The rain-fall data used in this study is limited to hourly rainrain-fall data because the minute-scale rainfall data, such as 5 or 10 min rainfall data was not available. Other rainfall indices, such as total storm rainfall, or rainfall duration, have less correlation with the number of debris flow events when compared to the
RIindex.
3 Influence of rainfall variation on debris flows occurrence
Figures 2a–c show parameters for rainfall events that initi-ated debris flows between 1936 and 2009. There are eight rainfall events with maximum 24 h rainfallRd greater than 580 mm, of which seven occurred after 1996; rainfall events with maximum hourly rainfallImgreater than 54 mm or rain-fall indexRIlarger than 365 cm2h−1all occurred after 1996. This implies that rainfall events became more severe after 1996.
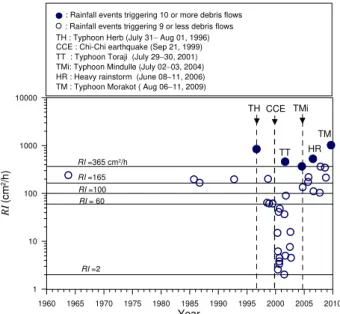
As shown in Fig. 3, the criticalRIs for debris flow occur-rence were approximately 165 cm2/h before Typhoon Herb (TH) in 1996; 60 cm2h−1between TH and the Chi-Chi earth-quake (CCE) in 1999; 2 cm2h−1between CCE and Typhoon Mindulle (TMi) in 2004; and 100 cm2h−1between TMi and Typhoon Morakot (TM) in 2009.
Between 1963 and 1996, the most severe rainfall event was TH, and the condition for debris flow occurrence was
RI>165 cm2h−1. TH brought severe rainfall and caused nu-merous landslides and debris flows in the Chenyulan water-shed. Subsequently, abundant loose debris deposits remained on slopes or in gullies to serve as source material for later rainfall-induced debris flows. Since this loose sediment was generally of lower soil strength, less rainfall (with RI ap-proximately equal or greater than 60 cm2h−1) was needed to trigger debris flows in subsequent years, between TH and CCE.
The CCE in 1999 was the largest earthquake in Taiwan for a century, and caused numerous landslides in the Chenyu-lan watershed. Since a large amount of loose sediment with lower soil strength was deposited on streambeds or hillsides after the earthquake, much lower pore water pressure or rainfall was required to initiate the movement of this sed-iment (Lin et al., 2003; Chen et al., 2007; Chen and Jan, 2008). Therefore, the criticalRI for debris flow occurrence dropped sharply in the subsequent early years, to 2 cm2h−1. That is to say that the critical RI (2 cm2h−1) for debris
1960 1965 1970 1975 1980 1985 1990 1995 2000 2005 2010
Year
1 10 100 1000 10000
RI
(c
m
2/h
)
: Rainfall events triggering 10 or more debris flows
RI =165
RI =365 cm2/h
TH : Typhoon Herb (July 31Aug 01, 1996) CCE : Chi-Chi earthquake (Sep 21, 1999) TT : Typhoon Toraji (July 2930, 2001) TMi: Typhoon Mindulle (July 0203, 2004) HR : Heavy rainstorm (June 0811, 2006) TM : Typhoon Morakot ( Aug 0611, 2009)
TH
TT HR TM CCE TMi
RI = 60
: Rainfall events triggering 9 or less debris flows
RI =2
RI =100
Figure 3: The variations in rainfall index RI for all rainfall events triggering deb
RI Fig. 3.The variations in rainfall indexRIfor all rainfall events trig-gering debris flows between 1963 and 2009 in the Chenyulan wa-tershed. The criticalRIfor debris flow occurrence in the years fol-lowing the Chi-Chi earthquake is much smaller than those before the earthquake and five years after the earthquake.
flow occurrence in the period between CCE and TMi was only one-thirtieth of that (60 cm2h−1) before the CCE (be-tween TH and CCE). After about 5 years, the loose sedi-ment generally became consolidated and re-orientated over time, less soil and rock remained deposited in streams, and the shear strength of the soil gradually increased (Fan et al., 2003; Chen, 2011). The criticalRI gradually recovered from 2 cm2h−1 to 100 cm2h−1. The variation of critical
RI is related to debris supply within the watershed. Dong et al. (2009) developed a susceptibility index (SI) that ac-counted for debris supply to estimate the susceptibility to debris flow. They reported that the SI increased following the CCE and after TT (before the occurrence of debris flow), because the volume of debris contributed by shallow land-slides increased; and thatSI decreased when the volume of debris was reduced by debris outflow during TT and TMi. A higher SI may lead to a smaller critical RI; conversely, a lowerSI may require a larger criticalRIto trigger debris flow. These results confirm that theRIfor debris flow occur-rence decreased in the early periods after the CCE and that theRIshowed an increasing tendency between TT and TMi, as shown in Fig. 3. Our results are consistent with those ob-tained by Dong et al. (2009). Both severe rainfall and earth-quakes would change the condition ofRI, in terms of both the magnitude and number of debris flow events. The data for the Chenyulan watershed suggest that the Chi-Chi earthquake was the most significant influence on the rainfall threshold for debris flow occurrence.
1 10 100 1000
RI (cm2/h)
1 10 100
N
: Before TH : Between TH and CCE : Between CCE and TMi : Between TMi and TM
TH TT
TM
HR TMi TH : Typhoon Herb (July 31Aug 01, 1996)
CCE : Chi-Chi earthquake (Sep 21, 1999) TT : Typhoon Toraji (July 2930, 2001) TMi: Typhoon Mindulle (July 0203, 2004) HR : Heavy rainstorm (June 0811, 2006) TM : Typhoon Morakot ( Aug 0611, 2009)
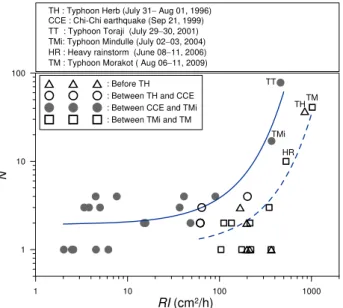
Figure 4: Relationships between the number of debris flows Nin a rainfall even
RI
Fig. 4.Relationships between the number of debris flows N in a rainfall event and corresponding rainfall indexRIfor two groups. The first group refers to the period significantly affected by the Chi-Chi earthquake (2000–2004; solid line), while the second group rep-resents the periods not significantly affected by the Chi-Chi earth-quake (dashed line).
4 Relationship between rainfall characteristics and the
number of debris flows
We allocated the debris flows to two groups: one represent-ing the period between CCE and TMi (2000–2004), in which the rainfall condition required for debris flow occurrence is significantly affected by CCE (shown in Fig. 4 as solid cir-cles); the other representing the periods that were unaffected by the CCE, i.e., before TH, between TH and CCE, and be-tween TMi and TM (shown in Fig. 4 as open triangles, cir-cles and rectangles, respectively). Comparison within the pe-riods without CCE effect shows that theRIs between TH and CCE (open circles in Fig. 4) are smaller, and the correspond-ing number of debris flowsNis slightly greater compared to other periods (before TH, and between TMi and TM). This result may be attributed to abundant loose debris remaining on slopes or in gullies in the early periods after TH; these deposits were more susceptible to the effects of rainfall, and served as source material for subsequent debris flows. The relationships for the number of debris flows (N) associated with a rainfall event of rainfall index (RI) in the two groups are shown in Fig. 4, and represented by Eqs. (1) and (2).
log(N )=0.290+0.003(RI−2) (1)
for the period between 2000 and 2004
log(N )=0.121+0.0015(RI−60)for other periods (2) Here, the coefficients of determination for Eqs. (1) and (2) arer2=0.78 and 0.75, respectively. Equations (1) and
(2) show that the number of debris flow events increases with the increase of rainfall index. N is larger during the period affected by CCE than the periods unaffected by CCE. According to Eqs. (1) and (2), for a rainfall event of RI=60 cm2h−1, the number N of debris flows in the CCE-affected period could potentially be double that of the non-CCE periods. However, for an extreme rainfall event of
RI =365 cm2h−1, the value ofNin the CCE-affected period could be about six times larger than in the non-CCE periods.
5 Conclusions
Debris flows and their corresponding rainfall events were studied in the Chenyulan watershed, central Taiwan, between 1963 and 2009. A rainfall indexRI, defined as the product of the maximum 24 h rainfallRdand the maximum hourly rain-fallIm (i.e.,RI=RdIm), was used to analyse rainfall condi-tions critical for debris flow occurrence. Since the occurrence of debris flow depends not only on the accumulated rainfall, but also on the rainfall intensity, the triggering indexRI of a rainfall event is introduced herein to indicate either high accumulated rainfall or high rainfall intensity could trigger debris flows. The results show that there were five extreme rainfall events with RI>365 cm2h−1 during the study pe-riod (1963–2009), each of which caused 10 or more debris flows in the watershed. These five extreme rainfall events were associated with Typhoon Herb (TH) in 1996, Typhoon Toraji (TT) in 2001, Typhoon Mindulle (TMi) in 2004, heavy rainstorm (HR) in 2006 and Typhoon Morakot (TM) in 2009. The Chi-Chi earthquake (CCE) occurred in 1999, and caused severe landslides in the Chenyulan watershed. The ex-treme rainfall events and the severe earthquake were shown to affect the critical condition for the occurrence of debris flows. The critical RIs for occurrence of debris flows be-tween 1963 and 2009 could be classified into four categories: the periods before TH, between TH and CCE, between CCE and TMi, and between TMi and TM; and had criticalRIs of approximately 165, 60, 2 and 100 cm2h−1, respectively. It is shown that: (1) TH caused numerous landslides and de-bris flows in the watershed, which reduced the critical rain-fall threshold for debris flow in subsequent years; (2) CCE significantly lowered the critical rainfall threshold for debris flow occurrence in the subsequent five years – after CCE, the criticalRIdropped sharply to approximately 2 cm2h−1, which was one-thirtieth of that before the CCE (criticalRI= 60 cm2h−1). The results also show that, approximately five years after the CCE, the criticalRIgradually recovered from 2 cm2h−1to 100 cm2h−1(the criticalRI between TMi and TM).
1022 J. C. Chen et al.: Characteristics of rainfall triggering of debris flows
rainfall event would trigger a larger number of debris flows. According to the empirical relationships, for a rainfall event ofRI=60 cm2h−1, the potential numberN of debris flows in the CCE-affected period could be double that in the non-CCE-affected periods. However, for an extreme rainfall event of RI= 365 cm2h−1, the value of N in the CCE-affected period could be six times larger than that in the non-CCE-affected periods.
Acknowledgements. The second author received financial support
from the National Science Council, Taiwan (NSC101-2625-M-006-001). The authors also appreciate the handling editor O. Katz, the reviewers M. Winter, P. Santi, and M. Bertrand, and one anonymous reviewer for their critical reviews and constructive comments.
Edited by: O. Katz
Reviewed by: M. Bertrand, M. G. Winter, P. Santi, and one anonymous referee
References
Caine, N.: The rainfall intensity-duration control of shallow land-slides and debris flows, Geografiska annaler, 62A (1/2), 23–27, 1980.
Chang, J. C., Shen, S. M., and Liu, Y. S.: A study on the occurrence of landslides and debris flows in four small catchments of the Chenyulan river, Geog. Res., 34, 63–83, 2001 (in Chinese). Chen, J. C.: Variability of impact of earthquake on debris flow
trig-gering conditions: case study of Chen-Yu-Lan Watershed, Tai-wan, Environ. Earth Sci., 64, 1787–1794, 2011.
Chen, J. C. and Jan, C. D.: Probabilistic analysis of landslide poten-tial of an inclined uniform soil layer of infinite length – applica-tion, Environ. Geol., 54, 1175–1183, 2008.
Chen, J. C., Jan, C. D., and Lee, M. S.: Probabilistic analysis of landslide potential of an inclined uniform soil layer of infinite length–theorem, Environ Geol., 51, 1239–1248, 2007.
Chen, J. C., Lin, C. W., and Wang, L. C.: Geomorphic characteris-tics of hillslope and channelized debris flows – A case study in the Shitou area of central Taiwan, J. Mt. Sci., 6, 266–273, 2009. Chen, J. C., Huang, W. S., Jan, C. D., and Tsai, Y. F.: Rainfall con-ditions for the initiation of debris flows during Typhoon Morakot in the Chen-Yu-Lan watershed in central Taiwan, in: Proceedings of the 5th International Conference on Debris flow Hazards Mit-igation, Padua, Italy, edited by: Genevois, R., Hamilton, D. L., and Prestininzi, A., 31–36, 2011.
Chen, J. C., Huang, W. S., Jan, C. D., and Yang, Y. H.: Recent changes in the number of rainfall events related to debris-flow occurrence in the Chenyulan Stream Watershed, Taiwan, Nat. Hazards Earth Syst. Sci., 12, 1539–1549, doi:10.5194/nhess-12-1539-2012, 2012.
Cheng, J. D., Huang, Y. C., Wu, H. L., Yeh, J. L., and Chang, C. H.: Hydrometeorological and land use attributes of debris flows and debris floods during Typhoon Toraji, July 29–30, 2001 in Central Taiwan, J. Hydrol., 306, 161–173, 2005.
Chiang, Y. C. and Lin, C. Y.: An analysis of rainfall characteristics for debris flow events in Taiwan, J. Chin. Soil Water Conserv., 22), 21–37, 1991 (in Chinese).
Chow, V. T., Maidment, D. R., and Mays, L. W.: Applied hydrology, McGraw-Hill Inc., Singapore, 1988.
Costa, J. E.: Physical geomorphology of debris flows: in Costa, J. E., and Fleisher, P. J., eds., Developments and Applications of Geomorphology, Berlin, Springer-Verlag, 268–317, 1984. Dong, J. J., Lee, C. T., Tung, Y. H., Liu, C. N., Lin, K. P., and Lee, J.
F.: The role of the sediment budget in understanding debris flow susceptibility, Earth Surf. Process. Landf., 34, 1612–1624, 2009. Evans, S. G. and Clague, J. J.: Recent climatic change and catas-trophic geomorphic processes in mountain environments, Geo-morphology, 10, 107–128, 1994.
Eybergen, F. A. and Imeson, A. C.: Geomorphic processes and cli-matic change, Catena, 16, 307–319, 1989.
Fan, J. C., Liu, J. S., and Wu, M. F.: Determination of critical rainfall thresholds for debris -flow occurrence in central Taiwan and their revision after the 1999 Chi-Chi earthquake, in: Proceedings of the 3rd International Conference on Debris flow Hazards Mitiga-tion, Davos, Switzerland, edited by: Rickenmann, D. and Chen, C. L., Rotterdam: Millpress, 103–114, 2003.
Fauchereau, N., Trzaska, S., Rouault, M., and Richard, Y.: Rainfall variability and changes in Southern Africa during the 20th cen-tury in the global warming context, Nat. Hazards, 29, 139–154, 2003.
Fowler, H. J., Ekstr¨om, M., Kilsby, C. G., and Jones, P. D.: New estimates of future changes in extreme rainfall across the UK us-ing regional climate model integrations, 1. Assessment of control climate, J. Hydrol., 300, 212–233, 2005.
Floris, M., D’Alpaos, A., Squarzoni, C., Genevois, R., and Marani, M.: Recent changes in rainfall characteristics and their influence on thresholds for debris flow triggering in the Dolomitic area of Cortina d’Ampezzo, north-eastern Italian Alps, Nat. Hazards Earth Syst. Sci., 10, 571–580, doi:10.5194/nhess-10-571-2010, 2010.
Jakob, M., Bovis, M., and Oden, M: The significance of chan-nel recharge rates for estimating debris flow magnitude and fre-quency, Earth Surf. Process. Landf., 30, 755–766, 2005. Jan, C. D. and Chen, C. L.: Debris flow caused by Typhoon Herb in
Taiwan, in: Debris flow hazards and related phenomena, edited by: Jakob, M. and Hungr, O., Praxis, UK, 539–563, 2005. Jomelli, V., Brunstein, D., Grancher, D., and Pech, P.: Is the
re-sponse of hill slope debris flows to recent climate change uni-vocal? A case study in the Massif des Ecrins (French Alps), Cli-matic Change, 85, 119–137, 2007.
Katz, R. W. and Brown, B. G.: Extreme events in a changing climate: variability is more important than averages, Climate Change, 21, 289–302, 1992.
Keefer, D. K., Wilson, R. C., Mark, R. K., Brabb, E. E., Brown, W. M., Ellen, S. D., Harp, E. L., and Wieczorek, C. F.: Real-time landslide warning during heavy rainfall, Science, 238, 921–925, 1987.
Lin, M. L. and Jeng, F. S.: Characteristics of hazards induced by extremely heavy rainfall in central Taiwan–Typhoon Herb, Eng. Geol., 58, 191–207, 2000.
Lin, C. W., Shieh, C. L., Yuan, B. D., Shieh, Y. C., Liu, S. H., and Lee, S. Y.: Impact of Chi-Chi earthquake on the occurrence of landslides and debris flows: Example from the Chenyulan River
watershed, Nantou, Taiwan, Eng. Geol., 71, 49–61, 2003. Liu, C. N., Huang, H. F., and Dong, J. J.: Impacts of September
21, 1999 Chi-Chi earthquake on the characteristics of gully-type debris flows in central Taiwan, Nat. Hazards, 47, 349–368, 2008. Liu, C. N., Dong, J. J., Peng, Y. F., and Huang, H. F.: Effects of strong ground motion on the susceptibility of gully type debris flows, Eng. Geol., 104, 241–253, 2009.
Pelfini, M. and Santilli, M.: Frequency of debris flows and their re-lation with precipitation: A case study in the Central Alps, Italy, Geomorphology, 101, 721–730, 2008.
Pierson, T. C.: Hyperconcentrated flow – transitional process be-tween water flow and debris flow, in: Debris flow hazards and related phenomena, edited by: Jakob, M. and Hungr, O., Praxis, UK, 159–202, 2005.
Rickenmann, D. and Zimmermann, M.: The 1987 debris flow in Switzerland: documentation and analysis, Geomorphology, 8, 175–189, 1993.
Rebetez, M., Lugon, R., and Baeriswyl, P. A.: Climatic change and debris flows in high mountain regions: the case study of the Rit-igraben Torrent (Swiss Alps), Climatic Change, 36, 371–389, 1997.
Shin, T. C. and Teng, T. L.: An overview of the 1999 Chi-Chi, Tai-wan earthquake, Bull. Seism. Soc. Am., 91, 895–913, 2001. Sillmann, J. and Roeckner, E.: Indices for extreme events in
pro-jections of anthropogenic climate change, Climatic Change, 86, 83–104, 2008.
Van Steijn, H.: Debris flow magnitude-frequency relationships for mountainous regions of central and Northwest Europe, Geomor-phology, 15, 259–273, 1996.
Yu, F. C. and Chen, C. K.: A study on the debris flow disasters at Feng-Chiou, J. Chin. Soil Water Conserv., 18, 1, 76–92, 1987 (in Chinese).