www.hydrol-earth-syst-sci.net/12/1039/2008/ © Author(s) 2008. This work is distributed under the Creative Commons Attribution 3.0 License.
Earth System
Sciences
The benefit of high-resolution operational weather forecasts for flash
flood warning
J. Younis1, S. Anquetin2, and J. Thielen1
1Institute for Environment and Sustainability, European Commission DG Joint Research Centre, Ispra, Italy
2Laboratoire d’Etude des Transferts en Hydrologie et Environnement, Grenoble Universit´e (CNRS, UJF, IRD, INPG), France Received: 3 January 2008 – Published in Hydrol. Earth Syst. Sci. Discuss.: 12 February 2008
Revised: 20 June 2008 – Accepted: 22 June 2008 – Published: 30 July 2008
Abstract. In Mediterranean Europe, flash flooding is one of the most devastating hazards in terms of loss of human life and infrastructures. Over the last two decades, flash floods have caused damage costing a billion Euros in France alone. One of the problems of flash floods is that warning times are very short, leaving typically only a few hours for civil protection services to act. This study investigates if oper-ationally available short-range numerical weather forecasts together with a rainfall-runoff model can be used for early indication of the occurrence of flash floods.
One of the challenges in flash flood forecasting is that the watersheds are typically small, and good observational net-works of both rainfall and discharge are rare. Therefore, hy-drological models are difficult to calibrate and the simulated river discharges cannot always be compared with ground measurements. The lack of observations in most flash flood prone basins, therefore, necessitates the development of a method where the excess of the simulated discharge above a critical threshold can provide the forecaster with an indica-tion of potential flood hazard in the area, with lead times of the order of weather forecasts.
This study is focused on the C´evennes-Vivarais region in the Southeast of the Massif Central in France, a region known for devastating flash floods. This paper describes the main aspects of using numerical weather forecasting for flash flood forecasting, together with a threshold – exceedance. As a case study the severe flash flood event which took place on 8–9 September 2002 has been chosen.
Short-range weather forecasts, from the Lokalmodell of the German national weather service, are used as input for the LISFLOOD model, a hybrid between a conceptual and
Correspondence to:J. Thielen ([email protected])
physically based rainfall-runoff model. Results of the study indicate that high resolution operational weather forecasting combined with a rainfall-runoff model could be useful to de-termine flash floods more than 24 h in advance.
1 Introduction
Flash floods are rapidly developing floods with devastating effects for the environment and high risk of loss of life. In Mediterranean Europe, flash flooding is classified as one of the most devastating hazards in terms of human life loss and infrastructures (Gruntfest and Handmer, 1999). Over the last two decades, flash floods caused a billion Euros of damage in France alone (Hauet et al., 2003, in French). Apart from the economic impact, flash floods are life threatening: 11 vic-tims were reported in the Nˆımes event (1988), 58 during the Vaison la Romaine flash flood (1992) (S´en´esi et al., 1996), 35 for the Aude storms (1999) (Ducrocq et al., 2003) and 24 for the 2002 Gard event (Delrieu et al., 2005; Hauet et al., 2003) which is presented here. Vulnerability to flash floods will probably increase in the coming decades due to evolving land use and the modification of the pluviometric regime as-sociated with the evolution of the climate (Parry et al., 2007; Palmer and Raisanen, 2002; Rosso and Rulli, 2002).
can be produced by storms of even shorter duration with ac-cumulations of over 50 mm in less than one hour (Creutin and Borga, 2003; Collier, 2007). The rising rate of waters of several m.h−1, and the flow velocity of several m.s−1, make these floods far more dangerous for human lives than large river floods (excluding dam breaks). Furthermore, the dan-ger also comes from the rarity of the phenomenon, which de-mands a new observation strategy, as well as new forecasting methodology.
The meteorological conditions leading to flash floods are mostly severe convective systems that typically develop un-der potentially unstable conditions released by very localized trigger mechanisms. Due to their very localized nature, the observation of these events with a gauging network is prob-lematic. Weather radars can provide better spatial rainfall es-timations. However, it has been demonstrated that the more intense the rainfall, the less reliable the rainfall estimates from radar become (Austin, 1987; BASC, 2005; Borga et al., 2002; Ciach et al, 2000). Therefore accurate monitoring and prediction of severe storm rainfall intensities continue to be a major challenge. Prediction of these events with numerical meteorological models is even more difficult (Fritsch et al., 1998; Anquetin et al., 2005; Chancibault et al., 2006; Yates et al., 2007) due to the strong interaction of different physical and micro-physical processes across different scales.
One accepted method for predicting flash floods in un-gauged river basins is so called “flash flood guidance” (Geor-gakakos, 2006). Flash flood guidance is a general term refer-ring to the average rain needed over an area and durefer-ring a spe-cific time in order to initiate rapid flooding in small streams. Depending on the method, in addition the antecedent soil moisture or precipitation from previous days is taken into ac-count.
However, there is no unique and simple theory about the runoff production on watersheds during flash flood events. The main reason is that a variety of processes can be involved which are usually grouped in two types of overland flow: sat-uration excess (Dunne process) or infiltration excess (Hor-ton runoff). Due to the high heterogeneity and space vari-ability of the watershed characteristics (land use, soil type and depth, sub-soil, local slope, upstream contributing area) and to antecedent moisture conditioning, these processes are likely to be active at the same time in various combinations (Smith and Goodrich, 2005).
Therefore, in order to forecast flash floods reliably, the temporal and spatial resolutions of the meteorological and hydrological model should ideally be linked also at small scales. Recognition of the need to couple meteorological and hydrological processes in interpretative studies and in the development of predictive models for flash floods has been demonstrated (Anquetin et al., 2004).
In this study a regional approach for flash flood warning also in ungauged river basins is being proposed. The concept is based on the principle of discharge threshold exceedances as opposed to a rainfall exceedance (Georgakakos, 2006).
A discharge threshold exceedance approach is currently be-ing explored for river flood forecastbe-ing (Thielen et al., 2008; Ramos et al., 2007), but has also been recently applied for flash floods, for instance by Reed et al. (2007).
In this, the first feasibility study, a deterministic approach has been used. For future studies it is envisaged to test the approach within a probabilistic framework and use high res-olution ensembles from limited area models. Similar studies in this direction have shown positive results (Chen and Yu, 2007).
In Sect. 2 of this paper, the September 2002 case study is described, and the main characteristics of the study area are presented. The hydrological model and the threshold con-cepts are explained in Sect. 3. In Sect. 4, results are illus-trated for (a) the long-term simulations used for the thresh-old calculation, (b) the forecasting performance for the case study, and (c) a 6-month control forecasting run. Conclusions and the proposed way forward are illustrated in the final Sec-tion.
2 The flash flood event of 8–9 September 2002
2.1 The C´evennes – Vivarais region in Southern France The C´evennes-Vivarais region (Fig. 1) is situated Southeast of the Massif Central, the V-shaped Hercynian mountain range of the central part of France, and covers 85 000 km2; i.e. one sixth of the country’s total area. The aspect is southeasterly, sloping from the Mediterranean shore and the Rhˆone Valley. Elevation varies from sea level up to 1700 m (Mount Loz`ere) over roughly 70 km. The area is character-ized by relatively small catchments (few hundreds of km2)
with a short response time of less than 12 h. The main C´evennes Rivers are the Vidourle, Ard`eche, C`eze, and Gard. They are characterized by a typical Mediterranean hydrologi-cal regime with very low level of water in summer and floods occurring mainly during the autumn.
Fig. 1. Map of the topography of France and zoom into the study area of the C´evennes region with the catchments used for this study. Rainfall gauges from high density network (hourly data, blue flags), stream gauging stations (red dots), and synoptic meteorological stations (daily data, red circles). The location of the Boll`ene radar is also indicated in the map.
The event started early in the morning of 8 September 2002, with first convective cells forming over the Mediter-ranean Sea. The convection progressed northward to form, inland, a mesoscale convective system over the Gard. The quasi-stationary system remained over the region until the following morning, and then evolved eastward together with a surface front. For more detail on the event, refer to Del-rieu et al. (2005). For the whole event, the raingauge net-work locally recorded 24 h of accumulated rainfall greater than 600 mm (Fig. 2a), which is also estimated by the radar observation (Fig. 2b).
For the Gard and Vidourle river watersheds, the peak dis-charges were observed to be two times higher than the ten years return period specific discharge (Delrieu et al., 2005; Chancibault et al., 2006). In Fig. 3, the maximum specific discharge recorded or retrieved from a post-event field exper-iment (Delrieu et al., 2005) illustrates the intensity of the hy-drological response of the watershed within the region. Most of the estimated peaks indicate specific discharges of more than 5 m3s−1km−2, with some over 20 m3s−1km−2. These are the most important values ever reported for watersheds of similar areas in France (Delrieu et al., 2005). In this region, the 10 years return period discharge for such catchments is about 2 m3s−1km−2. Figure 3 also indicates the character-istic size of the watershed affected by the flood, for which detailed rainfall fields have to be correctly forecasted.
Fig. 2. Accumulated 48 h observed rainfall from 20020908 as ob-served by gauges(a)and by radar(b). The locations of the gauges used for the interpolation are as shown in Fig. 1 and the region also as delineated in Fig. 1.
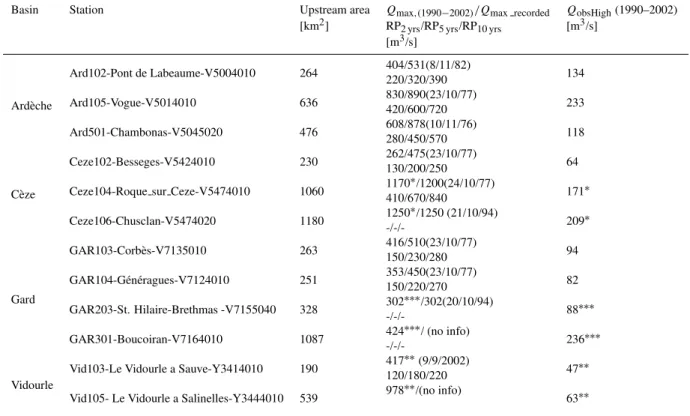
Table 1. List of river basins, discharge stations and their upstream areas used for this study. In addition the observed maximum daily discharge (Qmax)for the study period 19990-2002 is given, the recorded maximum discharge at this station (Qmax recorded)and at what date, the 2, 5 and 10 year observed return periods (RP2,5,10 yrs), and the high threshold calculated from the observed daily discharges.
Basin Station Upstream area Qmax,(1990−2002)/Qmax recorded QobsHigh(1990–2002)
[km2] RP2 yrs/RP5 yrs/RP10 yrs [m3/s] [m3/s]
Ard`eche
Ard102-Pont de Labeaume-V5004010 264 404/531(8/11/82) 134
220/320/390
Ard105-Vogue-V5014010 636 830/890(23/10/77) 233
420/600/720
Ard501-Chambonas-V5045020 476 608/878(10/11/76)280/450/570 118
C`eze
Ceze102-Besseges-V5424010 230 262/475(23/10/77) 64
130/200/250
Ceze104-Roque sur Ceze-V5474010 1060 1170
∗/1200(24/10/77)
171∗ 410/670/840
Ceze106-Chusclan-V5474020 1180 1250
∗/1250 (21/10/94)
209∗
-/-/-Gard
GAR103-Corb`es-V7135010 263 416/510(23/10/77)150/230/280 94
GAR104-G´en´eragues-V7124010 251 353/450(23/10/77) 82
150/220/270
GAR203-St. Hilaire-Brethmas -V7155040 328 302
∗∗∗/302(20/10/94)
88∗∗∗
-/-/-GAR301-Boucoiran-V7164010 1087 424
∗∗∗/ (no info)
236∗∗∗
-/-/-Vidourle
Vid103-Le Vidourle a Sauve-Y3414010 190 417
∗∗(9/9/2002)
47∗∗ 120/180/220
Vid105- Le Vidourle a Salinelles-Y3444010 539 978
∗∗/(no info)
63∗∗
∗Total gap in data records>3 years; ∗∗total gap in data records 3<years<6; ∗∗∗total gap in data records>6 years
Fig. 3. Observed maximum specific discharges for the flash flood event in September 2002 in the C´evennes-Vivarais region. The plot is based on the data collected in the post-event field experiment as described in Delrieu et al. (2005).
3 Hydrological model, input data and methodologies
3.1 The hydrological LISFLOOD model
The groundwater system is described using two parallel in-terconnected linear reservoirs, similar to the HBV-96 model (Lindstr¨om et al., 1997). The upper zone represents a mix of fast groundwater and subsurface flow, including flow through macropores. The lower zone has a much slower response and generates the base flow. Routing of water through the river channel is simulated with the kinematic wave (Chow et al., 1988). Whenever possible parameters in LISFLOOD are linked to physical properties, e.g. soil or land use properties. For five parameters, however, default values are proposed but need to be calibrated for better model performance (Feyen, 2005; van der Knijff and de Roo, 2006). Analysis of model parameter uncertainty and its impact on discharges simulated by the LISFLOOD model is presented in Feyen et al. (2007). The JRC stores all maps required to set up LISFLOOD at 5 km and 1 km resolutions. For this study the model has been set up at a regional scale, including all basins, with a 1 km grid, because 5 km would be too coarse. Time steps are adapted to the resolution of the available input variables. Daily time-steps are used for the long term simulations, and hourly time-steps for the detailed case study calculations. Since the aim of the study is to test the approach for un-gauged river basins, the available discharge data have been used for comparison and validation only, and not for calibra-tion. For calibration, the default values for the model (listed in van der Knijff and de Roo, 2006), have been applied to all basins and for both long-term and forecasting simulations. 3.2 Input data for the study
For the determination of the hydrological regime over the previous years, synoptic meteorological station data from the data archive of the AgriFish unit1at the DG Joint Research Centre have been used. This database holds reliable meteo-rological data from about 2000 stations across Europe since 1990. In the study area 11 meteorological stations are avail-able for which daily values of temperature and rainfall have been reported and potential evaporation estimated.
For the case study hourly meteorological and hydro-logical data are available from the databank of the Ob-servatoire Hydrom´et´eorologique M´editerran´een/C´evennes-Vivarais (OHM-CV)2, which was initiated in 2000 in order to study intense Mediterranean storms leading to devastating flash floods.
Rainfall data estimated from radar were derived from the Boll`ene 2002 experiment (Chapon, 2006; Boudevillain et al., 2006), designed by DSO/M´et´eo-France and LTHE3. This ex-periment aimed at evaluating the benefit of a radar volume-scanning strategy (8 elevation angles in 5 mn) for radar quan-titative precipitation estimation in C´evennes-Vivarais. The
1http://agrifish.jrc.it
2http://www.lthe.hmg.inpg.fr/OHM-CV/
3Laboratoire d’´etude des Transferts en Hydrologie et
Environ-nement
three Plan Position Indicators (PPIs) corresponding to the elevation angles needed for the operational products in real time of the Boll`ene radar (M´et´eo-France; Fig. 1) were com-plemented by two sets of five PPIs (elevation angle from 0.4◦
to 18◦), alternated every 5 mn. This protocol allowed a good
sampling of the atmosphere at a 10 mn sampling interval. The data available at 1×1 km2 resolution was the average reflectivity and the mean absolute reflectivity difference av-eraged over the individual radar polar bins. Innovative algo-rithms were developed in order to identify and correct var-ious errors sources in quantitative precipitation estimation in mountainous regions (i.e. radar calibration, ground clutter identification, vertical profile of reflectivity versus rainfall). Calibration based on rainfall observations has not been used. For more details on each step of the radar data processing see Boudevillain et al. (2006).
High-resolution operational weather forecasting data are provided to the JRC for research, by the German national weather service (DWD). In 2002 the Lokalmodell of the DWD had a grid spacing of 7 km, a forecasting lead time of 48 h, and the outputs are provided as hourly data. The DWD forecasts are provided every 12 h starting at 00:00 UTC and 12:00 UTC.
For the long-term simulations, discharge data from 15 stream gauging stations were selected from the Banque HY-DRO4, the French national database for discharge. At these stations discharge records are available from 1990 onwards. Few stations have complete records, while others have gaps up to 6 years (Table 1). Only those stations were selected where the influence of hydrological structures such as reser-voirs, can be assumed to be small. In addition, for 12 out of these 15 stations, also hourly data are available from the OHM-CV for the 2002 event.
3.3 Methodology of discharge threshold exceedances In order to issue a flood warning a decision-making element needs to be incorporated: is the discharge going to exceed a critical threshold or not? The determination of the criti-cal thresholds is crucial, in particular when dealing with wa-tersheds where only few or no discharge measurements are available. For this study a model-consistent approach which has been tested previously for early flood warning in large river basins (Ramos et al., 2007; Thielen et al., 2008) is pro-posed:
1. A long time series simulation based on observed me-teorological data is calculated with LISFLOOD. Obvi-ously, the denser the station network, the better rainfalls and subsequent discharge peaks can be captured. 2. For each grid point, the discharges from the long-term
Fig. 4.Observed (Blue) and simulated (Red) Gard discharges at the Corb`es (262 km2)from 1/1/1994 to 31/12/1998.
atively short time series for which reliable meteorolog-ical data are available for this study (1990–2002), the quantiles approach was used. Discharges are ranked from highest to lowest and certain cut-off values are chosen as critical thresholds. The highest discharge is defined as the severe threshold level. That corre-sponding to the 99% highest discharge is chosen as the
highthreshold level (comparison with observations has shown that this corresponds frequently with observed 1–2 year return periods), the 98% asmediumand the 97% aslow.
3. Comparison with observations is performed through the exceedance of the different corresponding thresh-olds. For instance for the “high” threshold, it is
Qobs>Qthreshold High obswhenQsim>Qthresholds High sim, The major advantage of this approach is that any systematic over- or under-prediction of the model is compensated for. If the model tends to over-estimate discharges in a given river reach, for example because of a non-optimized parameteri-zation or lack of processes such irrigation or reservoir oper-ations, this would be reflected in the thresholds as well as in the forecasts. In this way the relative difference of sim-ulated discharge to simsim-ulated thresholds, but not the actual values, are evaluated. The same procedure was used for the calculation of observed thresholds. The limitation of the ap-proach is that EFAS may produce reasonable results in terms of threshold exceedance while being seriously offset from the observed hydrographs. Such quantitative discrepancies need to be identified and reduced over time to ensure that the system remains credible. For visualization, the critical thresholds are coded by different colors (Table 2).
For those stations where observed discharge data are avail-able, the same method has been applied to calculate the cor-responding critical valuesQcobs.
One of the main drawbacks for this study lies with the dif-ferent time and space resolutions that are imposed by the availability of the data. While for the determination of the
Fig. 5. Scatterplots for the stations in the Ard`eche(a), C`eze(b), Gard(c)and Vidourle(d)with the daily observed discharges in m3/s on the x-axis and simulated discharges in m3/s on the y-axis during the 1990 to 2002.
thresholds only daily meteorological and hydrological data are available over a sufficient long time, flash floods them-selves develop on shorter time scales. It is therefore likely that the calculated thresholds are low compared to the actual peak discharges occurring during flash floods. Long-term studies with hourly data were not available for this study but are planned in future work. In a similar way, the weather forecasting data neither entirely match the resolution of the climatological network nor the high-resolution network. Too low thresholds can lead to a high number of false alarms that could be reduced if the data used to determine the thresholds were of higher resolution.
4 Results
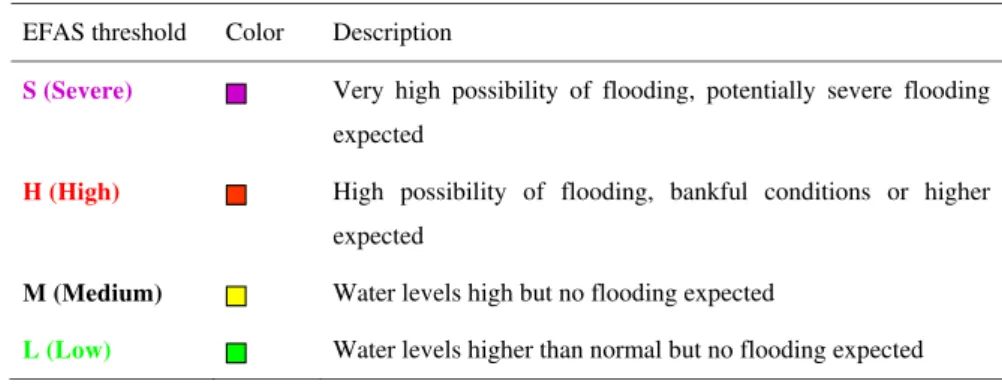
Table 2.EFAS thresholds, their color codes and associated hazard class.
EFAS threshold Color Description
S (Severe) Very high possibility of flooding, potentially severe flooding
expected
H (High) High possibility of flooding, bankful conditions or higher expected
M (Medium) Water levels high but no flooding expected
L (Low) Water levels higher than normal but no flooding expected
but the exceedances of corresponding thresholds. Therefore the performance of the simulations is not assessed in terms of classical efficiency measures, but rather through the number of hits, false alarms and misses.
The number of threshold exceedances, shown in Fig. 6 as cumulative values over the 12 year period for both simulated and observed data series, shows that the simulated thresh-old exceedances compare well with the observed ones, in particularly for the Gard and Ard`eche. While during cer-tain periods differences can occur, with increasing number of years the values approach similar numbers, indicating that the 12 year period is sufficiently for the calculation of the thresholds.
The exceedances of threshold levels for both the simulated and observed discharges have been summarized in contin-gence tables (Table 3) for each of the four threshold levels. Figure 7 shows, for the same stations as in Fig. 5, the first three components of this contingence table for thresholds high, medium and low. By definition, the “severe” threshold, which is defined as the highest discharge of the time series, cannot be exceeded and is therefore zero in all cases. Posi-tive rejections, the vast majority of the cases, are not plotted to avoid distortion of the graphs.
The splitting of the contingence tables shows mixed re-sults. When analyzing the data according to the lowest alert class, there are generally more hits than false alarms or misses. The numbers of misses and false alarms are about equally high. When looking in more detail at the different threshold classes, the number of hits compared to the number of false alarms tends to decrease from low to high threshold classes.
These results must, of course, be analyzed in view of the uncertainty introduced through the variable quality of the meteorological input data and the events analyzed. In the case of the Vidourle (Fig. 7c) also the large gaps in discharge observations introduce additional uncertainty into the calcu-lation of the observed discharge thresholds. Flash floods are events that are much localized and there is a high probabil-ity that the synoptic station network misses the event – hence
Table 3.Definition of contingence table for threshold N.
Qobs≥Qthreshold N,obs Qobs<Qthreshold N,obs Qsim≥Qthreshold N,obs H (Hit) F (False)
Qsim<Qthreshold N,obs M (Miss) PR (Positive Rejection)
a high number of misses. More surprisingly is perhaps the high number of false alarms. This can be partially explained with the temporal resolution of the input data and the corre-sponding daily time step which can easily introduce a 1 day time shift which in this rigid analysis based on daily values then counts as a miss or false alarm. A systematic time shift could not be identified. If the input data were available at a higher temporal resolution and derived from a higher density network, the results would very likely be better.
It can be concluded from the long-term study that with the given input data resolution the simulated discharges tend to be considerably lower than those observed. The approach is capable of detecting the events whereas the intensities of the events are more difficult to simulate reliably. Therefore quantitative analysis of discharges could not be used for flood warning, while the threshold exceedance approach allows better identification of events.
4.2 Forecasting the 8–9 September 2002 event
In LISFLOOD the output of the daily long-term simulations are used as initial conditions for the hourly flood simulations. The model initial conditions have not been updated with ob-served data between the 00:00 and 12:00 forecast simula-tions. Comparison between accumulated rainfalls from radar (Fig. 2a), high resolution rain gauge network (Fig. 2b) and weather forecasts (Fig. 8) show that there are big differences in terms of spatial distribution as well as magnitude.
Fig. 6.Cumulative number of threshold exceedances for the observed (solid) and simulated (dashed) time series starting on 1/1/1990 up to 31/12/2001.
Fig. 7. Contingence tables of hit, false, and missed threshold ex-ceedances for Chambonas in the Ard`eche(a), Bess`ege in the C`eze
(b), Corb`es in the Gard(c)and Sauve in the Vidourle(d)for the daily discharge exceedance analysis from 1990–2002.
compared to the interpolated gauge data. In contrast, the daily values of the synoptic gauges do not capture the event in its total spatial distribution. The rainfalls are concentrated in the Southeast of the catchment. Also the rainfall quantity is much too low. As for the weather forecasts, the rainfall patterns are shifted too far north compared to the observa-tion. This is has been observed also for other meteorologi-cal models, as documented in Anquetin et al. (2005). Also, the overall volume of precipitation has been under-estimated by the weather forecasting model, which again has been ob-served previously for other weather forecasting models.
Fig. 8.Accumulated rainfalls from the 20020907 12:00 20020908 00:00, 20020908 12:00 20020909 and 00:00 48 h forecasts, and observed (using 101 rainfall gauging stations (see Fig. 1) for the same period.
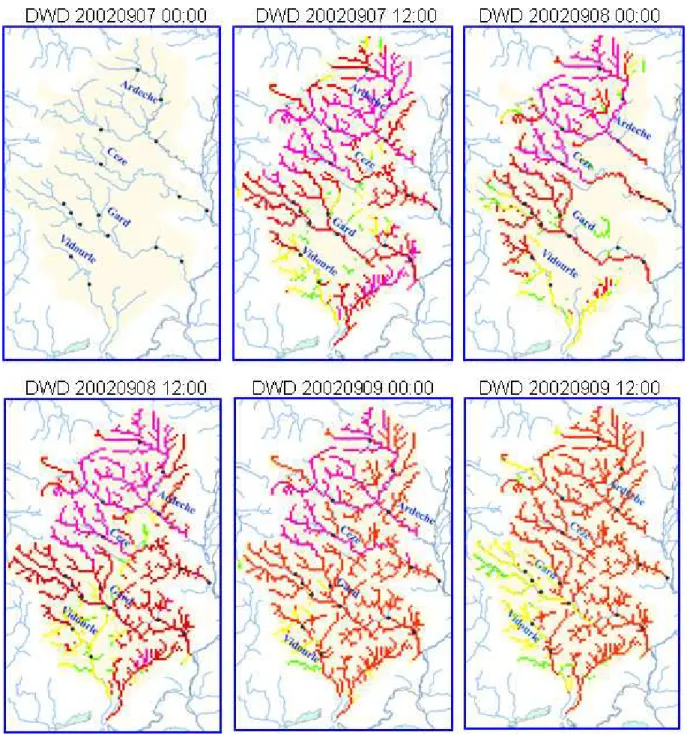
Figure 9 clearly illustrates the principle of the threshold exceedance. The simulated discharges – even with high res-olution radar and gauge data – are three times lower than the observed discharges for which they reach (i.e. measured by radar) or exceed (i.e. measured by gauges) the EFAS severe threshold, indicating serious flooding in the Gard. Although the forecasted rainfalls for the region were shifted too far north compared to the observations and comparatively low rainfalls were forecasted over the Gard basin (Fig. 8), the high threshold is being exceeded with all forecasts from the 7 September 12:00 forecast onwards. Also, the timings of the forecasted peaks correspond well with the observed peak on 9 September at 06:00 o’clock +/– 1–2 h. Thus, although the severity of the event is under-estimated, there is an early warning indication that flooding can be expected within 42 h. Estimating the run-times of the meteorological and hydro-logical models as well as data transfer and preparation time of the data to be about 6 h, the lead-time is still of the order of 1 day and more (Fig. 9c). In contrast to the Gard basin, the discharge forecasts for the Ard`eche over-estimated the sever-ity of the event (not shown). Clearly, the benefit of these forecasts lies with the potential early warning of the flood event. As the events draw nearer, the flood forecasters would increasingly make use of the observational networks to iden-tify the spatial distribution and the magnitude of the flooding. Figure 10 illustrates the spatial development of forecasted event. Again the exceeded alert thresholds are visualized with the color coding listed in Table 2. Each panel shows the maximum alert threshold exceeded during the forecasting period in 12 hourly steps. The panel clearly illustrates that the event is first forecasted on 7 September, 12:00, to take place in the upstream areas of all 4 river basins. In the next forecasts the emphasis is mostly in the Gard and C`eze rivers
Fig. 9. (a)Observed hydrograph at G´en´erargue in the Gard river with the vertical line indicating the time of peak at 06:00 on 9 September, while at 07:00 with Radar(Green) and at 08:00 with the using of high density rainfall gauging network (Grey dashed).
(b) Hydrographs of forecasted discharges in m3/s (y-axis) for G´en´erargue (244 km2) in the Gard river from the 9–12 September 2002 starting at 12:00 in hourly time steps (x-axis). The flood fore-casts based on DWD forefore-casts start on 0906 00:00 until 0909 00:00 in 12 h time intervals. (c)Illustrates the visualization of threshold exceedances in hourly time steps for the flood forecasts based on radar data and 48 h DWD Lokalmodell forecasts from 20020907 00:00, 20020907 12:00, 20020908 00:00, 20020908 12:00 and 20020909 00:00. Both observed (solid line) and simulated (dashed lines) exceeded thresholds are color coded as purple (severe), red (high), yellow (medium) and green (low). Grey color indicates no data available.
and less in Ard`eche and Vidourle. The panel shows how the flooding is forecasted to affect almost the entire basins, well exceeding the severe thresholds over large parts of the river basins. Downstream, towards the outlets, mostly only high thresholds are exceeded.
Fig. 10. Summary threshold exceedance maps showing the highest threshold exceeded during the 48 h forecasting time for flood forecasts based on the DWD Lokallmodell weather forecasts from 20020907 00:00 and in 12 hourly steps until 20020909 12:00. The threshold exceedances are color coded with purple (severe), red (high), yellow (medium) and green (low).
In summary one can state that – in this particular case – a system such as the one presented could have provided early warning of the event more than 24 h in advance, with a good estimation of areas affected, timing and magnitude of the event. It appears that the high thresholds derived from the long-term simulations can be used as an indicator for flood events when limited area meteorological model input data are used to drive the simulations.
4.3 Assessments of hits, false alarms and missed events over a 6 months forecasting period
term analyses were beyond the scope of the current feasibil-ity study, but are planned for the future.
For computational and data availability constraints, this study is limited to running all 12:00 DWD forecasts (48 h lead-time) for a six months period from June to December 2002. The forecasts are initialized with the results from a 6 months simulation based on hourly data from the high reso-lution rain-gauge network. For the 6 months analysis only 9 out of the 15 stream gauging stations were available. For the assessment of the 6 months analysis a flood event is defined as the exceedance of the high alert threshold - both simulated and observed – at least once during a 24 h period. If the high threshold has been exceeded for two consecutive days it is still only counted as one event. If the forecasted hydrographs exceed the simulated high threshold during any time of the observed event, it is counted as a hit.
For this period the OHM-CV has classified 11 significant rainfall events (i.e. 3, 5, and 8–9 September; 9–10, 21, and 30–31 October; 14, 21 and 24 November; 10–11 and 27 De-cember), where a significant event is defined when at least one station has reported more than 50 mm of rainfall during the event. Out of these 11 rainfall events 6 have resulted in a flood event (9 September, 10 October, 22 and 24–27 Novem-ber, and 11–13 and 29 December) where a flood event is de-fined as the observed discharge data having exceeding the observed high threshold.
Table 4 summarizes the number of hits, false alarms and misses for the period from 5 June 2002 to 31 December 2002. Positive rejections are not listed.
Over the six-month period there are more false alarms (17) than hits (13) and the number of misses (9) is lowest. From Table 4 it is striking that missed events occurred mostly in the winter months. A closer look at the December events showed that the weather forecasts were shifted too far north, where more precipitation was simulated as snow than was observed. In some cases where both simulated and observed discharges are close to their corresponding thresholds, false alarms or misses can easily occur if one exceeds its thresh-old by a small amount while the other one stays just below. This may produce misleading results, in particular for sta-tions where the calculation of the observed thresholds has large uncertainties associated with the gaps in data series. This could potentially be overcome by setting a buffer zone around the fixed threshold value. This was not done in this study.
One of the reasons that the number of false alarms is higher than the hits is that the weather forecasts tend to spread the precipitation over larger areas than actually oc-curs. As a result flooding was simulated in almost all river basins while it only occurred in one or two. The threshold method as presented in this paper does not show whether a threshold is only just exceeded or reached.
In terms of early warning, the missed events are the most serious ones because they do not induce any precautionary measures, while early warning of false alarms can easily be
Table 4. Number of Hits, False Alarm and Misses out of 178 days of analysis from 5th of June to 31st of December 2002 of flood forecasting based on the 12:00 DWD weather forecasting data.
Hits False Alarm Misses
June 0 0 0
July 0 0 0
Aug 0 0 0
Sep 4 4 0
Oct 2 6 0
Nov 6 6 3
Dec 1 1 6
Summary 13 17 9
identified through weather observations and radar prior to the event.
It can be concluded from the long-term study that a six-month period for the statistical assessment of hits and false alarms is not sufficiently long. The analysis indicates, how-ever, that the method captures the major flood events, while the forecasted rainfalls are often too widespread resulting in a high number of false alarms. The number of missed events is comparatively low, which is important since, as just stated, missed events are the most undesirable in terms of early flood warning.
The study also highlights again that the usefulness of any flash flood warning system depends very much on spatially and quantitatively good precipitation forecasts.
5 Summary and conclusions
In this paper the feasibility of interfacing short-range numer-ical weather forecasts with a spatially distributed rainfall-runoff model for early flash flood warning in ungauged river basins has been explored. The methodology is based on flood threshold exceedances, where the thresholds are de-rived from long-term simulations with an essentially uncal-ibrated hydrological model. The same model is then used with weather forecast data and the model-consistent thresh-olds applied for the analysis.
The proposed forecasting strategy addresses a number of shortcomings typically present in flash flood forecasting, namely coarse meteorological station networks and few or no discharge station data.
the Gard river basin only with high and not severe threshold values exceeded. Taking into account computing time, pro-cessing time and analysis time, the effective lead-time could still have been in the order of 24 h. A six-month analysis con-firms that the approach is capable of capturing major events. However, due to the more widely spread forecasted rainfalls, the number of false alarms is relatively high. Therefore the results of such an early warning system should only be used by local flood forecasters as a first indication that a severe event might take place, and should not be distributed to the public.
The number of misses, on the other hand, is comparatively low. This is important since missed events in terms of early warning are more important than false alarms, which can be easily identified in the subsequent hours. In the case of a missed event, however, the benefit of early preparedness measures is lost.
A first attempt of combined analysis of the physical and human responses to this devastating Mediterranean storm (Ruin et al., 2008) shows that most of the casualties were not prepared for (1) the strength of the event and its con-sequences in terms of water speed, and (2) the time evo-lution of the storms. In 2002, the warning system, mainly based on the meteorological forecasts, was not designed to give a hydrological signature of the forecasted event. Today, such information could be effectively transmitted through the Schapi5, a flood forecasting centre that has been recently es-tablished following the devastating series of flash floods dur-ing the last decade. Together with the Observatoire Hydro-M´et´eorologique C´evennes-Vivarais (OHM-CV) which has now established a high-density measuring network, the per-formance of such a forecasting system could be greatly im-proved with better initial conditions, calibrated hydrologi-cal model and more realistic thresholds. The radar network could then be used for confirmation of the event and more precise developments. The results show, however, that the principle can also be useful for those areas where no data are available and where the approach could greatly contribute to the preparedness for flash flood events, specifically in terms of awareness, identification of regions at risk, and potential magnitude and timing of the event.
Acknowledgements. This work was carried out in the framework of
the FLOODsite project funded by the FP6 Program of the European Commission under the no GOCE-CT-2004-505420. The authors thanked the OHM-CV for providing the radar observations and the discharge data, the Deutscher Wetterdienst for the high-resolution weather forecasting data and the DG JRC AgriFish unit for providing their meteorological data for research purposes.
Edited by: F. Pappenberger
5Service Central d’Hydrom´et´eorologie et d’Appui `a la Pr´evision
des Inondations.
References
Anquetin S., Creutin, J. D., Delrieu, G., Ducrocq, V., Gaume, E., and Ruin, L.: Increasing the forecast-ing lead-time of Weather driven flash floods, Re-port on http://natural-hazards.jrc.it./downloads/public/ 2004report FeasibilityStudyOnFlashfloods.pdf, 2004.
Anquetin, S., Yates, E., Ducrocq, V., Samouillan, S., Chancibault, K., Gozzini, B., Pasi, F., Pasqui, M., Garcia, M., Martorell, M., Romero, R., Silvio, D., Accadia, C., Casaidi, M., Mariani, S., Ficca, G., and Chesa, P.: The 8 and 9 September 2002 flash flood event in France: an intercomparison of operational and research meteorological models, Nat. Hazards Earth System Sci., 5, 741– 754, 2005.
Board on Atmospheric Sciences and Climate (BASC): Flash Flood forecasting over complex terrain, the National Academies Press, http://www.nap.edu/catalog.php?record id=11128, 2005. Borga, M., Tonelli, F., Moore, R. J., and Andrieu, H.:
Long-term assessment of bias adjustment in radar rain-fall estimation, Water Resources Research, 38(11), 1226, doi:10.1029/2001WR000555, 2002.
Boudevillain, B., Delrieu, G., Chapon, B., Kirstetter, P.-E., Nicol J., and Andrieu, H.: The Boll`ene-2002 experiment: innovative algo-rithms and evaluation of processing strategies for radar QPE in the C´evennes – Vivarais region, Proceeding of the 4th European Conference on Radar in Meteorology and Hydrology, Barcelona, 157–160, 2006.
Chancibault, K., Anquetin, S., Ducrocq, V., and Saulnier, G.-M.: Hydrological evaluation of high-resolution precipitation forecast of the Gard flash flood event (8–9 September 2002), Q. J. R. Meteorol. Soc, 132, 1091–1117, 2006.
Chapon, B.: Etude des pluies intenses dans la r´egion C´evennes-Vivarais `a l’aide du radar m´et´eorologique. R´egionalisation des traitements radar et analyse granulom´etrique des pluies au sol, PhD Thesis (in French) University Joseph Fourier, Grenoble, 197 p., 2006.
Chen, S.-T. and Yu, P.-S.: Real-time probabilistic forecasting of flood stages, J. Hydrology, 340(1–2), 63–77, 2007.
Chow, V. T., Maidment, D. R., and Mays, L. M.: Applied Hydrol-ogy, McGraw-Hill, Singapore, 1988.
Collier, C.: Flash Flood Forecasting: What are the limits of pre-dictability? Q.J.RM.S., 133, 622A, 3–23, 2007.
Creutin, J. D. and Borga, M.: Radar Hydrology modifies the mon-itoring of flash flood hazard, Hydrological processes, 17(7), 1453–1456, 2003.
Delrieu G., Ducrocq, V., Gaume, E., Nicol, J., Payrastre, O., Yates, E., Kirstetter, P. E., Andrieu, H., Ayral, P.-A., Bouvier, C., Creutin, J.-D., Livet, M., Anquetin, S., Lang, M., Neppel, L., Obled, C., Parent-du-Chˆatelet, J., Saulnier, G.-M., Walpersdorf, A., and Wobrock, W.: The catastrophic flash flood event of 8–9 September 2002 in the Gard region, France: a first case study for the C´evennes-Vivarais Mediterranean Hydro-meteorological Observatory, J. Hydrometeorology, 6, 34–52, 2005.
De Roo, A., Odijk, M., Schmuck, G., Koster, E., and Lucieer, A.: Assessing the effects of land use changes on floods in the Meuse and Oder catchment, Physics and Chemistry of the Earth, Part B: Hydrology, Oceans and Atmosphere, 26(7), 593–599, 2001. Ducrocq, V., Aullo, G., and Santurette, P.: Les precipitations
Everhardus, C., de Roo, A., de Jong, S.: Validation of the LIS-FLOOD runoff model for a mountainous catchment. Report of the European Commission, Joint Research Centre, EUR 20514 EN, 2002.
Feyen L.: Calibration of the LISFLOOD model for Europe: current status and way forward, European Commission EUR22125 EN, 2005.
Feyen, L., Vrugt, J. A., ´O Nuall´ainc, B., van der Knijff, J., de Roo, A.: Parameter optimisation and uncertainty assessment for large-scale streamflow simulation with the LISFLOOD model, J, Hy-drol., 332(3–4), 276–289, 2007.
Fritsch, J. M., Houze, R. A. J., Adler, R., Bluestein, H., Bosart, L., Brown, J., Carr, F., Davis, C., Johnson, R. H., Junker, N., Kuo, Y. H., Rutledge, S., Smith, J., Toth, Z., Wilson, J. W., Zipser, E., Zr-nic, D.: Quantitative precipitation forecasting: report of the 8th prospectus development team, U.S. Weather Research Program, Bull. Amer. Meteorol. Soc., 79, 285–299, 1998.
Georgakakos, K. P.: Analytical results for operational flash flood guidance, J. Hydrol., 317(1–2), 81–103, doi:10.1016/j.jhydrol.2005.05.009, 2006.
Gruntfest E. and Handmer, J.: Coping with flash flood, Ed. NATO Science Series, 322 p, 1999.
Huet, P., Martin, X., Prime, J.-L., Foin, P., Laurain, C., and Can-nard, P.: Retour d’exp´erience des crues de septembre 2002 dans les d´epartements du Gard, de l’H´erault, du Vaucluse, des Bouches-du-Rhˆone, de l’Ard`eche et de la Drˆome. Technical re-port, Minist`ere de l’Ecologie et du D´eveloppement Durable, R´epublique Franc¸aise, 133 pp, 2003.
Lindstr¨om, G., Johansson, B., Persson, M., Gardelin, M. and Bergstr¨om, S.: Development and test of the distributed HBV-96 hydrological model, J. Hydrol., 201, 272–288, 1997.
Nuissier, O. Ducrocq,, V., Ricard, D., Thouvenain, T. and Anquetin, S.: A numerical study of three catastrophic precipitating events over western Mediterranean region (Southern France), Part I: Numerical framework and synoptic ingredients, Q. J. R. Meteo-rol. Soc., 134(630), 111–130, doi:10.1029/10.1002/qj.200, 2008. Palmer, T. N. and R¨ais¨anen, J.: Quantifying the risk of extreme seasonal precipitation events in a changing climate, Nature, 415, 512–514, 2002.
Parry M., Canziani, O., Palutikof, J., van der Linden, P., and Han-son, C.: Climate Change 2007: Impacts, Adaptation and Vulner-ability, Cambridge University Press, 840 p., 2007.
Ramos M.-H., Bartholmes J., and Thielen-del Pozo, J.: Develop-ment of decision support products based on ensemble forecasts in the European flood alert system, Atmos. Sci. Lett., 8, 113–119, 2007.
Reed, S., Schaake, J., and Zhang, Z.: A distributed hydrologic model and threshold frequency-based method for flash flood forecasting at ungauged locations. Journal of Hydrology, 337(3– 4), 402–420, 2007.
Rosso R. and Rulli, M. C.: An integrated simulation method for flash flood risk assessment: 2. Effects of changes in land-use un-der a historical perspective; Hydrology and Earth System Sci-ences, 6(3), 285–294, 2002.
Ruin I., Creutin, J.-D., Anquetin, S., and Lutoff, C.: Human ex-posure to flash floods – relation between flood parameters and human vulnerability during a storm of September 2002 in South-ern France, J. Hydrol., in press, 2008.
S´en´esi, S., Bougeault, P., Ch`eze, J. L., and Cosentino, P.: The Vaison le Romaine Flask flood: Meso-Scale Analysis and Pre-dictability Issues. Wea. Forecasting, 11, 417–442, 1996. Smith R. E. and Goodrich, D. C.: Rainfall Excess Overland Flow,
Encyclopedia of Hydrological Sciences, John Wiley & Sons, Ltd., 1707–1718, 2005.
Thielen, J., Bartholmes, J., Ramos, M.-H., and De Roo, A.: The European Flood Alert System – Part 1: Concept and develop-ment, Hydrol. Earth System Sci. Discuss., 5(1), 257–287, 2008. Todini E.: The ARNO rainfall-runoff model, J. Hydrol., 175, 339–
382, 1996.
van der Knijff, J. M., and de Roo, A.: LISFLOOD Distributed Water Balance and Flood Simulation Model. Report of the European Commission, Joint Research Centre, EUR 22166 EN, 2006. Yates, E., Creutin, J.-D., Anquetin, S., and Rivoirard, J.: A scale
dependant quality index of areal rainfall prediction, J. Hydrome-teorology, 8(2), 160–170, 2007.