" .,.-FUNDAÇÃO " GETULIO VARGAS EPGE
Escola de Pós-Graduação em
-SEMINÁRIOS
DE PESQUISA
ECONÔMICA
.. Economia
-.
"A Neoclassical Model of Capital
Accumulation in Presence of Unproductive
Activities: Implications for the Stationary
State"
Prof. Samuel de Abreu Pessôa
Co-autoria: Paulo Barelli
LOCAL
Fundação Getulio Vargas
Praia de Botafogo, 190 - 10° andar - Auditório
DATA
25/02/99 (5a feira)
HORÁRIO
16:00h
Coordenação: Prof. Pedro Cavalcanti Gomes Ferreira Email: [email protected] - • (021) 536-9250
-.
A Neoclassical Model of Capital Accumulation in Presence of
Unproductive Activities: Implications for the Stationary State
Paulo Barelli and Samuel de Abreu Pessôa *
Very Preliminary Version: September 1998
1. Introduction
The objective of this paper is to construct a neoclassical model of capital accumulation that incorporates the existence of unproductive activities. These activities alter the intertemporal rei ative price (effect Harberger) and use real resources in activities that do not add product that has social value (effect Tullock). We believe that the absence of unproductive activities in the usual models of growth is one of their largest deficiencies. There is a relatively large amount of evidences that the institutional set, conditioning the private return ofthe economics activities and determining edges among social and private return of the economic agents' actions is the main distai reason 1 of the inequality of per
capita income among countries. This reason is trivial and many economists and historians2 have pursued this connection. The individuaIs are guided in the market by private returns while the benefit for the society proceeds trom the social returns. Whenever the institutional set imposes a large distance between these two returns the economies may underperform.
The objective of this work is to construct a model, in the tradition of the neoclassical model of capital accumulation that considers the possibility of the existence of activities whose social return is smaller than the private returno We obtained a solution for the capital of stationary state that depends on an institutional variable that conditions the private return of the unproductive activity. The stationary state solution of the model is calibrated with data trom Summers and Heston data set. It is shown that the model describes welI several observed statistics. In particular, it is offered an explanation for the 'problem' ofthe height ofthe aggregate production functions3.
• Departamento de Economia e Escola de Pós Graduação em Economia da Fundação Getúilio Vargas, Rio de Janeiro. E-mail: pessoa(àfgy.br .
1 Distai causes, as Maddison (1994) named.
2 It is possible to find this concem in Adam Smith. See Baumol (1990), North (1990) and E. L. Jones
(1989) for three newer examples.
-
.
'.
2
2. Informal description of the Model
There are two activities in the economy. The first uses capital and works, through a neoclassical standard production function (first order degree homogenous), to produce a good that can be consumed or stored in the form of capital. The second activity uses capital and labor, in a neoclassical production function, to produce a service, called 'transfer effort'. This, combined with a variable that captures the quality of the institutional set, determines the amount of the product produced in the productive sector that is captured by the transfer sector. In the short mn general equilibrium, the firms maximize profits, taking given the behavior of the companies of the other sector. In equilibrium the production factors will be allocated between these activities until the return in the margin is equaled4
. It is possible to show that this static equilibrium exists
and it is unique.
The existence of an activity that produces private return, without generating social return, diverts production factors reducing the potential product of the economy (effect Tullock). Besides this effect, the unproductive activity depresses the marginal return of capital. Consequently there is an impact on the decision of capital accumulation (effect Haberger). (The families made this decision, in a determinist set, maximizing the discounted present value of the future consumption's utility.) It is possible to derive a golden mIe for this two-sector economy. It is obtained in the stationary state a system of equations that could be calibrated to find the quality of the institutional set and of the capital stock implied by the model, from the observed value of the per capita income. It is shown that the value of the institutional variable implied by the model correlates relatively well with an index of institutional efficiency (GADP). From the knowledge of the implied value of the capital sock and of the observed income it is calculated the height that an aggregated production function would have (supposing that the capital share is 1/3) to generate the income observed with this capital. It is shown that this height correlates quite well with direct measures.
The last aspect mentioned in the previous paragraph constitutes our solution to the problem of the 'heights observed' of the aggregated production functions. Several authors5 noticed that to explain the product observed with the observed capital, starting from an aggregate function which the participation ofthe capital in the income is 1/3, it is necessary to suppose that the heights of this aggregate function differ. This contrasts with the neoclassical standard hypothesis, according to which the technologies are supposed to be the same among economies. Our argument is that even supposing identical technologies, considering the existence of unproductive activities, and that the incentives vary among economies, it is possible to obtain 'different heights' for the aggregate production function that represents each economy.
This work presents the following organization. Section 3 presents the mode!. The fourth section exposes the calibration and the simulations of the equations that describe the stationary state ofthis economy. The conclusion follows.
4 Due to the factor mobility. 5 See note 3
MMMMMMMMMセNMMMMMMMMMMMMMMMMMMMMMMMMMMMMMMMMMMMMMMMMMMMMMMMMMMMMMMMMMMMMMMMMMMMMMMMMMMMMMMML@
-
.
3
3. The madel
Static equilibrium
There are two productive sectors. The first combines capital and labor, applying a (first order degree homogeneous) neocJassical production function, to produce a good that serves as consumption or capital. The second sector uses capital and labor to produce a service, called oftransfer effort. FormaIly:
Yj
=
F;(LoKi)=
Li F; (l,Ki) == Li/;(kJ/; '(ki) > O,/; "(ki) < O,lim /; '(ki) = oo,i = 1,2, .
kj --+0
(1)
Where
1;
is the production of the sector i, Li and Ki are the labor and capital servicesemployed in the sector i, and F; is the technology used to produce the good or service i. The total product is divided among the two sectors. One share is kept by the sector that incurred the production effort and the other share is taken by the sector that specialized in redistributing incomes:
RI ]HャMイIセL@
IS
]イセL@ Osrs1, (2)where
R;
is the income received by the i-esimo sector. The portion appropriated by the transfer sector is defined as r=
ァHセRIL@ where Y2 is the flow of transfer services,Y2
=
1;/
L, with L=
LI + L2 being the total population6 and B an institutional variable,
or the exogenous variable that represents the efficiency of the institutional set of the economy. There is externality in the production set because one product depends on the decision taken by the others. The function that represents the success of the transfer effort in appropriate of income trom the productive sector satisfies the following conditions:
lim g(x)
=
0,x--+o
lim g(x)
=
1,X->OO
g'(x) > O,g"(x) < 0,
lim g' (x)
=
00,x--+o
x]セRᄋ@
(3)
Equations (3) are the lnada conditions. The condition that the success of the transfer effort is not larger than 100%, nor negative. For a given institutional set, the larger the transfer effort the larger the income trom the productive sector that wiIl be appropriated, and this appropriation presents decreasing returns. In the same away, the larger the value of B, for a given value ofthe transfer effort, the larger is the success ofthis activity, and consequently worse is the institutional set to secure the property rights. The last condition stress that there are always incentives to deleterious activities, since the retum of the first unit of effort is infinitely large. However, with the maximum of efficiency7, there is no
6 Labor is ofIered inelastically.
セMMMMMMMMMMMMMMMMMMMMMMMMMMMMMMMMMMMMMMMMMMMMMMMMMMMMMMMMMMMMMMMMMMMMMMMMMMNMMMM - - _ .
4
incentive for the agents to organize in firms that try to extract income. In this case the society would reach the "neoclassical nirvana."
The profits are given by:
lr)
=
(1-g(0-'z»L)J;(k)-wL) -rK),lr2 ]ァᆱHIャRヲRHォコᄏIセ@ -wL 2 -rK2,li =LiIL, (4)
where lri is the profit in units of the good 1 of the sector i, and w and r are the
remuneration of the services of the labor and capital respectively. From the profit maximization follows:
r
=
(1-g(t&2 »J; '(k)=
tt"'
(0-'2)yJ2 '(k2),W
=
(1-g(t&J)(J; (k) - k)J; '(k))=
()g'(0-'2)Y) (f2 (kJ - k2f2 '(k2»· (5)In the equations above, the second equalities come from the hypothesis of perfect mobility of factors, which, from arbitrage among sector forces the equalization across sectors ofthe values ofthe marginal products of each factor. Additionally, with respect to equation (4) and (5), it stands out the character of no-cooperative game among the economic agents. In the maximization of profits of each sector, the production of the other sector is taken as given (it is not taken into account the action ofthe other sector).
As it is always this with this class of mo dei, where capital is forgone consumption, saving is trivially equal to investment. The static8 equilibrium is an allocation of capital and labor in each sector (Ki ' Li , i
=
1,2 ), in a way that conditions (5)are satisfied. To show that this allocation exists and is unique we profit from the resemblance ofthose conditions and the equivalent conditions for the standard two-sector model9, which arelO:
r
=
p)J; '(k)=
p2fz' (k2),W
=
p)(ft
(k) - k)J; '(k))=
P2(f2 (k2) -k2f2'(k2»· (6)Comparing (5) with (6), it is noticed that the terms (1-g(0-'2» and ()g'(0-'2)Y) in (6) take
the same role as the prices in (6). In particular, the incentive to the alocation of factors in the traditional two-sector model is given by the relative price and, for the model with productive sector and transfer sector is given by P
=
P2 / p) . From the point of view ofthe technology that combines capital and labor to produce the second good, an increase in its relative price moves factor into it and consequently out of the first sector. In the same way, from the point of view of the technology that combines capital and work and produces a transfer service, an increase on h
=
tt"'(8y2)y)/(1- g(8y2» represents anincentive to the displacement of factors into such activity. Therefore, short run equilibrium is characterized by:
8 By static it is meant k fixo
9 For exemple look at Kemp (1969) or Wong (1996).
) o See the appendix for more details.
(7)
'.,
5
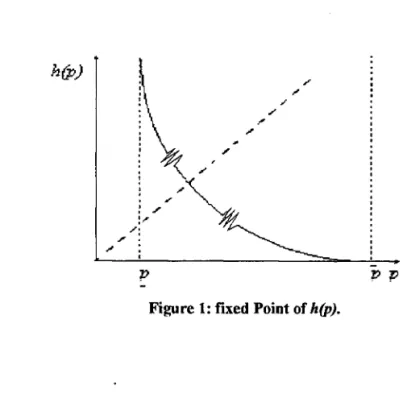
Given a relative profitability p, the economy positioned in a point on the possibility
production frontier whose inclination is p, and consequently, the production in each
sector is Yi
=
Yi(p,k). When the economy is working in that point of the possibilitycurve the factor relative rentability is given by h(p). Therefore, the fix point of the
mapping h(p) is the short run equilibrium for this economy (figure 1).
The static equilibrium defined in (7) exists and it is unique. This result could be seen using the offers functions of the traditional two-sector model derived in the appendix. Substituting them into (7), we get that the incentive h(p) is function of the
relative price, ofthe capital stock and ofthe institutional efficiency. In the short run, k is
given and 8 is exogenous by hypothesis. ConsequentIy, the relative price was adjusted to guarantee that the equilibrium of compatibility of incentives is attained. In the non-specialized region from the Inada condition we know that p E
(E.,p),
whereE.
andp
are the specialized price for sector 1 and sector 2 respectively. Additionally, we know that:
âz(p,k,8)
=
セGHケャャ@ +hY21)+82g"YIY21 P:h(}2g"YIY21 <Ocp
1-g 1 - g ' (8)where we suppressed the arguments to simplify the notationll
. The function h(p) tends to
infinite when p
=
Pz / PI tends toE.,
and to zero as p approachesp,
what guaranteesthe existence of at least a fixed point. In the equilibrium (p
=
h), the mapping inclinationis negative, and therefore this fixed point is unique12 .
h(P)
Figure 1: fixed Point of h(p).
11 The second equality comes from the definition of h, and the tlúrd equality from the inclination ofthe
production possibility frontier. The hypotheses thatg"<O is crucial to prove the uniqueness.
6
Dynamics
Our intention is to describe the differential of income across the economies. There are no concems about divergence in the growth rates. It is supposed that the technology spreads in such way that in the long run there is convergence of the growth rate. The rate of grow are common, given by the evolution of the technological frontier. This is taken exogenous and, to simplify it is assumed that is zero. A representative agent facing an infinite life span populates the economy. There is a consumption good in the economy, which is produced by the productive sector. The only decision ofthe family is the amount of their income that should be saved or consumed. The economy is closed and there are not installation costs of capital, so the investment is passive. In that way, goods not consumed are added to the capital stock.
The representative individual solves the following problem:
00
max
J
e-(p-nl/u(c(t»dt,c(/) o (9)
.
s.a k(t)
=
r(t)k(t) + w(t) + x(t) - c(t) - nk(t),where the instantaneous utility is concave and satisfies Inada conditions, c(t) is the per capita consumption, n is the population growth rate (dLlL), p is the rate of time
preference and x(t) is a lump sum transfer. The transfer is the part of the revenue of the unproductive sector that is not the remuneration of factors employed in this sector. The production technology of the effort transfer presents constant retums but the success of it, determined by the function g, is subject to decreasing retums due to the shape of g. The
inclusion of the size of the population in the intertemporal utility indicates that as the population grows the applied discount to future generations decreases. Each agent when accomplishing their intertemporal decision takes into account their well being and the well being of their descendants. The stock of per capita assets is the per capita capital stock.
The system that characterizes the dynamics of the economy solution ofthe maximization problem (13) is given b/3
:
{
i-
ê=
=
cr(c)«I-y] (p(k(B),B),k(B» g(Y2 (p(k(O», k(O), O).B»J; '(k] (p(k(O»)-- c - nk(B) p).and the
(10)
The stationary state, if it exists, is defined by the values of k* and c* that satisfy the following equations:
{
(1-g(Y2 (p(k * (O),O),k * HoILoᄏIセ@ '(k] (p(k * (B),O»)
=
pc*
=
y] (p(k * (O),O),k * (O» - nk * (O). (11)Consequently, there is a stock of per capita capital that stays constant in the long run, or that characterizes a growth trajectory of balanced for the economy (null for hypothesis). The 10ng run production of the society is (y])*=y](p(k*(B),O),k*(B»,
]3 a(c) Is the intertemporal substitution elasticity.
7
where k *(B) is defined by (11). Among stationary states, the influence on the capital stock of the institutional efficiency is given by the comparative static of the system (11):
dk* .h'g2
K、pO、セィ]ONィGァiyRQ@
-(I-g).h"kl ' ) (12)--= <O
dB
IJI
.
where the sign comes trom the hypotheses that the Jacobiano of the system of equations being negative. That hypothesis is necessary so that the dynamic system has only one stable solution. At this leveI of generality it is not possible to show that this Jacobiano is negative. It is applied here the correspondence princiRle14. Ifthe dynamic is well behaved than the comparative static result is the sensible one 5. The worst the institutional set the lower the long run income.
The final consolidation of the model is given by YI
=
YI (p(k( B), B), k( B», or simply YI=
Y1 (B) . It is possible to split the effect of an increase in B in the Tullock and Harberger effects. The first is the income reduction that folIows the diversion of factor trom the most productive employment, trom the social point of view. The second is the income reduction that accompanies the capital desaccumulation, as a result of the marginal private rentability of capital to falI short ofthe social rentability.(l3)
4. Quantitative implications
In this sector the quantitative properties of the mo dei will be explored for the stationary state. The first step is to define specific functional forms. After this step, we will use information on the products ofthe countries and the values ofthe important parameters to find the values of the variables implied to each country. That is to say, the functional forms have to take in account the use of empiric data, the welI-known procedure known as calibration of the mo de!. A possible formulation is to choose Cobb-Douglas production functions with the incorporation of human capital and a term related the "height" of the functions. In that way, the equation (1) of the previous sector can be written as:
1';
=
AiKiai (LiHJI-ai, i=
1,2, (14) where Ai are the heights of the production functions, ai are the capital share and H is an index for the endowment of human capital. The theoretical meaning of the height of the production function is closely related to the measures of the technological leveI of the industry (in the case, ofthe sector). The inclusion ofhuman capital as production factor is self-explanatory. The more qualified the labor the larger the income produced (according14 See Samuelson (1947).
. ,
8
human capital theories16,17). From analogy to the case of the heights of the production functions, it can be argued that human capital should not be diverse across economies because it is an endogenous variable. Given the institutional set, naturally the individuaIs will make the decision of accumulating human capital consonant its private profitability. Notwithstanding it is known that there are countless credit imperfections associated to this market. In particular human capital is considered a very poor collateral. Therefore, we treat the stock of human capital as an additional indicator of the efficiency of the public sector and, therefore, exogenous18
.
The index ofhuman capital employed here is taken from Hall and Jones (1996). It
is assumed that H j = eifJCSj),j = 1, ... ,N, where N is the number of countries and H j is the
index of human capital of the j-ésimo country and S j is the average years of formal
education. The function tjJ(S) reflects the efficiency of a unit of work with S years of
relative schooling comparing with the efficiency of an illiterate worker tjJ(O)
=
O. Thederivative tjJ'(S) is the increase in the labor efficiency of an additional year of formal
education, calculated by Mincer's equations19.
The function that determines the success ofthe effort oftransfer is:
g(y B)
=
Hセj。@
O < a < 12' bKHセRI。G@ , (15)
lt satisfies the conditions imposed in (3) and, constitutes a natural generalization of Cobb-Douglas. We are left with a parameter to be determined, a 20. The numeric exerci se is to
suppose that the countries of the sample are in stationary state. Then we use data for per capita income of the countries together with values chosen for the parameters to determine the numeric values of the variables implied by the model. The data of income are taken from Hall and Jones (1996). They are the per capita income less the value added in the mining industry, to eliminate the effect ofthe natural resources21.
The hypothesis of stationary state has two implications. The first is that the marginal productivity of capital is equal to the discount rate. The second is that whether the per capita capital or the per capita income should be taken as endogenous. As we have at hand the production function of the productive sector we opted to using the
16 There is evidence that the neoclassical model augmented with human capital could reproduce the
observed diversity on per capita income across economies (Lucas (1990) and Mankiw, Romer and Weil (1992». There are two ways of incorporating human capitaI: (i) consider it as another production factor or
(ii) distinguish it according the average education levei ofthe labor force. We follow the second approach because the empirical evidence does not support the former (Benhabib and Spigel (1994».
I i In the model developed in the last section the labor force were the same across economies. We stress the
institutional diversity to deseribe the variety on per eapita income, while Lucas (1990) eonsiders only difference in education. Taking into account the diversity in human capital in the institutional modelleave us in the middle of the way between the institutional reason and the qualification.
18 This became more evident ifwe remember the ex1ernality associated with human capital .
19 Hall and Jones (1996).
20 The solution is not sensitive to B. See Figure 19.
21 There is plenty of evidence that natural resources are not crucial to economic development. The
examples are too many and deserve enumeration. Japan, the Arabian countries, lreland, Spain and Portugal in gold age and the like. See for example Olson (1996).
IldLlOTECA MARIO HENRIQUE simonseセ@
FUNOAcAo GETULIO VARGAS
- - - セMM セM MセセセセセセセセセセセM
9
product per worker data, and calculate the implied value for the capital stock22. We are
left with four variables to be determined: k, p, (J and A, because A2
=
1, once we remindthat only the ratio between the height of the productions functions are relevant for the equilibrium23
. The following four equations are suficient for solving the model in the
long run:
YI (ai ,a2,H,k,p,A)
=
yi, j=
1, ... , N(fI '_p)l/a
0= l/a'
Y2 (ai ,a2,H,k,p,A)p
gl (ai ,a2,H,k,p,A,a,0)YI (ai ,a2,H,k,p,A)
(16)
p=O, 1- g(al ,a2,H,k,p,A,a,0)
(1- g(al ,a2,H,k,p,A,a,0»al + gl (ai ,a2,H,k,p,A,a,0)Y2(al ,a2,H,k,p,A)a2
-(1-g(a l ,a2,H,k,p,A,a,0»+ gl (al,a2,H,k,p,A,a,0)Y2 (ai ,a2,H,k,p,A) 3'
The first was presented above, with yi being the income per worker of the
country j. In the three remaining equations the index j was omitted for not carrying the
equations. The second equation is a rearrange of the condition of stationary state
(1- g),h
'=
p, using the definition of g (note that (1-ァIセ@'=
p). The third is thecondition of static equilibrium, h=p. The forth24 postulates that the participation of the
capital in the income is 1/3. Obviously, this value could be changed, without changing the solution qualitatively. The values chosen for the parameters are: ai
=
0,4, a2=
0,2and p
=
0,08. The first two were arbitrarily chosen in a way to be possible to mach thecondition that the participation of the capital should be 1/3 and the hypothesis that the productive sector be capital intensive25. There are not empiric informations for the
participation of the capital of the two sectors, but as for the economy as a whole this participation is fixed as 1/3, the chosen values are not absolutely arbitrary. The third represent the rate of time preference added to the depreciation of the capital stock.
In this mo dei there are three possible reasons for the diversity of per capita income across economies: the height of the production functions, the qualification of the labor force and the efficiency of the institutional set. Given that we assume diffusion of technology, the natural supposition is to assume that the heights of the production functions do not differ across economies. Firstly we analyze the model aIlowing differences in the technologies. We will make this to study the sensibility ofthe solution of the system of equations to the value of a, because this is an important parameter
without an evident empiric observable. If the main results are not very sensitive to this parameter we will have more confidence on the robustness of the model.
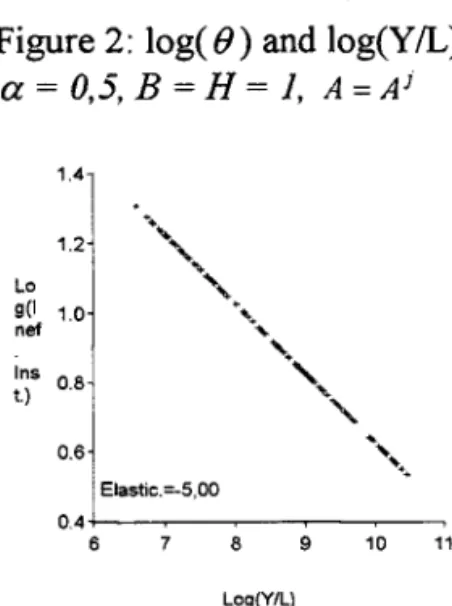
In Figure 2 it is presented the relationship in log among the institutional variable and the per capita income. In this calculations the fourth equation in the system (16) was
22 The aggregated capital is a statistics poorly measured. Which is the relevant concept: machinery,
buildings and other installation? How should be considered the govemment capital and infrastructure in
セ・ョ・イ。ャ_@ Due to this difficulties we decided to treat the capital as a endogenous variable.
_3 A change in the ratio between the height of the production function represents a non-homotetic
displacement of the production factor frontier. Remind that for short run equilibriurn the inclination of the production frontier should be equal to the function h.
24 Tlús equation is necessary due to the non-existence of information on the height of the production
function.
10
employed and it was supposed that all economies share the same qualification of the labor force. The (J elasticity ofper capita income for a ranging trom 0,4 to 0,9 does not
vary although the (J value changes. That is to say, the numeric solutions are in general
dependent on the value chosen for the parameter
a,
but the relationship that the model tries to describe is independent of it.Figure 2: log( (J) and 10g(Y/L), a = 0,5, B = H = 1, A = Ai
1.4]
1.2
Lo
g(1 1.0 nef Ins 08 t.) .
0.6
Elastic.=-5,00
PNTKMセMセMセセMセ@
6 7 8 9 10 11
Log(Y/L)
Then, it is possible to choose a value for the parameter
a,
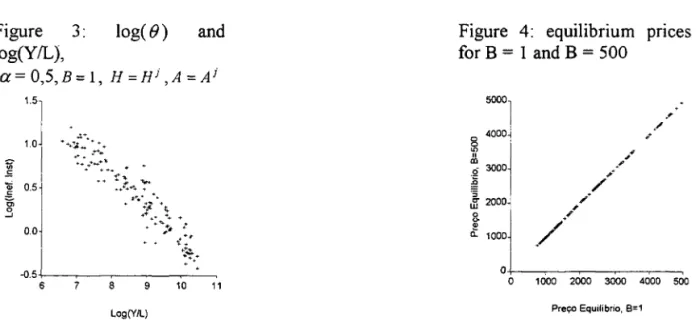
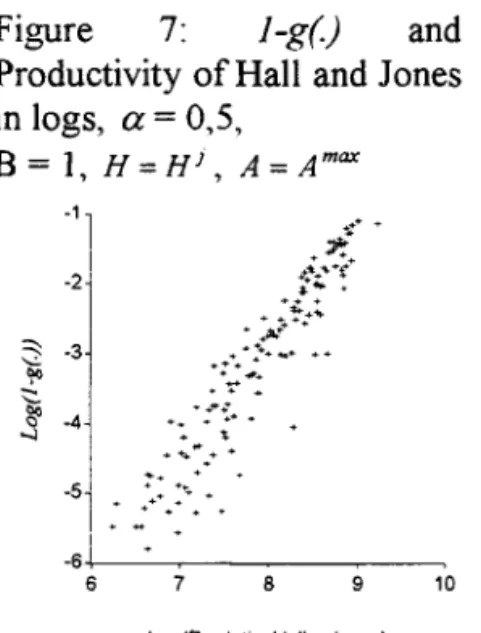
0,5 for example. With this value, the calculations are redone, taking into account differences in human capital (Figures 3). Comparing this with the number 2 (without human capital), it is noticed that the relationship among institutional efficiency and per capita income is maintained. This result evidences the power of the institutional explanation. In this calculation was taken into account that the differences of income could have three sources. The variations in the heights of the production functions, in the endowments of human capital and in the variability of the institutional efficiency parameter, even though this effect captures good part of the per capita income variation in the world. Figure 4 shows that the numerical solution ofthe model is not sensitive to the value of B. For simplicity we take B=l.Figure 3: foge fJ) and
10g(Y/L),
a= 0,5,B= 1, H =Hj,A =Aj
15
1
セ@
101
.E I
セ@ 0.5
g;
...J 0.0
7 8 9 10 11
Log(Y/L)
II
Figure 4: equilibrium pnces for B = 1 and B = 500
5000
o 4000
5l
"
ai
.Q 3000
ª
'5 tll" 2000
8-i!!
a. 1000
1000 2000 3000 4000 soa
Preço Equilíbrio, 8:1
The fourth equation of the system (16), when it imposes that an average pondered
for (J-g) and g' be 1/3, fixes the value of g, for each value of
a,
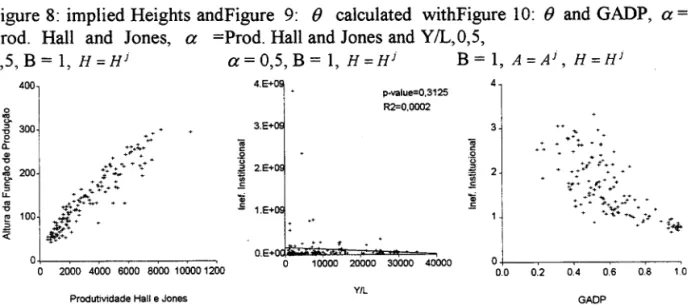
as shown in the Figure5, That is to say, the solution ofthe system with four incognitos imposes that the portion captured by the transfer sector is the sarne for every country. On the other hand, this equation could be eliminated if it is imposed that the relative height of the production function is the same across economies. This procedure is more in agreement with the theoretical posture adopted here, once the technology is accessible to ali economies. Figure 8 shows that the implied heights by the model are highly diverse across economies, and is exactly this that guarantees the constancy of g. A possible procedure, then, is to postulate that the maximum height found is used as the common height to ali countries. We consider this common height as a measure of the technological frontier. It
is shown in the Figure 6 the value of the function g implied for each value of a: g
continues to be decreasing in
a,
but growing with the relative poverty ofthe country (the larger the portion of the productive sector captured by the transfer sector, the poorer is the country).Figure 5: Function g(.) to each
country,
a =
0,4 to 0,9, B=
= 1, A = A) g(.l PNセYQ@ a.,f).4
... -_ .. -.---.---" O.
0.7 =0.5
0.6 a.,f).6 0.5 a--<l.7
-;;;iüf----·----·-·---·----0.4 セセセZZN⦅ZNNMZZZ]ZZZZZZZZN⦅]ZZN⦅セNZZ]ZNNZZN⦅ZZN⦅]ZZN⦅セNZZ]Z@
PNSLセセセセセセセセセ@
20 40 60 80 100 120
Paises
Figure 6: Function g(.) to each
country,
a
= 0,4 to 0,9, B=
H=
1, A = Amax0.2J...1 BBBBRPセGGGGBP@ セVPセXBBGPセQPcGZZBo@ セQセRPZBBB@
Figure 7: l-g(.) and
Productivity ofHall and Jones in logs, a = 0,5,
B = 1, H
=
HJ , A=
Amax-1
1
I-2 '
-6+-1 , MセMMMMセMセ@
6 7 B 9 10
Log{Produtiv Hall e Jones)
12
Hall and Jones (1996) calculated an index of the productivity of the countries. This index consists of an application of Solow decomposition for productivity comparisons among countries. Solow applied its method to estimate the portion of the variation in the income of a country that it is not attributed to the accumulation of factors. He attributed such a variation to differences in productivity. Hall and Jones used the analogy between time and space, and they applied the method for several countries in the same period of time. The portion of the difference of income among countries not explained by differences in the endowment of factors is attributed by the authors as indicative ofthe productivity of each country. In agreement with the logic presented here, this portion of the income that are not explained by endowments of factors could be related to the portion of the income that factors allocated in deleterious activities get to capture. The Figure 7 gives evidence to this fact_ The smaller the success of the transfer effort, that is to say, the larger l-g, the larger the productivity of the country according
the index built by Hall and Jones. The important point of this comparison is that the productivity concept could connote differences among economic agents among countries, and this connotation is contrary to the rationality hypothesis used in this work. Agents are rational and therefore they accomplish totally the possible gains. Nevertheless, such gains are not translated into increases ofper capita income ofthe society, and the result is a not very productive society. The channel ofperformance ofthis effect is trough the allocation of factors in deleterious activities from the social point of view.
Figure 8 presents another evidence of the relationship among the productivity estimated by Hall and Jones and the existence of deleterious activities from the social point of view. It also suggests that should be possible to solve the system (16) substituting the calculated value of the height by the fourth equation. However, as Figure 9 shows, the parameters of institutional efficiency implied by such a solution do not have relationship with the income per worker. Most of the variation of the income is captured by the productivity indexo In other words, the index ofproductivity ofHall and Jones and the variable ofinstitutional efficiency ofthe model capture the same effects.
13
The Figure 1
°
presents the relationship among the implied institutional parameter and an empiric variable used to capture the bureaucratic efficiency ofthe economies. This variable, GADP, is used as an index of institutional efficiency of countries. Its relationship with impliede,
calculated considering difference in the human capital and in the height of the production function (for a =0,5), is evident, but not as strong as itcould be expected.
Figure 8: implied Heights andFigure 9:
e
calculated withFigure 10:e
and GADP, a =Prod. Hall and Jones, a =Prod. Hall and Jones and Y/L,0,5,
0,5,B= 1, H=Hi a=0,5,B= 1, H=Hi B= 1, A=AJ, H=HJ
o 2000 4000 6000 SOOO 10000 1200
Produtividade Hall e Jones
TNeKPセ@ •
iii c
.2 u
.a 2.E+0
:;;
.E
'ai
.E
p·value=0.3125 R2=0.OOO2
... .... t
oNeKoi、[ ̄ZdセAャアッ]イッイ。ッ・Z]]]M]NNNNNL@
o 10000 20000 30000 40000
V/L
4
3
"
.+ .
+ . . _ ....
...
+:l -t ++ + +:+' +++.tI- . . . r;+ ..
'+ .;::..+ ++
+ + . ; : + _ .. ++
++ '1" ... + + +
KKセNL@ +:/
Kセ@
+±:.
0+----1
セL@ セL@ セL@
0.0 Q2 Q4 Q6 QS Qセ@
GADP
.
.
5. Conclusion
Figure 11: Height calculated against productivity estimated by Hall and Jones (1998).
a = 0,5, B = J, H=Hi and.
A
=
Amar10000
ProduIIvIdade Hei e Jones
14
We showed that it is possible to obtain the observed diversity of income in the long run from a neoc1assical model of capital accumulation in presence of unproductive activities.
Our point of view is that the neoclassical revival in growth economics has not gone too fa?6. It is not difficult to accommodate the evidence that the aggregate production
functions have diverse heights with the existence of difference in the institutional set. It is also possible to affirm that the difference is technological. Our option for emphasizing the case in which the technologies are the same and the difference is in the endowment of human capital and in the institutional variable is in accordance with the rationality hypothesis. Why individuaIs with the same preference, qualification and capital would not choose the best technologies? From our point of view this is only possible if from the individual point of view this is not the beast choice. Which leads us to an institutional explanation for the diversity of the technology. This is exactly what we have tried to do with this paper.
Evident1y the institutional variable can change over time. The model could be used to do an exerci se similar to the exerci se done in Chari et alli (1997) to know if it is possible to reproduce the main stylized facts for a panel of economies. That is, we could impose a stochastic process generating the institutional variable and we could derive the trajectories of several economies, calibrated initially to reproduce the pattem observed for a date base27. Other exercise would be investigate which are the model implication for the
differential of income among two economies along very long periods, when the institutional set for both economies remains constant.
26 Klenow andRodriguez-Clare (1997).
27 Usua11y it is taken 1960, the year tbat Summer and Heston data set is more complete.
.
.
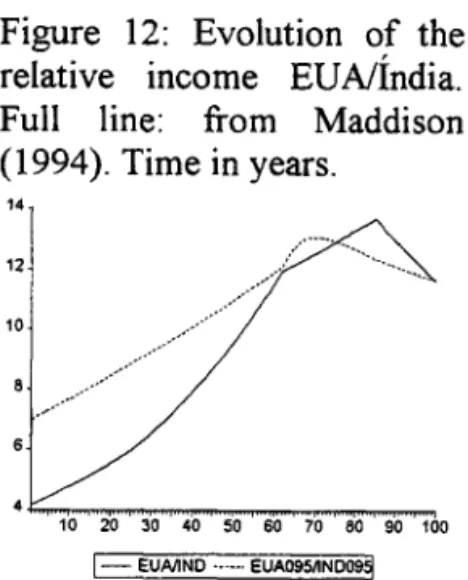
Figure 12: Evolution of the relative income EUNÍndia. Full line: from Maddison (1994). Time in years.
14
12
10
. ., ... . .... ...
10 20 30 40 50 60 70 80 90 100
1-EUAIIND ' •.••. EUA095J1ND09ª
15
Figure 12 presents the evolution of the relative income India/EU A calculated by Maddison (1994) and the one obtained by the model. We assumed that the labor productivity in the USA increases in a way that the per capita product in the USA has been grown at the observed rate and that there was in India the same variation in the productivity per worker observed in the USA28. This analysis is exploratory. Because the
institutional set in most countries should have been aItering during such long periods of time. The point is that this mo dei can produce, for certain horizon of time, the divergence observed in relative income for very Iong periods29.
Appendix
The production functions are represented by equations (1) in the text and it is assumed fulI employment of the factors:
LI +L2 =L,
KI+K2=K.
In per capita terms, equations (AI) are:
11
+
12=
1,l;
=
L;/ L,(AI)
/ / (A2)
Ilkl +/2k2
=
k, k;=
K; Li' k=
K L, i=
1,2.The per capita products of each sector will be:
. k-k
Yi =IJi(ki )=(-I)' J
h
(k;), i,}=1,2, i*}. (A3)k2 -kl
Let PI and P2 be the prices of the products of each sector. The conditions for profit
maximization for such remuneration of factors are (assuming perfect factor mobility across sectors):
28 In this exercise we suppose that a = 0,95.
.
•"
16
(A4)
where r and w are the remuneration of the services of the capital and of the labor respectively. Totally differentiating the equations (A4), we get:
k '= dkl _ f2 k '= dk2 _ J; ] - dp - J;"(k2 -k])' 2 - dp - p 2f2" (k
2 -k])'
P2 p=-.
p] (AS)
And it follows that the sector factor intensity just depends on the relative price p. From the conditions offull employment offactors (A2), it is shown that:
ai
=
(_I)i Ilkl'+12k2 '= (_
i+] p21d2f2 "+121.1.
"
cp
k]-k2 1) p2f. "f2 "(k2 _k])2' (A6) where the second equality comes from the substitution of (AS). From (A3), and using (AS) and (A6), follows that the price-effect in the offers are:Y
=
0'1=
I .( 'k '+.( a]=
p3
1]f22 f/+12J;2
1."
<o
11
éP
]J]] J]éP
p2J.."fz"(k2 _k])2 '
A,
a
'lj2j" -11.('1.("=':::!..2.=lj'k'+j-2.=-p-·] 2 2+P 2J]-J] >0
Y2]
éP
2 2 2 2éP
p2J;"f2"(k2 _k])2
(A7)
and the effects ofthe capital accumulation are:
0'i (I)i /; > O k > k ' ... 1 2
Yi2 = - = - < ' i < 1,1 セ@ J,I,J = , .
ã k2 -k] (A8)
From the equations (A3), the offers just depend on k and kp and, that for its time just depends on p. Therefore, the offer side of the model could be consolidated by
Yi
=
Yi(p,k), whose partial signs ofthe derived are determined by (A7) and (A.8). From(A 7), it is gotten that:
Yll
+
PY21=
O, (A9)which implicit define the inclination of the production possibility frontier, whose inclination in the plan (Yl x Y2) is, then, -p. From (A8), the return ofan unit ofper capita
capital in the economy is given by:
fI - Pf2 ,.(, .( ,
YI2 +PY22
=
k -k =PJ2 =J] , (AIO)] 2
where (A4) have been used.
It can be shown that FPP is concave in the plan (Yl x Y2)' and that the curve
crosses the axes ofthe ordinates and abcissas with positive values for p. In particular, we defined
!!..
as the first sector specialization price, andp
the second sector specialization price. If p>P
(p<!!..) the totality of the production factors are allocated in the second (first) sector ..
•
17
References
Baumol, William 1. (1990). "Entrepeneurship: Productive, Unproductive and Destructive". Journal ofPolítical Economy, v. 98, nO 5, part 1.
Benhabib, Jess e Spiegel, Mark (1994). "The Role ofHuman Capital in Economic Development: Evidence trom Aggregate Cross-Country and Regional U.S. Data".
Journal of Monetary Economics, October.
Chari, V.
v.,
Kehoe, P. 1. e McGrattan, E. R. (1997). "The poverty of nations: a quantitative investigation", Federal Reserve Bank ofMinneapolis, Reseaech Department Staff Report 204.Faoro, Raymundo (1976). Os Donos do Poder: Formação do Patronato Político Brasileiro, Ed. Globo, Porto Alegre.
Hall, Robert e Jones, Charles, (1998). "Why do some countries produce so much more output per worker than others?", NBER Woking Paper, 6564, Maio.
Jones, E. L. (1988). Growth Recurring: Economic Change in World History,
Claredon Press, Oxford.
Kemp, Murray (1969). The Pure Theory of International Trade and Investment,
Prentice Hall.
Klenow, Peter e Rodriguez-Clare, Andrés (1997). "The Neoc1assical Revival in Growth Economics: Has It Gone toa Far?". NBER: Macroeconomics Annual.
Lucas, Robert E. Jr. (1990). "Why Doesn't Capital Flow trom Rich to Poor Countries". American Economic Review, v. 80.
Maddison, Angus (1994). "Explaining the Economic Performance of Nations, 1820-1989" in Baumol, W., Nelson, R. e Wolff, E. Convergence of Productivity, Oxford
University Press, Nova York.
Mankiw, Gregory (1995). "The Growth of Nations". Brookings Papers on Economic Activity. nO 1.
Mankiw, N. Gregory, Romer, David e Weil, David N. (1992). "A Contribution to the Empirics ofEconomic Growth". Quarterly Journal of Economics, v. 107, n° 2.
North, Douglass C. (1981). Structure and Change in Economic History, W. W.
Norton & Company, Nova Y ork.
North, Douglass C. (1990). Institutions, Institutional Change and Economic Performance, Cambridge University Press, Cambridge.
Olson, Mancur (1996). "Big Bills Left on the Sidewalk: Why Some Nations are Rich, and Others Poor". Journal ofEconomic Perspectives, v. 10, n° 2.
Samuelson, Paul (1947). Foundations of Economic Analysis, Harvard University
Press.
Wong, Kar-yiu (1995). International Trade in Goods and Factor Mobility, MIT
MセMMMセセM NセMMMMN@
•
N.Cham. P/EPGE SPE P475n
Autor: Pessoa, Samuel de Abreu.
Título: A neoclassical model of capital accumulation in
089051
1111111111111111111111111111111111111111 52050
FGV - BMHS N° PaI.: F2412/99
000089051