www.atmos-chem-phys.net/17/645/2017/ doi:10.5194/acp-17-645-2017
© Author(s) 2017. CC Attribution 3.0 License.
OH reactivity at a rural site (Wangdu) in the North China Plain:
contributions from OH reactants and experimental OH budget
Hendrik Fuchs1, Zhaofeng Tan2, Keding Lu2, Birger Bohn1, Sebastian Broch1, Steven S. Brown3, Huabin Dong2, Sebastian Gomm1,a, Rolf Häseler1, Lingyan He4, Andreas Hofzumahaus1, Frank Holland1, Xin Li1,b, Ying Liu2, Sihua Lu2, Kyung-Eun Min3,5,c, Franz Rohrer1, Min Shao2, Baolin Wang2, Ming Wang6, Yusheng Wu2, Limin Zeng2, Yinson Zhang2, Andreas Wahner1, and Yuanhang Zhang2,7
1Institute of Energy and Climate Research, IEK-8: Troposphere, Forschungszentrum Jülich GmbH, Jülich, Germany 2College of Environmental Sciences and Engineering, Peking University, Beijing, China
3Chemical Sciences Division, Earth System Research Laboratory, National Oceanic and Atmospheric Administration,
Boulder, CO, USA
4Key Laboratory for Urban Habitat Environmental Science and Technology, School of Environment and Energy,
Peking University Shenzhen Graduate School, Shenzhen, China
5Cooperative Institute for Research in Environmental Sciences, University of Colorado, Boulder, CO, USA 6School of Environmental Sciences and Engineering, Nanjing University of Information Science and Technology,
Nanjing, China
7CAS Center for Excellence in Regional Atmospheric Environment, Chinese Academy of Science, Xiamen, China anow at: d-fine GmbH, Opernplatz 2, 60313 Frankfurt, Germany
bnow at: College of Environmental Sciences and Engineering, Peking University, Beijing, China
cnow at: School of Environmental Science and Engineering, Gwangju Institute of Science and Technology, Gwangju, Korea
Correspondence to:Hendrik Fuchs ([email protected]) and Yuanhang Zhang ([email protected]) Received: 9 August 2016 – Published in Atmos. Chem. Phys. Discuss.: 10 August 2016
Revised: 24 November 2016 – Accepted: 6 December 2016 – Published: 13 January 2017
Abstract. In 2014, a large, comprehensive field campaign was conducted in the densely populated North China Plain. The measurement site was located in a botanic garden close to the small town Wangdu, without major industry but in-fluenced by regional transportation of air pollution. The loss rate coefficient of atmospheric hydroxyl radicals (OH) was quantified by direct measurements of the OH reactivity. Val-ues ranged between 10 and 20 s−1for most of the daytime. Highest values were reached in the late night with maxi-mum values of around 40 s−1. OH reactants mainly orig-inated from anthropogenic activities as indicated (1) by a good correlation between measured OH reactivity and car-bon monoxide (linear correlation coefficientR2=0.33) and (2) by a high contribution of nitrogen oxide species to the OH reactivity (up to 30 % in the morning). Total OH reactiv-ity was measured by a laser flash photolysis–laser-induced fluorescence instrument (LP-LIF). Measured values can be explained well by measured trace gas concentrations
1 Introduction
Hydroxyl radicals (OH) are the most important oxidizing agent for inorganic and organic pollutants in the atmosphere (Ehhalt, 1999). A large number of field campaigns have been conducted in the past to improve our understanding of radical chemistry in the atmosphere at various locations all over the world (Rohrer et al., 2014). However, only few have taken place in China, where air pollution is still a severe problem (Lu et al., 2010). Measurements during field campaigns in the Pearl River delta (PRD) and at a suburban location south of Beijing (Yufa) revealed a lack of understanding of radi-cal chemistry by state-of-the-art chemiradi-cal models, pointing to unknown OH radical sources (Hofzumahaus et al., 2009; Lu et al., 2012, 2013). Similar results were found at other locations, which were mainly dominated by biogenic emis-sions (Rohrer et al., 2014).
In summer 2014, the effort to improve our knowledge of radical chemistry in Chinese megacity areas was contin-ued by a comprehensive field campaign at a location close to the city Wangdu in the North China Plain southwest of Beijing (Tan et al., 2017). A large set of instruments was deployed to detect radicals (OH, HO2, RO2), reactive trace
gases (e.g., CO, NOx, volatile organic compounds (VOCs)) and aerosol properties. Compared to our previous field cam-paigns in China in 2006 (Hofzumahaus et al., 2009), the quality and number of measurements have been improved. A large number of instruments measured a variety of different trace gases, part of which were simultaneously detected by several instruments. Specifically, measurements of organic oxygenated compounds such as formaldehyde and acetalde-hyde were achieved, which was not the case in previous cam-paigns. Radical measurements were improved by performing additional tests of potential interferences in the detection of OH, and a modified detection scheme for HO2that avoids
in-terference from RO2was applied (Fuchs et al., 2011). Time
series of radical measurements and a comparison with results from a chemical box model calculation are discussed in our accompanying paper by Tan et al. (2017).
OH reactivity (kOH) is the pseudo first-order loss rate
co-efficient of OH radicals and represents the inverse chemical lifetime of OH.
kOH= X
i
kOH+Xi[Xi] (1)
Xi represents any OH reactant. Because of the large num-ber of OH reactants in the atmosphere, it is of high value for the interpretation of radical chemistry to compare the direct measurement ofkOH with reactivities calculated from
mea-sured atmospheric OH reactant concentrations. The differ-ence in measured and calculated reactivity is often referred to as missing reactivity.
Depending on the instrumentation that was available in field campaigns in the past, up to more than 70 % of the measured reactivity was found to remain unexplained in
different types of environments (e.g., cities, forests) (Yang et al., 2016). For our previous field campaigns in China, the measured OH reactivity was 2 times larger than the calcu-latedkOH. The discrepancy could be quantitatively explained
by the reactivity from oxygenated VOCs (OVOCs), which were not measured but estimated by a chemical model (Lou et al., 2010; Lu et al., 2013). In this campaign, the number of measured species was extended and included important atmospheric OVOCs, for example formaldehyde, acetalde-hyde, isoprene oxidation products (methyl-vinyl ketone and methacrolein) and glyoxal.
Measurements of OH reactivity and OH concentrations can be combined to calculate the loss rate of OH radicals. This can then be compared to the sum of OH production rates from ozone and nitrous acid photolysis and the reaction of hydroperoxy radicals with nitric oxide and ozone as well as ozonolysis reactions of alkenes. All quantities that are re-quired to do this calculation were measured in this campaign. This allows for a model-independent analysis of the chemi-cal OH budget. This approach was successfully applied to quantify unaccounted OH production in our field campaigns in China in 2006 (Hofzumahaus et al., 2009).
In the following, we describe the technique for OH re-activity measurements applied in the campaign in Wangdu, discuss the time series of measurements, compare OH reac-tivity measurements with calculations from single reactant measurements and analyze the OH budget.
2 Experimental setup
The instruments, their setup at the field site and the measure-ment conditions are described in Tan et al. (2017). Therefore, only a brief description is given here.
2.1 Measurement site
Measurements took place inside a botanic garden close to the small town Wangdu in China between 7 June and 8 July 2014. Wangdu is located in the densely populated North China Plain but does not have major industry itself. Major cities are located mainly in the sector northeast to southwest of Wangdu, whereas there is a mountainous area with less industry northwest of Wangdu. The closest large city is Baoding, 35 km northeast of Wangdu. The measure-ment site had a distance of 2 km from a road with only local traffic. The botanic garden was surrounded by agricultural fields. Trace gases from local biogenic emissions of trees, bushes and from farming can be expected.
Instruments were housed in seven shipping containers, which were partly stacked up so that inlets of instruments were at a height of 7 m above the ground.
2.2 Instrumentation
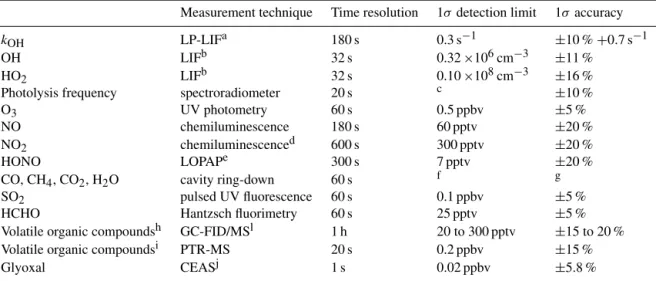
A large number of instruments characterized meteorological conditions, trace gas concentrations and aerosol properties. The measurements used for the OH reactivity analysis are listed in Table 1.
OH and HO2radical concentrations were measured by a
newly built instrument of Peking University (PKU) apply-ing laser-induced fluorescence (PKU-LIF) (Tan et al., 2017). This instrument detects OH fluorescence by time-delayed single photon counting after excitation by short laser pulses at 308 nm in a low-pressure cell (Holland et al., 2003; Fuchs et al., 2011). HO2 radicals are detected as the sum of OH
and HO2(=HOx) after chemical conversion to OH in the re-action with nitric oxide (NO). In order to avoid significant simultaneous conversion of organic peroxy radicals (RO2)
(Fuchs et al., 2011), the amount of NO was adjusted to yield an HO2 conversion efficiency of only 6 %. The instrument
sensitivity was calibrated every 3 to 4 days by a custom-built calibration source described in detail in Fuchs et al. (2011).
A commercial cavity ring-down instrument (Picarro model G2401) monitored CO, CH4and H2O concentrations.
Con-centration measurements of ozone by two commercial UV absorption instruments (Environment S.A. model 41M; Thermo Electron model 49i) agreed well within their accu-racies during the campaign. Nitrogen oxides (NO and NO2)
were also detected by several instruments applying chemilu-minescence (Thermo Electron model 42i NO-NO2-NOx an-alyzer and Eco Physics model TR 780) that were equipped with a photolytic converter. Daily calibrations were per-formed using a certified gas standard. The field measure-ments differed on average by 20 %. Measuremeasure-ments of the Thermo Electron instruments appeared to be more precise and are used here (see Tan et al., 2017, for details). Because the reason for the disagreement could not be identified, the 20 % difference adds to the uncertainty in NO measurements here.
Nitrous acid (HONO) concentrations were simultaneously measured by several instruments applying different mea-surement techniques (Tan et al., 2017). Custom-built instru-ments from FZJ (Forschungszentrum Jülich) (Li et al., 2014) and from PKU (Liu et al., 2016) utilized long-path absorp-tion photometry (LOPAP). In addiabsorp-tion, three custom-built in-struments applied cavity-enhanced absorption spectroscopy (CEAS) for the detection of HONO. They were operated by the US National Oceanic and Atmospheric Administra-tion (NOAA) (Min et al., 2016), by the Anhui Institute of Optics and Fine Mechanics (AIOFM), and by the Univer-sity of Shanghai for Science and Technology (USST). A gas and aerosol collector (GAC), which is based on the wet denuder/ion chromatography technique, could also
de-tect HONO (Dong et al., 2012). Only measurements by the two LOPAP instruments and the CEAS by NOAA resulted in good data coverage. The agreement between these instru-ments was diverse. Differences were often less than 30 % but could be as high as a factor of 2 for certain periods (several hours). The reason for the disagreement during these times is not clear. For the purpose of the analysis here, measurements by the LOPAP instrument from Forschungszentrum Jülich are used (Li et al., 2014) because this instrument showed best data coverage and the lowest detection limit. This instrument was calibrated by using a liquid standard as described in Li et al. (2014) every 10 days. The choice of the HONO data set has a rather small impact on the calculated OH reactivity, as well as on the calculated total OH production rate, which was dominated by OH recycling from HO2during the
day-time (see below).
For the analysis of the OH reactivity, measurements of organic trace gases are essential. In total, 59 organic species (C2-C11alkanes, C2-C6alkenes, C6-C10aromatics
and isoprene) were detected by a custom-built gas-chromatography system equipped with a flame ionization detector (FID) (Wang et al., 2014). Full calibrations us-ing certified gas standards (Air Environmental Inc., Spec-tra Gases Inc.) were done before and after the campaign. Drifts of the sensitivity during the campaign were ac-counted for by measuring the instrument sensitivity for bro-mochloromethane, 1,4-difluorobenzene, chlorobenzene and 1-bromo-3-fluorobenzene every second day. Formaldehyde (HCHO) was detected by a commercial Hantzsch moni-tor (Aerolaser model AL4021) and glyoxal (CHOCHO) by a custom-built cavity-enhanced spectrometer (Min et al., 2016). In addition, acetaldehyde and the sum of methyl vinyl ketone (MVK) and methacrolein (MACR) were mea-sured by a commercial proton transfer reaction–mass spec-trometry system (PTR-MS, Ionicon). Some of the species or family species were simultaneously detected by the gas-chromatography (GC) system and the PTR-MS (isoprene, benzene, toluene, styrene, C8-aromatics, C9-aromatics).
Measurements during the daytime agreed well within 30 to 50 % (Tan et al., 2017). Calibration of the PTR-MS instru-ment was done every day using a certified gas standard (Air Environmental Inc.).
Photolysis frequencies were calculated from the spectral actinic photon flux density measured by a spectrometer that was calibrated against absolute irradiance standards (Bohn et al., 2008).
2.3 OH reactivity measurements
appli-Table 1.Instruments deployed in the campaign and used for data analysis.
Measurement technique Time resolution 1σdetection limit 1σaccuracy
kOH LP-LIFa 180 s 0.3 s−1 ±10 %+0.7 s−1
OH LIFb 32 s 0.32×106cm−3 ±11 %
HO2 LIFb 32 s 0.10×108cm−3 ±16 %
Photolysis frequency spectroradiometer 20 s c ±10 %
O3 UV photometry 60 s 0.5 ppbv ±5 %
NO chemiluminescence 180 s 60 pptv ±20 %
NO2 chemiluminescenced 600 s 300 pptv ±20 %
HONO LOPAPe 300 s 7 pptv ±20 %
CO, CH4, CO2, H2O cavity ring-down 60 s f g
SO2 pulsed UV fluorescence 60 s 0.1 ppbv ±5 %
HCHO Hantzsch fluorimetry 60 s 25 pptv ±5 %
Volatile organic compoundsh GC-FID/MSl 1 h 20 to 300 pptv ±15 to 20 %
Volatile organic compoundsi PTR-MS 20 s 0.2 ppbv ±15 %
Glyoxal CEASj 1 s 0.02 ppbv ±5.8 %
aLaser photolysis–laser-induced fluorescence.bLaser-induced fluorescence.cProcess specific, 5 orders of magnitudes lower than maximum in noon time. dPhotolytical conversion to NO before detection, home-built converter.eLong-path absorption photometry.fSpecies specific, for CO: 1 ppbv;
CH4:1 ppbv; CO2: 25 ppbv; H2O: 0.1 % (absolute water vapor content).gSpecies specific, for CO: 1 ppbv; CH4:±1 ppbv; CO2:±25 ppbv; H2O:±5%. hVOCs including C
2-C11alkanes, C2-C6alkenes, C6-C10aromatics.iOVOCs including acetaldehyde, methyl-vinyl ketone and methacrolein. jCavity-enhanced absorption spectroscopy.
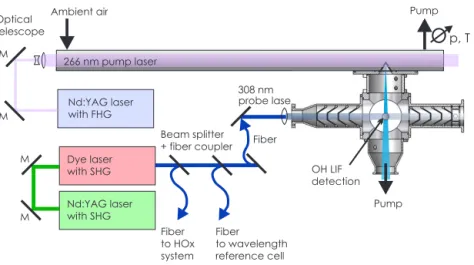
cation by Sadanaga et al. (2004) and is applied today by several other groups (Lou et al., 2010; Parker et al., 2011; Stone et al., 2016). The instrument deployed in this cam-paign is similar to the instrument described in Lou et al. (2010), which was used for measurements in our two field campaigns in 2006 in China. Since then, a second instrument has been built specifically for the deployment on a Zeppelin NT airship (Li et al., 2014), but it can also be operated on the ground. This instrument was deployed. Figure 1 gives a schematic representation of the instrument without the pump (Edwards model XDS35i) needed for the operation of the low-pressure LIF cell and without the laser that provides the 308 nm radiation for the excitation of OH. The 308 nm radi-ation is delivered by the dye laser system that is also used in the instrument for the OH HO2and RO2concentration
mea-surements described in Tan et al. (2017). This laser has three output fibers to provide laser light, one of which is used for the OH reactivity instrument.
The kOH instrument is mounted in a 19′′ rack that was
placed inside one of the upper shipping containers at the field site. The inlet line (outer diameter 10 mm, length approxi-mately 6 m) was made of stainless steel that had a SilcoNert 2000 coating. Such a sampling line has been used for OH reactivity measurements in the Jülich atmosphere simulation chamber SAPHIR for many years without notable effects on measurements. Approximately 20 L min−1of ambient air is sampled through a flow tube made of anodized aluminium (length: 60 cm; inner diameter: 4 cm). Downstream of the flow tube, the flow rate is measured by a flowmeter and con-trolled by a blower.
The pressure inside the flow tube is 1 atm, and the temper-ature was the same as in the field container (between 22 and 30◦C). Ambient temperature was higher with up to 38◦C for some periods during the campaign. Differences in tempera-ture and pressure potentially effect the measured reactivity due to changes in the reactant concentrations and in reaction rate constants (Lou et al., 2010). Measured reactivities were corrected for changes in the reactant concentration calculated from measured ambient and flow-tube temperature and pres-sure values (corrections were less than 2 %). Sensitivity stud-ies taking either ambient temperature or flow-tube tempera-ture for the calculation of OH reactivity from measured OH reactant concentrations (see below) indicate that the effect of temperature differences on reaction rate constants resulted in changes in the OH reactivity of typically less than 1 % (max-imum values 4 %) for conditions of this campaign.
High OH concentrations on the order of 109cm−3are pro-duced by flash photolysis of O3at 266 nm, with a subsequent
reaction of O1D with water vapor. The 266 nm laser pulses (pulse energy 20 to 28 mJ, repetition rate 1 Hz, pulse dura-tion less than 10 ns) are provided by a compact, frequency quadrupled Nd:YAG laser (Quantel model Ultra 100). The laser is mounted on one side of an optical rail, on which the flow tube is mounted on the opposite side. The laser beam is widened by an optical telescope to a diameter of 3 cm and guided to the flow tube by two turning mirrors.
probe laser
OH LIF detection
Pump Nd:YAG laser
with FHG Optical
telescope p, T
Nd:YAG laser with SHG Dye laser with SHG
Fiber to HOx system
Fiber to wavelength reference cell
Fiber Beam splitter
+ fiber coupler
M M M
M 266 nm pump laser
Ambient air
308 nm
Pump
Figure 1.Schematics of the Jülich OH reactivity instrument (M: turning mirror). Ambient air is sampled into a flow tube. A small part of the air is drawn into the OH detection cell that is operated at a pressure of 4 hPa. High OH concentrations are produced by flash photolysis of ozone at 266 nm at a low frequency of 1 to 2 Hz. The OH concentration is probed at a high frequency of 8.5 kHz so that the loss of OH radicals due to their reaction with OH reactants in the ambient air can be observed.
with nitric oxide and by deposition processes. Therefore, a small flow of synthetic air (0.2 L min−1) that has passed an ozonizer (glass tube of fused silica with a mercury lamp pro-viding 185 nm radiation) can be added in order to increase ozone mixing ratios in the flow tube by 40–50 ppbv. The in-jection is controlled by a solenoid valve which is automati-cally opened if the ozone mixing ratio in ambient air drops below 30 ppbv.
At a distance of 48 cm from the inlet of the flow tube, 1 L min−1of the total flow is sampled from the center of the flow tube through a conical nozzle into the OH detection cell. The design of the OH fluorescence cell is the same as used for OH concentration measurements (Tan et al., 2017).
In the cell, OH is excited by 308 nm radiation from a tunable frequency-doubled dye laser, which is operated at a pulse repetition rate of 8.5 kHz. The OH fluorescence is detected by gated photon counting and accumulated in time bins of 0.6 ms. This way, the chemical decay of OH in the flow tube is recorded for 1 s after the photolysis laser pulse. For photon detection, a gated multichannel photomultiplier (Photek, PM325) is used in combination with a multichannel counting card (Sigma Space, AMCS).
In order to achieve sufficiently precise reactivity ments, 60 decay curves are taken for one reactivity measure-ment resulting in an amplitude of 50 to 100 counts of the decay curve. Because of the scanning of the laser over the ab-sorption line of OH in order to track slow drifts in the wave-length of laser, the amplitude of the decay curve changes pe-riodically. Therefore, 10 OH decay curves are summed up to equalize the amplitude. Six of the summed curves are then averaged to determine realistic error estimates needed for the fit procedure. A weighted single-exponential fit (Levenberg– Marquardt minimization) is then applied to derive the OH reactivity (Eq. 1). Approximately the first 30 to 50 ms of the
decay curve are not included in the fit because these points deviate from the single-exponential behavior that is observed at later times. The fit is started if the count rate has decreased to the 90 % level of the maximum count rate. The likely rea-son for an inhomogeneous initial OH distribution is that the spatial OH distribution is not perfectly homogeneous near the inlet nozzle of the OH detection cell right after the laser pulse due to inhomogeneities in the laser power across the laser beam.
Diffusion to the wall of the flow tube, where OH is lost by wall reactions, causes loss of OH even in the absence of OH reactant. This zero loss rate is regularly measured in humidi-fied air (purity 99.999 %). Typical zero loss rates measured in laboratory characterization measurements are around 3 s−1 for this instrument. A slightly higher value of 3.8 s−1 was derived in measurements sampling synthetic air from a gas cylinder during the campaign. Analysis of the synthetic air in this gas cylinder by gas chromatography yielded contam-inations with an OH reactivity of 0.7 s−1. Therefore, an in-strumental zero decay value of 3.1 s−1was subtracted from ambient OH reactivity measurements consistent with previ-ous values for this instrument. The reactivity measured in the synthetic air is considered a potential systematic error of the OH reactivity measurements in this campaign. The accuracy of our LP-LIF technique has been tested with CO and CH4
mixtures in synthetic air. MeasuredkOH agreed better than
10 % with the expected, calculated OH reactivity for values up to 60 s−1, in agreement with previous studies by Lou et al. (2010). At higherkOHvalues, the initial non-exponential part
of the OH decay curve starts to influence the quality of the fitted OH decay curve, but such high kOH values were not
encountered in the campaign at Wangdu (Fig. 2).
kOH /s
-1 Meas.
Calc. Rate/ppbv/h CO/ppmv ! NO 2 /ppbv Isoprene/ppbv Aldehyde/ppbv ( ( Time (local) (
Acetontrile/ppbv PM2.5/ μ g m
-3 Acetonitr + kOH /s -1 Rate/ppbv/h CO/ppmv ! NO 2 /ppbv Isoprene/ppbv Aldehyde/ppbv ( ! ! ! (! Time (local) ( Acetontrile/ppbv
Figure 2.Time series of measured and calculated OH reactivity. In addition, time series of the OH destruction rate (DOH) calculated from
measured OH concentrations and OH reactivity is shown together with the sum of measured OH production rates (POH) from O3and HONO
photolysis and reactions of HO2with NO and O3. Lower panels give time series of important trace gas measurements contributing to the OH
reactivity. Gray areas indicate nighttime.
reactivity because OH that would be artificially produced inside the measurement cell would only increase the back-ground signal but not the decay time as long as it do not change on the timescale of the OH decay measurement (1 s).
holds for the known interference from ozone photolysis by the 308 nm laser radiation but also for other potential inter-ferences that have been reported for OH concentration mea-surements (Mao et al., 2012; Novelli et al., 2014) and which could not be fully excluded for this campaign (Tan et al., 2017).
If ambient NO concentrations are high enough to lead to a significant regeneration of OH from secondarily formed HO2, the shape of the decay curve changes to a
bi-exponential behavior. This can be derived from reaction ki-netics. The faster decay time represents approximately the OH reactivity for certain chemical conditions. As shown in Lou et al. (2010), no significant effects are expected for NO mixing ratios of up to 20 ppbv for realistic OH reactant mix-tures in our instrument. During the campaign in Wangdu, NO mixing ratios were generally well below 20 ppbv. No bi-exponential behavior was observed that would have been seen in the residuum of the fit. NO mixing ratios exceeded 20 ppbv only for some short periods mainly during the night-time on 3 days, but measurements still appeared as single-exponential decays in these cases.
3 Results and discussion 3.1 Time series of OH reactivity
Measured OH reactivity values ranged between 10 and 20 s−1during this campaign for most of the time (Fig. 2). In general, values were lower during the daytime (median value 12.4 s−1) than at night (median value 15.4 s−1). During the first 2 weeks, midday OH reactivity increased from 10 s−1on 8 June to values higher than 20 s−1between 15 and 19 June. After 19 June, OH reactivity was generally lower and more uniform till the end of the campaign.
Maximum values were observed during the nighttime and the early morning hours, when OH reactivities show spikes with values of up to 60 s−1for short periods of less than 1 h. The high-reactivity values were probably caused by emis-sions into the shallow nocturnal boundary layer. The short duration indicates that nearby local sources were responsible for these events. This happened more frequently during the first part of the campaign and only few spikes were observed after 19 June.
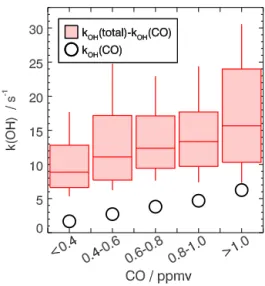
The overall changes in OH reactivity values from day to day were likely dominated by anthropogenic activities dur-ing this campaign. The measured OH reactivities show an increasing trend with CO, which cannot be explained by the reactivity of CO alone (Fig. 3). Therefore, other reactants that were co-emitted with CO, for example in combustion pro-cesses, most likely contributed to the increase in reactivity. The correlation still holds if only reactivity from measured OH reactants other than CO, NOxand isoprene is taken into account. This further supports that also OH reactivity from organic compounds is co-emitted with CO.
Figure 3.Correlation between OH reactivity excluding CO and CO mixing ratios. Red boxes give 25 and 75 percentiles, and whiskers give 10 and 90 percentiles of thekOH distribution. Black circles
show median values of OH reactivity that is caused by CO.
Back-trajectories were calculated for this campaign us-ing the NOAA (Nation Oceanic and Atmospheric Admin-istration) HYSPLIT (Hybrid Single Particle Lagrangian In-tegrated Trajectory Model) model (Stein et al., 2015) in or-der to test if measured OH reactivities are correlated with the origin of advected air masses. Twenty-four hour back-trajectories were calculated for air masses at the measure-ment site for each hour. During most days, back-trajectories were very similar. Therefore, trajectories between 10:00 and 19:00 LT were averaged (Fig. 4). The majority of back-trajectories point to locations south of Wangdu and less often to locations east or north of the measurement site. Moun-tains that are west and north of the measurements site appear as barriers for air masses. Only on 3 days (8, 27, 28 June) back-trajectories indicate that air masses originated from lo-cations in the mountains. LowestkOHvalues (<10 s−1) were
observed in these cases due to less emissions from industry and from other anthropogenic activities. In contrast, there is dense population east and south of the measurements site. This likely explains why OH reactivity values were highest if air masses were coming from this area. Also, the relation betweenkOHand CO is consistent with the assumption that
OH reactivity was dominated by anthropogenic activities in this case.
The increase in OH reactivity during the first 2 weeks could be related to a change in the origin of air masses from the north (8 June) to the east (13 June) and finally to the south (15 June). However, no obvious difference between trajectories is seen before and after 20 June so that back-trajectories are not sufficient to explain why measured OH reactivity would be higher and spikier before 20 June.
combus-t
−1
<10 s 10−15 s 15−20 s−1 >20 s
−1 <10 s 10−15 s 15−20 s−1 >20 s
-1
<10 s -1
10–15 s-1
15–20 s-1
>20 s
Figure 4.NOAA HYSPLIT 24 h back-trajectories during the cam-paign calculated as averages of hourly back-trajectories between 10:00 and 19:00 local time. Colors of trajectories indicate the OH reactivity level measured at the field site in Wangdu. Black numbers indicate the date in June, dark blue numbers the date in July.
tion of straw and crop residuals on nearby agricultural fields in the first 2 weeks of June. On 13 June, for example, crop was harvested on the field directly next to the measurement place. Indicators of biomass burning activities were visually observed fires, reduced visibility and an increase in measured particle number concentrations. Typical daytime maximum PM2.5concentrations ranged between 30 and 90 µg m−3but
were as high as 300 µg m−3on one day due to local biomass burning (Fig. 2). No clear connection between OH reactivity and aerosol number concentration was observed. Although a sharp drop in PM2.5was observed on 19 June when OH
re-activity also dropped, PM2.5increased again to higher values
till the end of the campaign. Elevated concentrations of ace-tonitrile (a marker for biomass combustion) were measured between 12 and 19 June (Tan et al., 2017).
3.2 Contributions of OH reactants to the OH reactivity and missing reactivity
OH reactivity measurements are of particular value in order to test if all important OH reactants were detected. Volatile organic compounds (VOCs) and inorganic compounds such as nitrogen oxides (NOx=NO+NO2) and carbon
monox-ide (CO) are typically major contributors to the total OH re-activity. However, the number of OH reactants, specifically of organic compounds is very large so that a complete mea-surement is not expected. Therefore, comparison of direct
kOH measurements with calculations from measured
reac-tants can reveal to which extent unmeasured reactive
com-pounds contributed to total OH reactivity. This presents a gap in the constraints of model calculations used to test our knowledge of radical chemistry (Tan et al., 2017). In addi-tion, VOCs and NOxare key species for understanding ozone and particle formation so that an incomplete knowledge of OH reactivity would lead to a systematic underprediction of ozone production by chemical models (e.g., Whalley et al., 2016; Griffith et al., 2016).
The full time series of the calculatedkOH is plotted
to-gether with the measured total kOH in Fig. 2. The
calcu-lated reactivities were determined from measured CO, CH4,
C2to C11 alkanes, C2 to C6 alkenes, C6 to C10 aromatics,
formaldehyde, glyoxal, acetaldehyde, MVK, MACR, NO, NO2and SO2(Table 1). Reaction rate constants were taken
from IUPAC recommendations (Atkinson et al., 2004, 2006) or the structure–activity relationship (SAR) as stated in the Master Chemical Model (http://mcm.leeds.ac.uk/MCM/).
During each of the two parts of the campaign (before and after 19 June), diurnal profiles of observations appear to be similar. Therefore, measuredkOH and calculated reactivity
from major contributors are shown as median diurnal pro-files with percentiles for each period in Fig. 5. Median di-urnal profiles of all measured contributions are summed up and compared to measuredkOH in Fig. 6. Ambient
temper-ature was used for the calculation of reaction rate constants, but the differences between ambient temperature and the ac-tual temperature in the instrument does not change any of the results shown here.
The most important OH reactants were CO (on average 20 to 25 % of the total OH reactivity), nitrogen oxides (on average 12 to 22 % of the total OH reactivity) and OVOCs (on average 25 % of the total OH reactivity). The reactivity from isoprene makes a substantial contribution (often 20 %) to the totalkOHin the afternoon. Reactivity from alkanes and
alkenes were dominated by small alkenes, mostly ethene and propene.
The median diurnal profile of the total OH reactivity had a maximum late at night. It decreased during the day by nearly 50 % and started to increase after sunset. The accu-mulation of OH reactants during the night could be due to fresh emissions that are released into the shallow nocturnal boundary layer. A similar diurnal profile was also observed for contributions from NOx, alkane and alkene species. Their concentrations are typically connected to emissions from an-thropogenic activities. OH reactivity from NOxwas also the largest contribution tokOH during night and early morning
(20 to 30 %). The diurnal profile of NOxappears as the major driver for the diurnal profile of the entirekOH, whereas nearly
00:00 06:00 12:00 18:00 24:000 1 2 3 4 5 6
00:00 06:00 12:00 18:00 24:000
1 2 3 4 5 6
00:00 06:00 12:00 18:00 24:000
1 2 3 4 5 6 kOH / s -1 07.06.–19.06. CO
00:00 06:00 12:00 18:00 24:000
2 4 6 8 10
00:00 06:00 12:00 18:00 24:000
2 4 6 8 10
00:00 06:00 12:00 18:00 24:000
2 4 6 8 10 kOH / s -1 NOx
00:00 06:00 12:00 18:00 24:000
1 2 3 4 5 6 7
00:00 06:00 12:00 18:00 24:000
1 2 3 4 5 6 7
00:00 06:00 12:00 18:00 24:000
1 2 3 4 5 6 7 kOH / s -1 Isoprene
00:00 06:00 12:00 18:00 24:000
1 2 3 4
00:00 06:00 12:00 18:00 24:000
1 2 3 4
00:00 06:00 12:00 18:00 24:000
1 2 3 4 kOH / s -1 Alkane+alkene
00:00 06:00 12:00 18:00 24:000
1 2 3 4 5 6
00:00 06:00 12:00 18:00 24:000
1 2 3 4 5 6
00:00 06:00 12:00 18:00 24:000
1 2 3 4 5 6 kOH / s -1 OVOC
00:00 06:00 12:00 18:00 24:000
10 20 30 40
00:00 06:00 12:00 18:00 24:000
10 20 30 40
00:00 06:00 12:00 18:00 24:000
10 20 30 40 kOH / s -1 l
00:00 06:00 12:00 18:00 24:00 Time of day 0 10 20 30 40 kOH / s -1
00:00 06:00 12:00 18:00 24:000
1 2 3 4 5 6
00:00 06:00 12:00 18:00 24:000
1 2 3 4 5 6
00:00 06:00 12:00 18:00 24:000
1 2 3 4 5 6 kOH / s -1 20.06.–08.07.
00:00 06:00 12:00 18:00 24:000
2 4 6 8 10
00:00 06:00 12:00 18:00 24:000
2 4 6 8 10
00:00 06:00 12:00 18:00 24:000
2 4 6 8 10 kOH / s -1
00:00 06:00 12:00 18:00 24:000
1 2 3 4 5 6 7
00:00 06:00 12:00 18:00 24:000
1 2 3 4 5 6 7
00:00 06:00 12:00 18:00 24:000
1 2 3 4 5 6 7 kOH / s -1
00:00 06:00 12:00 18:00 24:000
1 2 3 4
00:00 06:00 12:00 18:00 24:000
1 2 3 4
00:00 06:00 12:00 18:00 24:000
1 2 3 4 kOH / s -1
00:00 06:00 12:00 18:00 24:000
1 2 3 4 5 6
00:00 06:00 12:00 18:00 24:000
1 2 3 4 5 6
00:00 06:00 12:00 18:00 24:000
1 2 3 4 5 6 kOH / s -1
00:00 06:00 12:00 18:00 24:000
10 20 30 40
00:00 06:00 12:00 18:00 24:000
10 20 30 40
00:00 06:00 12:00 18:00 24:000
10 20 30 40 kOH / s -1
00:00 06:00 12:00 18:00 24:00 i
T me of day 0 10 20 30 40 kOH / s -1 Calc. Meas. AAll
Figure 5.Median diurnal profiles of reactivity from major measured OH reactants and of the total measured and calculated OH reactivity for the first and second part of the campaign. Data are only included if all major OH reactants and OH reactivity were measured concur-rently. Colored areas give 25 and 75 percentiles. Gray areas indicate nighttime.
only partly oxidized by OH before sunset. The diurnal profile of isoprene partly counteracted the decrease in OH reactivity due to the decrease in NOx, alkane and alkene species.
CO mixing ratios ranged between 300 and 1000 ppbv dur-ing this campaign. Therefore, reactivity from CO always made up a large fraction of the total kOH. The OH
reactiv-ity from CO showed only a weak diurnal variation with a median value of 3 s−1and could therefore be used as an in-dicator of the overall origin of pollutants apart from diurnal
00:000 06:00 12:00 18:00 24:00
5 10 15 20 25
00:00 06:00 12:00 18:00 24:00
Time of day h 0 5 10 15 20 25 kOH / s -1
07.06.–19.06.
00:000 06:00 12:00 18:00 24:00
5 10 15 20 25
00:000 06:00 12:00 18:00 24:00
5 10 15 20 25 kOH / s -1
NOX CO Isoprene Oxygen. VOC Other Unkown react.
Meas. kOH
NOX CO Alkane/alkene OH 20.06.–08.07. -1
Time of day h-1
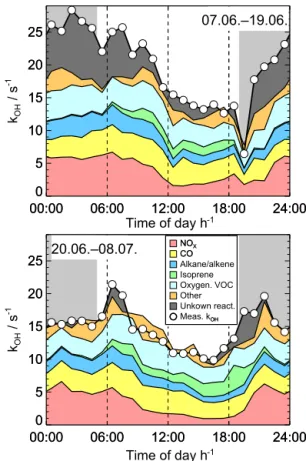
Figure 6.Sum of median diurnal profiles of reactivities from all measured OH reactants compared to the measured OH reactivity for the first and second part of the campaign. Data are only included if all major OH reactants and OH reactivity were measured con-currently. “Other” includes small contributions from measured OH reactants listed in Table 1 (CH4, SO2, aromatics). The dark gray
area indicates missing OH reactivity from unmeasured OH reac-tants. Light gray areas indicate nighttime.
changes. As discussed above, measuredkOHscaled with CO
indicating that co-emitted OH reactants such as alkenes were also important (Fig. 3).
A number of oxygenated volatile organic compounds (OVOCs) were measured in this campaign (Table 1). These included formaldehyde, acetaldehyde, glyoxal, methyl-vinyl ketone and methacrolein. Their reactivity made a large frac-tion of the total reactivity with median values between 2 and 4 s−1over the course of 1 day. The largest contributions to the reactivity from OVOCs (more than 50 %) came from formaldehyde and acetaldehyde (20 to 25 %), while reactiv-ity from other measured OVOCs such as acetone and glyoxal made only small contributions. These species can also orig-inate from primary emissions. The good agreement between measured and calculated OH reactivity nevertheless indicates that these species were the most important organic oxidation products that contributed to the OH reactivity.
0 10 20 30 40 50 60
k
OHcalc. / s
-10
10
20
30
40
50
60
k
OHmeas. / s
-1
1st part night
1st part day
2nd part night
2nd part day
Figure 7.Correlation between calculated and measured OH reactiv-ity with color-coded periods. The linear correlation coefficient (R2) is 0.77 for the entire data set and data from both periods alone.
morning to the evening. This behavior suggests that during the daytime, dilution due to a rising boundary layer height or chemical removal had a stronger influence on the observed OVOCs than fresh production by photochemistry.
Although the general behavior of OH reactivity and OH reactants was similar during the entire campaign, there were distinct differences in the magnitude of total OH reactivity during the first (7 to 19 June) and second half (20 June to 8 July) of the campaign (Fig. 5). Measured OH reactivity was on average lower after 20 June specifically during the second half of the night and early morning, when median val-ues were higher than 25 s−1before 20 June and 16 to 20 s−1 later. Afternoon values were only slightly less after 20 June compared to the first part of the campaign. This is reflected in a decrease in median OH reactant concentrations during the second part of the campaign. It is most prominently seen in median alkene and alkane concentrations during the night-time (Fig. 5). In contrast, isoprene concentrations increased faster in the morning and high afternoon concentrations per-sisted in the evening during the second part of the campaign. Air temperatures were generally a few degrees higher than during the first 2 weeks so that temperature-driven biogenic emissions could have been larger after 20 June. The largest fraction of higher OH reactivity observed in the first part of the campaign remains unexplained by OH reactant measure-ments. However, even during times when measured reactiv-ity was higher than calculations from OH reactants, the gap is within the combined 2σ uncertainties: thekOHcalculated
from OH reactants has a 1σ uncertainty of±10 to±15 %, depending on the relative distributions of reactants, and the measuredkOHhas a maximum 1σuncertainty of±10 % plus +0.7 s−1(Table 1).
The good agreement between measured and calculated OH reactivity is also demonstrated by the high linear correlation coefficient (R2=0.77 for the entire data set and both subsets of data) between both values (Fig. 7). For the second part of the campaign, a linear regression analysis (forced to zero) yields a slope of 1.01. As already discussed, missing reactiv-ity was higher during the first part of the campaign so that a regression analysis yields a higher slope of 1.3.
Largest differences of 5 to 6 s−1(approximately 20 %) be-tween measured and calculated OH reactivity occurred dur-ing the nighttime and early morndur-ing durdur-ing the first 2 weeks of the campaign, when NO concentrations were also high-est. This could indicate that unmeasured OH reactants were co-emitted with nitrogen oxides in combustion processes. Unknown compounds causing the missing reactivity are the main reason for the higher observed OH reactivity in the first 2 weeks. Therefore, there is no clear further indication of the nature of missing reactivity during this period. Emis-sions of organic compounds from biomass burning may have not been detected during the first part of the campaign. Dur-ing the nighttime nearby sources for OH reactants as indi-cated by the short duration of high reactivity could also have contributed to the missing reactivity. In addition, undetected products from the oxidation by the nitrate radical could have been part of missing reactivity in the night.
Exceptionally good agreement is seen at nearly all times after 20 June in the time series as well as in the median diur-nal profile (Figs. 2 and 6). The median value of missing re-activity is only 0.3 s−1. Such good agreement is not expected due to the large number of possible OH reactants in the atmo-sphere (Goldstein and Galbally, 2007). Specifically the num-ber of OVOCs that were measured in this campaign is rather small (see above) and additional reactivity from other oxida-tion products could be expected to contribute to the total OH reactivity.
The good agreement between measured and calculated
kOHindicates that other oxidation products than those
3.3 Comparison with previous field campaigns
In our previous field campaigns in China in 2006 in the Pearl River delta (PRD; Hofzumahaus et al., 2009; Lou et al., 2010; Lu et al., 2012) and Yufa close to Beijing (Lu et al., 2013), OH reactivity was considerably higher, but exhibited a similar diurnal profile. Maximum values were 40 to 50 s−1 in the night and early morning during the PRD and Yufa cam-paigns and reached minimum values of around 20 s−1in the afternoon. Absolute contributions from CO and NOx were comparable with contributions in Wangdu 2014, with slightly higher CO concentrations in Yufa 2006. However, contribu-tions from measured VOC were significantly higher in both previous campaigns compared to the Wangdu campaign in 2014, partly explaining the higher reactivity in these cam-paigns.
In both previous campaigns, measurements of OVOCs were completely missing and the measured OH reactivity was found to be about 2 times larger than the total reactivity of measured CO, NOx and hydrocarbons (Lou et al., 2010). The missing reactivity could be quantitatively explained by OVOCs which were simulated by a model from the photoox-idation of the measured VOCs. The major modeled OVOCs were formaldehyde, acetaldehyde, MVK, MACR and some minor isoprene oxidation products, which together could ex-plain 70 % of the missing reactivity (i.e., about one-third of the total reactivity). In the Wangdu campaign, the cal-culated total OH reactivity was largely in agreement with the measured kOH. This time, formaldehyde, acetaldehyde,
MVK, MACR and glyoxal were directly measured and also accounted for one-third of the total reactivity. These species were also the most important OVOC species in other cam-paigns in anthropogenically dominated environments such as in Beijing (Shao et al., 2009), London (Whalley et al., 2016) and Tokyo (Yoshino et al., 2012). This confirms the high rel-evance of these specific carbonyl compounds as reactants for OH in the polluted boundary layer.
The OH reactivities measured at the Wangdu site in the North China Plain show diurnal profiles that are comparable to those reported for other polluted environments all over the world (see review by Yang et al., 2016). The total reactivi-ties lie within the range of values observed during summer-time at other locations that were mainly influenced by anthro-pogenic emissions, like Nashville (Kovacs et al., 2003), New York (Ren et al., 2003) and Houston (Mao et al., 2010) in the US, Tokyo in Japan (Chatani et al., 2009), Beijing (Williams et al., 2016) in China, Seoul in South Korea (Kim et al., 2016), and London (Whalley et al., 2016) in Great Britain. Also, the shapes of the diurnal profiles were similar, with peak values between 15 and 50 s−1in the early morning and minimum values in the afternoon. Significantly higher morn-ing values of 130 s−1were observed in Mexico City in 2003 (Shirley et al., 2006). Here, as well as in Wangdu and other urban sites, the diurnal shape ofkOHwas strongly determined
by the variation in anthropogenically emitted NOx and co-emitted VOCs.
Care has to be taken if missing reactivity is compared be-tween different campaigns because the number of measured OH reactants used to calculate the reactivity can significantly differ (Lou et al., 2010; Yang et al., 2016, and references therein). For the measurements in Beijing (Williams et al., 2016), approximately 25 % of the measured reactivity re-mained unexplained, although oxygenated organic species were partly measured. Approximately 30 % of the reactiv-ity measured in Nashville could not be explained, even if modeled organic compounds were taken into account. For the other campaigns in anthropogenically influenced areas, mea-sured OH reactivity could be explained by either meamea-sured OH reactants alone (New York, this campaign) or if, in addi-tion, product species from model calculations were included (Yufa, PRD, Tokyo, London).
3.4 Experimental OH budget
OH reactivity measurements can be used not only to quan-tify the possible contribution of unmeasured OH reactants, but they also allow the quantification of the total OH produc-tion rate. Because OH is short-lived, it reaches a steady state within seconds. Thus, the total OH production rate (POH)
equals the total destruction rate (DOH).DOH can be
calcu-lated as the product ofkOHand the OH concentration:
DOH=kOH× [OH]. (2)
This rate can be compared with the sum of production rates (POH) from known OH sources. In this campaign, OH
production from HONO and O3 photolysis, ozonolysis of
alkenes, and radical recycling reactions of HO2with NO and
ozone can be calculated from measurements:
POH=POH(hν+O3)+POH(hν+HONO)+POH(HO2+O3) +POH(HO2+NO)+POH(O3+alkene). (3)
Potentially unknown OH sources can then be determined as the difference between DOH and POH. This was
success-fully applied for data from our previous field campaigns in China (Hofzumahaus et al., 2009), revealing significant un-accounted OH sources, and in chamber studies (Fuchs et al., 2013, 2014; Nehr et al., 2014).
The time series of calculated OH production and destruc-tion rates are plotted in Fig. 2, and median diurnal profiles of quantities that are required for this calculation are shown in Fig. 8. Unfortunately, the data coverage of simultaneous measurements before 20 June (mostly due to missing radical measurements) is not sufficient to allow for an independent analysis of the first part of the campaign as done for the anal-ysis of OH reactants. However, results do not change signifi-cantly, whether the first part is included in the median diurnal profiles that are discussed below or not.
00:00 06:00 12:00 18:00 24:00 Time of day h 0 2 4 6 8 10 12
OH / 10
6cm
-3
OH / 10
6cm
-3
OH / 10
6cm
-3
00:00 06:00 12:00 18:00 24:00 Time of day h 0 5 10 15 20 25 kOH / s -1
00:00 06:00 12:00 18:00 24:000 2 4 6 8 10 12
00:00 06:00 12:00 18:00 24:000 2 4 6 8 10 12
00:00 06:00 12:00 18:00 24:000 2 4 6 8 10 12 HO 2 / 10 8cm -3
00:00 06:00 12:00 18:00 24:000 1
2 3 4
00:00 06:00 12:00 18:00 24:000 1
2 3 4
00:00 06:00 12:00 18:00 24:000 1
2 3 4
NO / ppbv
00:00 06:00 12:00 18:00 24:000 20
40 60 80 100
00:00 06:00 12:00 18:00 24:000 20
40 60 80 100
00:00 06:00 12:00 18:00 24:000 20 40 60 80 100 O3 / ppbv
00:00 06:00 12:00 18:00 24:00 0.0
0.5 1.0 1.5 2.0
00:00 06:00 12:00 18:00 24:00 0.0
0.5 1.0 1.5 2.0
00:00 06:00 12:00 18:00 24:00 0.0
0.5 1.0 1.5 2.0
HONO / ppbv
00:00 06:00 12:00 18:00 24:00 0.0 0.2 0.4 0.6 0.8 1.0 1.2 1.4
00:00 06:00 12:00 18:00 24:00 0.0 0.2 0.4 0.6 0.8 1.0 1.2 1.4
00:00 06:00 12:00 18:00 24:00 0.0 0.2 0.4 0.6 0.8 1.0 1.2 1.4
j(HONO) / 10
-3 s
-1
00:00 06:00 12:00 18:00 24:000 5
10 15 20
00:00 06:00 12:00 18:00 24:000 5
10 15 20
00:00 06:00 12:00 18:00 24:000 5
10 15 20
Rate / ppbv/h
POH
DOH
-1 -1
Time of day h-1 Time of day h-1
Time of day h-1 Time of day h-1
Time of day h-1 Time of day h-1
Figure 8.Median diurnal profiles of trace gas concentrations used for the calculation of the total OH production rate (POH) and
de-struction rate (DOH). Data are only included if all required trace
gas concentrations and OH reactivity were measured concurrently. Colored areas give 25 and 75 percentiles. Gray areas indicate night-time. Note that the selection of data are different for median profiles shown in our accompanying paper by Tan et al. (2017).
an estimate of the accuracy of the calculated difference. The diurnal profile of the OH production rate was mainly driven by solar radiation as expected from the photolytic nature of primary radical production, which also determines the over-all abundance of HO2. During the daytime, the known OH
production was dominated by the recycling reaction of HO2
with NO, reaching a maximum of about 10 ppbv h−1shortly before noon. The relative contribution of primary OH pro-duction by either O3 or HONO photolysis to the total OH
production increased during the day to reach median maxi-mum values of 1.2 and 1.5 ppb h−1, respectively. The ozone photolysis exhibited a strong diurnal profile because both so-lar radiation and ozone concentration had maximum values
00:00 06:00 12:00 18:00 24:00
Time of day h 0 5 10 15 DOH ; P OH / ppbv/h 0 5 10 15 DOH ; P OH / ppbv/h
HO2+NO
HONO+hv
O3+hv
O3+HO2
O3+alkene
k(OH)x[OH]
HO2+NO
HONO+hv
O3+hv
O3+HO2
O3+alkene
k(OH)x[OH] -5 0 5 DOH -P OH / ppb/h -5 0 5
1σ accuracy
+ Add. OH uncert.
-2
Figure 9.Median diurnal profiles of OH production (POH) and
de-struction (DOH) rates. Data are only included if all required trace
gas concentrations and OH reactivity were measured concurrently. Dark gray areas indicate missing OH production. The upper panel gives the 1σ accuracy of the difference (DOH−POH) calculated
from the uncertainties of measurements (Gaussian error propaga-tion). The effect on the accuracy from an upper limit of potential interferences in the OH measurements is shown separately.
at noon and in the early afternoon. An OH production rate from HONO photolysis of 1 to 1.5 ppb h−1persisted into the afternoon due to relatively high HONO concentrations mea-sured throughout the day. The budget of HONO will be dis-cussed in a separate paper, but it is clear that HONO produc-tion from the reacproduc-tion of OH with NO cannot explain the high HONO concentrations in the afternoon. Ozonolysis of alkene species made only a minor contribution to the OH production at all times. Only C2to C6alkene species were measured so
that ozonolysis reactions of undetected alkene species (po-tentially monoterpenes) could have additionally contributed to the OH production. However, the good agreement between measured and calculated OH reactivity does not indicate that a large fraction of alkene species were missed.
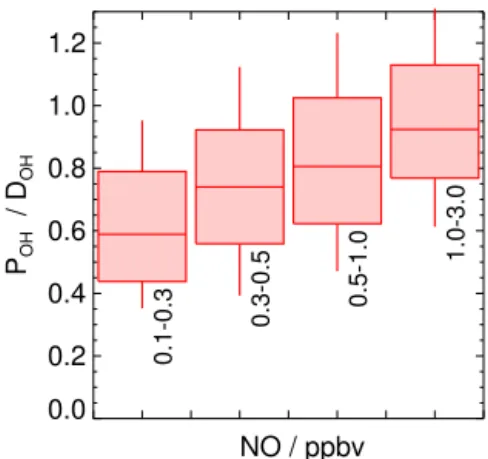
The time series of the total OH production and destruc-tion rates, determined by Eqs. (2) and (3), respectively, were nearly balanced for most of the time (Fig. 2). The OH de-struction rate is on average only 20 % higher than the sum of OH production during the daytime. Although the differ-ence is hardly significant with respect to the experimental accuracies (Fig. 9), a systematic trend of the ratio between OH production and destruction rates with NO can be seen (Fig. 10), which points to a missing OH source at low NO concentrations.
pro-0.0 0.2 0.4 0.6 0.8 1.0 1.2
POH
/ D
OH
0.1-0.3
0.3-0.5 0.5-1.0
1.0-3.0
NO / ppbv
Figure 10.Box and whisker plot of the ratio of the total OH pro-duction (POH) and the OH destruction rate (DOH) as a function
of the NO mixing ratio for daytime values. Boxes give 25 and 75 percentiles, and whiskers give 10 and 90 percentiles. Data are only included if all required trace gas concentrations and OH reactivity were measured concurrently. Gray areas indicate nighttime.
duction and destruction was balanced for NO mixing ratios higher than 1 ppbv. The result of the budget analysis is con-sistent with the finding by Tan et al. (2017) that model calcu-lations underpredict OH by up to a factor of 2 at NO mixing ratios of less than 0.3 ppbv but describe HO2andkOH
cor-rectly under these conditions at the Wangdu site. The good description of HO2andkOHmeans that the major known OH
source (the reaction of HO2and NO) and the total OH loss
rate are represented well by the model. Further model tests suggest a missing process that recycles OH from RO2 and
HO2 by an unknown agent that behaves like 0.1 ppbv NO
(Tan et al., 2017). Other trace gases measured at Wangdu give no indication as to the nature of the missing source in the OH budget analysis or in the model results. A similar be-havior was found in our previous field campaigns in China in 2006. However, the ratio ofPOH/DOHwas much smaller,
with a value of about 0.25 for NO mixing ratios of 0.1 to 0.2 ppbv NO in PRD (Hofzumahaus et al., 2009). In this case, the missing OH source was highly significant with respect to the experimental uncertainties of the calculated reaction rates, whereas in Wangdu, the much weaker imbalance of the OH budget can be almost explained by the experimental errors.
In addition to the measurement uncertainties stated in Ta-ble 1, instrumental tests during this campaign cannot exclude that OH concentration measurements are partly affected by an artifact, as discussed in detail in Tan et al. (2017). The upper limit for an instrumental interference was estimated to be equivalent to an OH concentration of 1×106cm−3. This positive bias would also give a positive bias in the calculated OH destruction rate.
In the night, OH production from sources taken into ac-count in this calculation is close to zero because there is no radiation. This suppresses both OH production from
photol-ysis reactions and OH regeneration by the reaction of peroxy radicals with NO. Because of the relatively high OH reactiv-ity OH concentrations are expected to be very small. How-ever, median measured OH concentrations ranged between 0.5 and 1×106cm−3(Fig. 8). A median OH production of 1 to 3 ppbv h−1would be required to explain measured night-time OH concentrations (Fig. 9).
Potential reasons for additional OH production at night have been recently discussed by Lu et al. (2014), such as OH production by ozonolysis of terpenoids or dissociation of rad-ical reservoir species like PAN that may be transported down-ward in the nocturnal boundary layer. Such mechanisms may have played a role at Wangdu, but we have no suitable mea-sured data to test these hypotheses. In order to balance the calculated OH destruction rate during the nighttime, a rather large concentration of an alkene would be required. Assum-ing an ozone concentration of 30 ppbv, a reaction rate con-stant for the ozonolysis reaction of 1.8×10⁻¹⁵cm3s−1 for
δ-terpene and an OH yield of 1 (Atkinson and Arey, 2003), the concentration would need to be around 600 pptv.
However, the impact of a potential interference in the OH concentration measurements would also be largest in the night (Fig. 9) because nearly the entire OH signal could be due to interferences. As a consequence, the difference be-tween calculated OH production and destruction during the nighttime is within this additional uncertainty. The calculated OH destruction rate is less affected during the daytime, when a potential OH interference of less than 1×106cm−3would only be a small fraction of the total measured OH (Tan et al., 2017).
In our previous field campaigns in China in 2006, the OH destruction and production rates were significantly higher than in this campaign. In PRD and Yufa, maximum mean turnover rates (OH destruction rates) of 40 and 20 ppbv h−1, respectively, were reached around noontime (Lu et al., 2012, 2013). These values are 1.5 to 3 times higher than median OH turnover rates in this campaign. As discussed above, the ma-jor difference is that measured OH reactivities were signifi-cantly higher in the previous campaigns. The resulting higher loss rate was only partly balanced by a higher OH production from the reaction of HO2with NO, which was nearly a
fac-tor of 2 larger in PRD and Yufa. Therefore, the gap between calculated OH destruction and production was also clearly above the level of significance with respect to the measure-ment uncertainties (Hofzumahaus et al., 2009).
HONO photolysis was also the most important primary source for OH radicals in other campaigns that were con-ducted in anthropogenically dominated environments for ex-ample in New York (Ren et al., 2003), Paris (Michoud et al., 2012), Mexico City (Dusanter et al., 2009), Santiago (Elshorbany et al., 2009) and Tokyo (Kanaya et al., 2007). These campaigns took place in or very close to very large cities (the one in Paris during wintertime) and NO concen-trations were often exceptionally high so that HONO forma-tion was favored. Our measurement site in Wangdu was not directly located in an urban area, and therefore the NOx con-centrations were only moderately high in the morning and rather small in the afternoon so that the importance of HONO as the largest primary source for OH was not necessarily ex-pected. The contribution of alkene ozonolysis to the OH pro-duction in other campaigns in urban environments was partly significantly higher (Kanaya et al., 2007; Dusanter et al., 2009; Elshorbany et al., 2009) compared to the Wangdu site due to higher alkene concentrations.
4 Summary and conclusions
OH reactivity was measured during a comprehensive field campaign at Wangdu in summer 2014. Additional measure-ments of OH reactants, OH concentrations and quantities that are required to calculate OH production (HO2, NO, O3,
HONO, photolysis frequencies) allowed comparing OH re-activity measurements with calculations from measured OH reactants and analyzing the chemical OH budget from mea-surements alone.
Overall, measured OH reactivity can mostly be explained by OH reactant measurements, specifically during the sec-ond half of the campaign. Highest missing reactivity of the median diurnal profile (approximately 25 %) was observed during the nighttime of the first part of the campaign, which could have been related to nearby emissions or undetected oxidation products. The diurnal profile of OH reactivity, the distribution of OH reactant and the good correlation of the OH reactivity with CO indicates that the chemical composi-tion at the measurement site was mainly impacted by anthro-pogenic emissions. In our previous field campaigns in China in 2006, the number of OH reactants that were measured was less, and, thus, only approximately 50 % of the measured OH reactivity was explained by measured OH reactants (Lou et al., 2010; Lu et al., 2012, 2013). However, additional OH reactants determined by model calculations could close the gap in these cases. In this campaign, the good agreement be-tween measured and calculated reactivity indicates that most important organic compounds were measured, including ox-idation products.
OH production and destruction were mainly balanced within the uncertainty of measurements. The accuracy of this calculation was lowered by additional uncertainty in the OH concentration measurements due to a potential bias (Tan
et al., 2017). Despite this uncertainty, the OH destruction tends to be higher than OH production in the late afternoon, when NO concentrations were lowest. This result is con-sistent with the analysis of model calculations (Tan et al., 2017) and findings in previous field campaigns (Hofzuma-haus et al., 2009).
However, in 2006 the observed discrepancy between the OH production and destruction rates was significantly larger requiring an additional OH source to close the gap. The ma-jor difference to this campaign was that the measured OH reactivity was much higher. Therefore, a significant gap in OH production and destruction rates was found, in contrast to results in this campaign. For future field work, compre-hensive studies like this campaign in photochemically active environments where larger contributions from biogenic reac-tants can be expected in addition to anthropogenic emissions may help to solve the still open questions of imbalances in OH production and destruction and measured and calculated OH reactivity that have been observed in other campaigns.
5 Data availability
The data of this paper are available upon request. Please contact the corresponding authors Yuanhang Zhang ([email protected]) or Hendrik Fuchs ([email protected]).
Acknowledgement. We thank the science teams of the Wangdu-2014 campaign. This work was supported by the National Natural Science Foundation of China (Major Program: 21190052 and Innovative Research Group: 41121004), the Strategic Priority Research Program of the Chinese Academy of Sciences (grant no. XDB05010500), the Collaborative Innovation Center for Regional Environmental Quality and the EU-project AMIS (Fate and Impact of Atmospheric Pollutants, PIRSES-GA-2011-295132). The au-thors gratefully acknowledge the NOAA Air Resources Laboratory (ARL) for the provision of the HYSPLIT transport and dispersion model and READY website (http://www.ready.noaa.gov) used in this publication.
Edited by: D. Parrish
Reviewed by: four anonymous referees
References
Atkinson, R. and Arey, J.: Gas-phase tropospheric chemistry of bio-genic volatile organic compounds: a review, Atmos. Environ., 37, S197–S219, doi:10.1016/S1352-2310(03)00391-1, 2003. Atkinson, R., Baulch, D. L., Cox, R. A., Crowley, J. N.,
Atkinson, R., Baulch, D. L., Cox, R. A., Crowley, J. N., Hamp-son, R. F., Hynes, R. G., Jenkin, M. E., Rossi, M. J., Troe, J., and IUPAC Subcommittee: Evaluated kinetic and photochemi-cal data for atmospheric chemistry: Volume II – gas phase re-actions of organic species, Atmos. Chem. Phys., 6, 3625–4055, doi:10.5194/acp-6-3625-2006, 2006.
Bohn, B., Corlett, G. K., Gillmann, M., Sanghavi, S., Stange, G., Tensing, E., Vrekoussis, M., Bloss, W. J., Clapp, L. J., Kortner, M., Dorn, H.-P., Monks, P. S., Platt, U., Plass-Dülmer, C., Mi-halopoulos, N., Heard, D. E., Clemitshaw, K. C., Meixner, F. X., Prevot, A. S. H., and Schmitt, R.: Photolysis frequency measure-ment techniques: results of a comparison within the ACCENT project, Atmos. Chem. Phys., 8, 5373–5391, doi:10.5194/acp-8-5373-2008, 2008.
Chatani, S., Shimo, N., Matsunaga, S., Kajii, Y., Kato, S., Nakashima, Y., Miyazaki, K., Ishii, K., and Ueno, H.: Sensi-tivity analyses of OH missing sinks over Tokyo metropolitan area in the summer of 2007, Atmos. Chem. Phys., 9, 8975–8986, doi:10.5194/acp-9-8975-2009, 2009.
Dong, H.-B., Zeng, L.-M., Hu, M., Wu, Y.-S., Zhang, Y.-H., Slan-ina, J., Zheng, M., Wang, Z.-F., and Jansen, R.: Technical Note: The application of an improved gas and aerosol collector for am-bient air pollutants in China, Atmos. Chem. Phys., 12, 10519– 10533, doi:10.5194/acp-12-10519-2012, 2012.
Dusanter, S., Vimal, D., Stevens, P. S., Volkamer, R., Molina, L. T., Baker, A., Meinardi, S., Blake, D., Sheehy, P., Merten, A., Zhang, R., Zheng, J., Fortner, E. C., Junkermann, W., Dubey, M., Rahn, T., Eichinger, B., Lewandowski, P., Prueger, J., and Holder, H.: Measurements of OH and HO2concentrations
dur-ing the MCMA-2006 field campaign – Part 2: Model compar-ison and radical budget, Atmos. Chem. Phys., 9, 6655–6675, doi:10.5194/acp-9-6655-2009, 2009.
Ehhalt, D. H.: Photooxidation of trace gases in the tro-posphere, Phys. Chem. Chem. Phys., 1, 5401–5408, doi:10.1039/a905097c, 1999.
Elshorbany, Y. F., Kurtenbach, R., Wiesen, P., Lissi, E., Rubio, M., Villena, G., Gramsch, E., Rickard, A. R., Pilling, M. J., and Kleffmann, J.: Oxidation capacity of the city air of Santiago, Chile, Atmos. Chem. Phys., 9, 2257–2273, doi:10.5194/acp-9-2257-2009, 2009.
Fuchs, H., Bohn, B., Hofzumahaus, A., Holland, F., Lu, K. D., Nehr, S., Rohrer, F., and Wahner, A.: Detection of HO2by laser-induced fluorescence: calibration and interferences from RO2
radicals, Atmos. Meas. Tech., 4, 1209–1225, doi:10.5194/amt-4-1209-2011, 2011.
Fuchs, H., Hofzumahaus, A., Rohrer, F., Bohn, B., Brauers, T., Dorn, H.-P., Häseler, R., Holland, F., Kaminski, M., Li, X., Lu, K., Nehr, S., Tillmann, R., Wegener, R., and Wahner, A.: Experimental evidence for efficient hydroxyl radical re-generation in isoprene oxidation, Nat. Geosci., 6, 1023–1026, doi:10.1038/NGEO1964, 2013.
Fuchs, H., Acir, I.-H., Bohn, B., Brauers, T., Dorn, H.-P., Häseler, R., Hofzumahaus, A., Holland, F., Kaminski, M., Li, X., Lu, K., Lutz, A., Nehr, S., Rohrer, F., Tillmann, R., Wegener, R., and Wahner, A.: OH regeneration from methacrolein oxidation in-vestigated in the atmosphere simulation chamber SAPHIR, At-mos. Chem. Phys., 14, 7895–7908, doi:10.5194/acp-14-7895-2014, 2014.
Goldstein, A. H. and Galbally, I. E.: Known and unexplored organic constituents in the earth’s atmosphere, Environ. Sci. Technol., 41, 1514–1521, doi:10.1021/es072476p, 2007.
Griffith, S. M., Hansen, R. F., Dusanter, S., Michoud, V., Gilman, J. B., Kuster, W. C., Veres, P. R., Graus, M., de Gouw, J. A., Roberts, J., Young, C., Washenfelder, R., Brown, S. S., Thal-man, R., WaxThal-man, E., Volkamer, R., Tsai, C., Stutz, J., Flynn, J. H., Grossberg, N., Lefer, B., Alvarez, S. L., Rappenglueck, B., Mielke, L. H., Osthoff, H. D., and Stevens, P. S.: Measurements of hydroxyl and hydroperoxy radicals during CalNex-LA: Model comparisons and radical budgets, J. Geophys. Res., 121, 4211– 4232, doi:10.1002/2015JD024358, 2016.
Hofzumahaus, A., Rohrer, F., Lu, K., Bohn, B., Brauers, T., Chang, C.-C., Fuchs, H., Holland, F., Kita, K., Kondo, Y., Li, X., Lou, S., Shao, M., Zeng, L., Wahner, A., and Zhang, Y.: Amplified trace gas removal in the troposphere, Science, 324, 1702–1704, doi:10.1126/science.1164566, 2009.
Holland, F., Hofzumahaus, A., Schäfer, J., Kraus, A., and Pätz, H. W.: Measurements of OH and HO2radical concentrations and photolysis frequencies during BERLIOZ, J. Geophys. Res., 108, 8246, doi:10.1029/2001JD001393, 2003.
Kanaya, Y., Cao, R., Akimoto, H., Fukuda, M., Komazaki, Y., Yokouchi, Y., Koike, M., Tanimoto, H., Takegawa, N., and Kondo, Y.: Urban photochemistry in central Tokyo: 1. ob-served and modeled OH and HO2radical concentrations during
the winter and summer 2004, J. Geophys. Res., 112, D21312, doi:10.1029/2007JD008670, 2007.
Kim, S., Sanchez, D., Wang, M., Seco, R., Jeong, D., Hughes, S., Barletta, B., Blake, D. R., Jung, J., Kim, D., Lee, G., Lee, M., Ahn, J., Lee, S.-D., Cho, G., Sung, M.-Y., Lee, Y.-H., Kim, D. B., Kim, Y., Woo, J.-Y.-H., Jo, D., Park, R., Park, J.-H., Hong, Y.-D., and Hong, J.-H.: OH reactivity in urban and suburban regions in Seoul, South Korea – an East Asian megacity in a rapid transition, Faraday Discuss., 189, 231–251, doi:10.1039/C5FD00230C, 2016.
Kovacs, T. A., Brune, W. H., Harder, H., Martinez, M., Simpas, J. B., Frost, G. J., Williams, E., Jobson, T., Stroud, C., Young, V., Fried, A., and Wert, B.: Direct measurements of urban OH reac-tivity during Nashville SOS in summer 1999, J. Environ. Moni-tor., 5, 68–74, doi:10.1039/B204339D, 2003.
Li, X., Rohrer, F., Hofzumahaus, A., Brauers, T., Häseler, R., Bohn, B., Broch, S., Fuchs, H., Gomm, S., Holland, F., Jäger, J., Kaiser, J., Keutsch, F. N., Lohse, I., Lu, K., Tillmann, R., Wegener, R., Wolfe, G. M., Mentel, T. F., Kiendler-Scharr, A., and Wah-ner, A.: Missing gas-phase source of HONO inferred from Zep-pelin measurements in the troposphere, Science, 344, 292–296, doi:10.1126/science.1248999, 2014.
Liu, Y., Lu, K., Dong, H., Li, X., Cheng, P., Zou, Q., Wu, Y., Liu, X., and Zhang, Y.: In situ monitoring of atmospheric nitrous acid based on multi-pumping flow system and liq-uid wavegliq-uide capillary cell, J. Environ. Sci., 43, 273–284, doi:10.1016/j.jes.2015.11.034, 2016.