ACPD
14, 23763–23796, 2014Influence of clouds on the oxidising
capacity of the troposphere
L. K. Whalley et al.
Title Page
Abstract Introduction
Conclusions References
Tables Figures
◭ ◮
◭ ◮
Back Close
Full Screen / Esc
Printer-friendly Version Interactive Discussion
Discussion
P
a
per
|
Discus
sion
P
a
per
|
Discussion
P
a
per
|
Discussion
P
a
per
|
Atmos. Chem. Phys. Discuss., 14, 23763–23796, 2014 www.atmos-chem-phys-discuss.net/14/23763/2014/ doi:10.5194/acpd-14-23763-2014
© Author(s) 2014. CC Attribution 3.0 License.
This discussion paper is/has been under review for the journal Atmospheric Chemistry and Physics (ACP). Please refer to the corresponding final paper in ACP if available.
Influence of clouds on the oxidising
capacity of the troposphere
L. K. Whalley1,2, D. Stone2, I. J. George2,*, S. Mertes3, D. van Pinxteren3, A. Tilgner3, H. Herrmann3, M. J. Evans4,5, and D. E. Heard1,2
1
National Centre for Atmospheric Science, University of Leeds, Leeds, LS2 9JT, UK
2
School of Chemistry, University of Leeds, Leeds, LS2 9JT, UK
3
Leibniz-Institut für Troposphärenforschung (TROPOS), Permoserstr. 15, 04318 Leipzig, Germany
4
National Centre for Atmospheric Science, University of York, York, YO10 5DD, UK
5
Department of Chemistry, University of York, York, YO10 5DD, UK
*
now at: National Risk Management Research Laboratory, US Environmental Protection Agency, Research Triangle Park, North Carolina 27711, USA
Received: 21 July 2014 – Accepted: 29 August 2014 – Published: 15 September 2014
Correspondence to: L. K. Whalley (l.k.whalley@leeds.ac.uk)
ACPD
14, 23763–23796, 2014Influence of clouds on the oxidising
capacity of the troposphere
L. K. Whalley et al.
Title Page
Abstract Introduction
Conclusions References
Tables Figures
◭ ◮
◭ ◮
Back Close
Full Screen / Esc
Printer-friendly Version Interactive Discussion
Discussion
P
a
per
|
Discus
sion
P
a
per
|
Discussion
P
a
per
|
Discussion
P
a
per
|
Abstract
The potential for chemistry occurring in cloud droplets to impact atmospheric compo-sition has been known for some time. However, the lack of direct observations and uncertainty in the magnitude of these reactions, led to this area being overlooked in most chemistry transport models. Here we present observations from Mt. Schmücke,
5
Germany, of the HO2 radical made alongside a suite of cloud measurements. HO2
concentrations were depleted in-cloud by up to 90 % with the rate of heterogeneous loss of HO2 to clouds necessary to bring model and measurements into agreement
demonstrating a dependence on droplet surface area and pH. This provides the first observationally derived assessment for the uptake coefficient of HO2to cloud droplets
10
and was found to be in good agreement with theoretically derived parameterisations. Global model simulations, including this cloud uptake, showed impacts on the oxidizing capacity of the troposphere that depended critically on whether the HO2uptake leads to production of H2O2or H2O.
1 Introduction
15
Clouds occupy around 15 % of the volume of the lower troposphere and can impact atmospheric composition through changes in transport, photolysis, wet deposition and in-cloud oxidation of sulphur. Modelling studies have shown that aqueous phase chem-istry can also significantly reduce gaseous HO2concentrations by heterogeneous up-take and loss into cloud droplets (Tilgner et al., 2005; Huijnen et al., 2014). This
chem-20
istry is predicted to reduce OH and O3 concentrations also due to the reduction in the
gas-phase concentration of HO2. This in turn, decreases the self-cleansing capacity of the atmosphere and increases the lifetime of many trace gases (Lelieveld and Crutzen, 1990) with impacts for climate and air quality. Aqueous phase models have been de-veloped which combine multiphase chemistry with detailed microphysics (Tilgner et al.,
25
ACPD
14, 23763–23796, 2014Influence of clouds on the oxidising
capacity of the troposphere
L. K. Whalley et al.
Title Page
Abstract Introduction
Conclusions References
Tables Figures
◭ ◮
◭ ◮
Back Close
Full Screen / Esc
Printer-friendly Version Interactive Discussion
Discussion
P
a
per
|
Discus
sion
P
a
per
|
Discussion
P
a
per
|
Discussion
P
a
per
|
within clouds to corroborate model predictions of heterogeneous loss of radicals to cloud droplets. There have been a number of aircraft campaigns which have mea-sured OH and HO2 radical concentrations within clouds (Mauldin et al., 1997, 1998;
Olson et al., 2004; Commane et al., 2010), often, however, simultaneous observations of cloud droplet number and size distributions (or other key gas-phase radical
precur-5
sors) were not made during these studies, making it difficult to assess the full impact of clouds on radical concentrations. In general therefore climate and air quality models do not consider this impact of clouds on atmospheric composition.
Within the literature, a wide range of uptake coefficients of HO2to liquid and aerosol
surfaces have been considered to reproduce observed HO2concentrations (e.g.
Som-10
mariva et al., 2004; Haggerstone et al., 2005; Emmerson et al., 2007; Whalley et al., 2010) with often large uptake coefficients (up to 1 at times) used to reconcile model over-predictions. A wide range of uptake coefficients, not wholly consistent with each other, have been reported from laboratory studies (Abbatt et al., 2012). From measure-ments conducted in our laboratory, uptake probabilities of HO2to sub-micron aerosols
15
were found to be less than 0.02 at room temperature (George et al., 2013) for aque-ous aerosols that did not contain significant transition metal ions; similarly low uptake coefficients were derived by Thornton and Abbatt (2005). In contrast, measurements by Taketani et al. (2008) suggest higher uptakes of∼0.1 with enhancements observed
with increasing relative humidity.
20
The uptake of HO2to aqueous aerosols is driven by its high solubility in water owing
to its high Henry’s Law constant (HHO2 =4.0×10 3
M atm−1at 298.15 K, Hanson et al., 1992). Once in the aqueous phase, reaction between dissolved HO2and its conjugate base, O−2, occurs rapidly. Thornton et al. (2008) have demonstrated that the solubility and reactivity of HO2 is temperature and pH dependent and if the well characterised
25
ACPD
14, 23763–23796, 2014Influence of clouds on the oxidising
capacity of the troposphere
L. K. Whalley et al.
Title Page
Abstract Introduction
Conclusions References
Tables Figures
◭ ◮
◭ ◮
Back Close
Full Screen / Esc
Printer-friendly Version Interactive Discussion
Discussion
P
a
per
|
Discus
sion
P
a
per
|
Discussion
P
a
per
|
Discussion
P
a
per
|
(2005). The enhanced uptake coefficients reported by Taketani et al. (2008) suggests that there may be additional competing mechanisms occurring, however.
Further uncertainties arise in the literature relating to the eventual gas-phase prod-ucts from these aqueous-phase reactions. The general consensus, until recently, was that these reactions would ultimately produce H2O2, but the significance of the
reac-5
tions depends critically on whether this is the case or whether, instead, H2O is
pro-duced (Macintyre and Evans, 2011). This is significant as H2O2 can photolyse to re-turn odd hydrogen (HOx=OH+HO2) to the gas phase, whilst cloud uptake of HO2 to
form H2O provides a terminal sink for HOx. Recent work by Mao et al. (2013)
pos-tulates that a catalytic mechanism involving the coupling of the transition metal ions
10
Cu(I)/Cu(II) and Fe(II)/Fe(III) may rapidly convert HO2 to H2O, rather than H2O2 in aqueous aerosols. The concentration and availability of dissolved Fe and Cu in cloud droplets tends to be much lower than in aqueous aerosol (Jacob, 2000) with a large fraction of Cu ions present as organic complexes (Spokes et al., 1996; Nimmo and Fones, 1997) which are far less reactive towards O−2 and HO2(aq) than the free ions
15
(Jacob, 2000) and so it is uncertain whether the mechanism put forward by Mao et al. (2013) could be extended to heterogeneous processes occurring within cloud droplets.
To better understand the role of clouds and heterogeneous processes on the oxida-tive capacity of the troposphere, coordinated gas-phase measurements of OH and HO2
20
within clouds together with aerosol-cloud microphysical measurements are needed. The Hill Cap Cloud Thüringia 2010 (HCCT-2010) campaign which took place in 2010 aimed to characterise the interaction of particulate matter and trace gases in orographic clouds. This paper presents the impact of cloud droplets on measured gas-phase OH and HO2and uses these observations to assess the proposed aqueous phase
mecha-25
ACPD
14, 23763–23796, 2014Influence of clouds on the oxidising
capacity of the troposphere
L. K. Whalley et al.
Title Page
Abstract Introduction
Conclusions References
Tables Figures
◭ ◮
◭ ◮
Back Close
Full Screen / Esc
Printer-friendly Version Interactive Discussion
Discussion
P
a
per
|
Discus
sion
P
a
per
|
Discussion
P
a
per
|
Discussion
P
a
per
|
2 Experimental
The HCCT-2010 campaign took place at the Thüringer Wald mountain range in cen-tral Germany during September and October 2010. The radical measurements were made from the German Weather Service (DWD) and the Federal Environmental Office (UBA) research station located close to the summit of Mt. Schmücke (the highest peak
5
in the mountain range, 937 m above sea level, 10◦46′8.5′′E, 50◦39′16.5′′N). In Octo-ber, the UBA station is immersed in cloud for 25 days on average (Herrmann et al., 2005) and, hence, is highly suitable for the study of gas and aerosol interactions with orographic cloud. Two additional experimental sites, approximately 4 km upwind of the summit site at Goldlauter and approximately 3 km downwind of the summit at
Gelh-10
berg were also equipped with a number of instruments which enabled the processing of a single air parcel as it passed through a cloud to be assessed by multiphase trajec-tory models such as SPACCIM (SPectral Aerosol Cloud Chemistry Interaction Model (Wolke et al., 2005); see Sect. 2.3). Further details of the locations may be found in Herrmann et al. (2005).
15
2.1 Radical measurements
OH and HO2 measurements were made using the fluorescence assay by gas ex-pansion technique (FAGE). Details of the instrumentation can be found in Whalley et al. (2010). A single FAGE fluorescence cell was used for sequential measurements of OH and HO2. This was operated from the top of a 22 m high tower to co-locate with
20
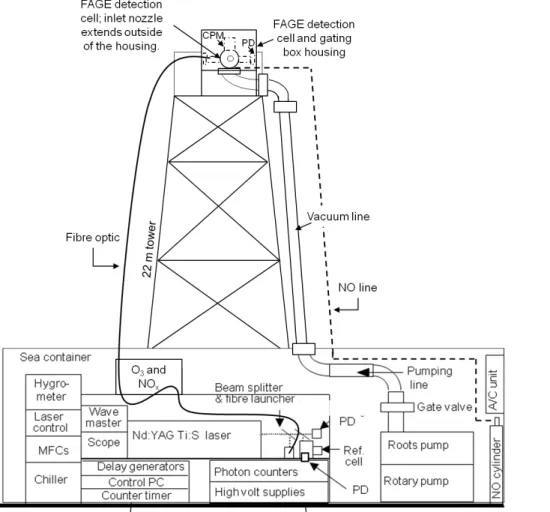
cloud measurements and ensure that the measurements were performed in full cloud. The cell was held at 1 Torr using a roots blower backed rotary pump system which was housed in an air-conditioned shipping container at the base of the tower (Fig. 1) and was connected to the cell via 30 m of flexible hosing (5 cm OD). 308 nm tune-able, pulsed laser light was used to electronically excite OH radicals, this was delivered
25
Fluores-ACPD
14, 23763–23796, 2014Influence of clouds on the oxidising
capacity of the troposphere
L. K. Whalley et al.
Title Page
Abstract Introduction
Conclusions References
Tables Figures
◭ ◮
◭ ◮
Back Close
Full Screen / Esc
Printer-friendly Version Interactive Discussion
Discussion
P
a
per
|
Discus
sion
P
a
per
|
Discussion
P
a
per
|
Discussion
P
a
per
|
cence was detected by a channel photo multiplier (CPM) (Perkin Elmer) and gated photon counting. Data were acquired every second (photon counts from 5000 laser shots), with a data acquisition cycle consisting of 220 s with the laser wavelength tuned to the OH transition (NO was injected after 110 s to rapidly convert HO2to OH, to allow the quantification of HO2) and 110 s tuned away from the OH transition to determine
5
the background signal from laser scattered light.
The sensitivity of the fluorescence cell for OH and HO2 was determined twice weekly during the measurement period through calibration using VUV photolysis of H2O vapour in a turbulent flow of zero air (BOC, BTCA air). The lamp flux was
deter-mined by N2O actinometry (see Commane et al. (2010) for further details); this was
10
carried out before and after the campaign and the values agreed within 21 %; the aver-age flux was used to determine the sensitivity. The limit of detection (LOD) at a signal to noise ratio of one for one data acquisition cycle was ∼6×10⁵molecule cm−3 and ∼8.5×10⁵molecule cm−3for OH and HO2, respectively.
A number of operational modifications (from the standard University of Leeds
15
ground-based operations, Whalley et al., 2010) were necessary to facilitate measure-ments of the gas-phase concentrations of the radicals within clouds. As tower mea-surements were required (schematic of the measurement set-up is provided in Fig. 1), a single, smaller (4.5 cm (ID) diameter stainless steel cylinder) FAGE fluorescence cell, based on the University of Leeds aircraft cell design (Commane et al., 2010) was
20
used for sequential measurements of OH and HO2. Ambient air was drawn into the
cell through a 1 mm diameter pinhole nozzle. The distance between sampling nozzle and radical detection region was 18 cm and NO (10 SCCM, BOC, 99.5 %) was injected
∼8 cm below the nozzle for titration of HO2to OH.
The fluorescence cell was orientated with the nozzle pointing horizontal to the ground
25
ACPD
14, 23763–23796, 2014Influence of clouds on the oxidising
capacity of the troposphere
L. K. Whalley et al.
Title Page
Abstract Introduction
Conclusions References
Tables Figures
◭ ◮
◭ ◮
Back Close
Full Screen / Esc
Printer-friendly Version Interactive Discussion
Discussion
P
a
per
|
Discus
sion
P
a
per
|
Discussion
P
a
per
|
Discussion
P
a
per
|
were discreet and short-lived; the data presented here have been filtered to remove these spikes, which were easy to identify.
Tests have been conducted post-campaign to determine the level of HO2
interfer-ence from RO2radicals (Fuchs et al., 2011). Under this particular experimental set-up, an equivalent amount of ethene-derived RO2radicals to HO2were found to contribute
5
46 % to the total HO2signal (Whalley et al., 2013). The FAGE instrument was found not
to be sensitive to CH3O2, and other short-chain alkane-derived RO2radicals but is sen-sitive to other alkene and aromatic derived RO2radicals with similar sensitivities to that
for ethene-derived RO2. The instrument is also sensitive to longer-chain alkane-derived
RO2radicals (>C3) albeit to a smaller extent, as reported by Whalley et al. (2013). For
10
this rural environment, at this time of year, however, the contribution of alkene and aromatic-derived RO2 radicals to the total RO2budget is expected to be small as the
parent VOCs for these particular RO2types were at low concentrations; isoprene
con-centrations, for example, were on average just 12.6 pptv. As a consequence of this, the resultant HO2interference from RO2radicals should also be low.
15
2.2 Model expression and constraints
An analytical expression has been used to predict the mean diurnal HO2concentrations throughout the campaign both during cloud events and outside of cloud events. This expression was originally developed by Carslaw et al. (1999) for modelling OH, HO2
and RO2radicals in the marine boundary layer and was found to agree with full Master
20
Chemical Mechanism (MCM) model predictions for OH and HO2 to within 20 % for daytime hours. It has since been extended further by Smith et al. (2006) to include additional HO2 sinks, such as heterogeneous loss (kLoss). The expression, given in
Eq. (3), derives from the solution of simultaneous steady state expressions for OH and CH3O2(Eqs. 1 and 2 below) and includes any primary sources of HO2not coming from
ACPD
14, 23763–23796, 2014Influence of clouds on the oxidising
capacity of the troposphere
L. K. Whalley et al.
Title Page
Abstract Introduction
Conclusions References
Tables Figures
◭ ◮
◭ ◮
Back Close
Full Screen / Esc
Printer-friendly Version Interactive Discussion
Discussion
P
a
per
|
Discus
sion
P
a
per
|
Discussion
P
a
per
|
Discussion
P
a
per
|
radical propagation steps such as formaldehyde photolysis:
[OH]=2f j(O
1
D)[O3]+[HO2](kHO2+NO[NO]+kHO2+O3[O3])
kCO+OH[CO]+kH2+OH[H2]+kHCHO+OH[HCHO]
+kCH4+OH[CH4]+kNO2+OH[NO2]+kO3+OH[O3]
(1)
[CH3O2]=
kCH4+OH[CH4][OH]
kCH3O2+HO2[HO2]+kCH3O2+NO[NO]
(2)
β[HO2]3+γ[HO2]2+δ[HO2]+ε=0 (3)
5
where
β=2kT2(kT3B+kT1A)
γ=2kT3kT2J1+2kT3kP5[NO]B+2kT2kP4[CH4]B+kT[NO2]kT2B+2AkT1kP5[NO] δ=2kT3kP5J1[NO]+2kT2kP4J1[CH4]+kTJ1[NO2]kT2+kTB[NO2]kP5[NO]
−(J1+J2)AkT2
10
ε=J1kT[NO2]kP5[NO]−(J1+J2)AkP5[NO]
where
J1=P(OH)=2f[O3]j(O1D)
15
(f is the fraction of O(1D) that reacts with H2O vapour to form OH, rather than being quenched to O(3P))
J2=2j(HCHO→2HO2)[HCHO]
A=kCO+OH[CO]+kH2+OH[H2]+kHCHO+OH[HCHO]+kCH4+OH[CH4]+kNO2+OH[NO2]
+kO3+OH[O3]
ACPD
14, 23763–23796, 2014Influence of clouds on the oxidising
capacity of the troposphere
L. K. Whalley et al.
Title Page
Abstract Introduction
Conclusions References
Tables Figures
◭ ◮
◭ ◮
Back Close
Full Screen / Esc
Printer-friendly Version Interactive Discussion
Discussion
P
a
per
|
Discus
sion
P
a
per
|
Discussion
P
a
per
|
Discussion
P
a
per
|
B=kHO2+NO[NO]+kHO2+O3[O3]+kloss
kT =kOH+NO2 kT1=kHO2+HO2 kT2=kHO2+CH3O2 kT3=kOH+HO2 kP4=kCH4+OH kP5=kCH3O2+NO
Limited CO concentration data are available from the summit site during the project,
5
owing to instrumental problems for the first two weeks of measurements. An average CO concentration of 231 ppbv was used in the analytical expression to determine HO2
concentrations although additional model runs at+and −1σ of this average
concen-tration (297 ppbv and 165 ppbv respectively) were also made to assess the sensitiv-ity of the predicted HO2 concentration to this constraint. Similarly, only discrete
(non-10
continuous) measurements of HCHO were made during the project; an average value of 479 pptv was used as a model constraint and further model runs at +and −1σ of
this average concentration (818 pptv and 139 pptv respectively) were made.
j(O1D) was measured from the top of the 22 m tower, alongside the FAGE detection cell, using a 2πfilter radiometer (Bohn et al., 2008). The photolysis rates of
formalde-15
hyde, j(HCHO), have been calculated using the Tropospheric Ultraviolet and Visible (TUV) radiation model (Madronich and Flocke, 1998). The correlation between TUV calculatedj(HCHO) with TUV calculatedj(O1D) was determined allowing these pho-tolysis rates to be scaled to the measuredj(O1D) values to account for the presence of clouds. A constant value of 1760 ppbv was assumed for CH4and a value of 508 ppbv
20
was taken for H2. O3 and NOx measurements were made from the top of the tower using commercial analysers which ran continuously from the 16 September (day 3 of the field project). Details of the ancillary measurements used for comparison and model constraints are provided in Table 1. Further details of many of the measurement techniques can be found in the overview paper from an earlier hill cap cloud
experi-25
ment, the Field Investigations of Budgets and Conversions of Particle Phase Organics in Tropospheric Cloud Processes (FEBUKA) project (Herrmann et al., 2005).
ACPD
14, 23763–23796, 2014Influence of clouds on the oxidising
capacity of the troposphere
L. K. Whalley et al.
Title Page
Abstract Introduction
Conclusions References
Tables Figures
◭ ◮
◭ ◮
Back Close
Full Screen / Esc
Printer-friendly Version Interactive Discussion
Discussion
P
a
per
|
Discus
sion
P
a
per
|
Discussion
P
a
per
|
Discussion
P
a
per
|
A constant uptake rate for HO2 (kLoss) of 0.1 s− 1
to cloud droplets was included during cloud events to reproduce the average HO2 in-cloud observations. Additional
model runs with no uptake during cloud events have also been run for comparison, as have model runs in which the first order loss to droplets was varied to replicate the HO2
observations as a function of (i) cloud droplet surface area and (ii) pH (Sect. 3.1).
5
2.3 Aqueous phase chemistry
An outline of the aqueous phase reactions thought to be occurring, and which converts HO2to H2O2, is given below:
HO2(g) ⇋ HO2(aq) (R1)
HO2(aq) ⇋ H+(aq)+O−2(aq) (R2)
10
HO2(aq)+HO2(aq) → H2O2(aq)+O2(aq) (R3)
HO2(aq)+O−
2(aq)(+H2O(l)) → H2O2(aq)+O2(aq)+OH−(aq) (R4)
O−
2+O3(aq)(+H2O(l)) → OH−(aq)+OH(aq)+2O2 (R5)
The equations used to calculate the theoretical increase inγHO2 with increasing pH, as
proposed by Thornton et al. (2008), which have been compared withγHO2 determined
15
in this work (Sect. 3.1), are given by:
1
γHO2 =
1
αHO2 +
3ωNA
8000(HeffRT)2keff[HO2(g)]rP
(4)
where
Heff=HHO2
"
1+ Keq [H+]
#
ACPD
14, 23763–23796, 2014Influence of clouds on the oxidising
capacity of the troposphere
L. K. Whalley et al.
Title Page
Abstract Introduction
Conclusions References
Tables Figures
◭ ◮
◭ ◮
Back Close
Full Screen / Esc
Printer-friendly Version Interactive Discussion
Discussion
P
a
per
|
Discus
sion
P
a
per
|
Discussion
P
a
per
|
Discussion
P
a
per
|
and
keff= k3+
K
eq
[H+]aq
k4
1+ Keq
[H+]aq
2 (6)
The values used in Eqs. (4)–(6) to calculateγHO2 are provided in Table 2.
2.4 Trajectory model
In addition to the modelling exercises, outlined in Sect. 2.2 above, an up-to-date
chem-5
istry process model, SPACCIM (SPectral Aerosol Cloud Chemistry Interaction Model, Wolke et al., 2005) has been used to simulate the gas phase HO2 radical
concen-trations along a trajectory during the mountain overflow of an air parcel passing an orographic hill cap cloud to further explore the heterogeneous loss processes occur-ring duoccur-ring the cloud events encountered. This model combines complex
microphysi-10
cal and detailed multiphase chemistry, permitting a detailed description of the chemical processing of gases, deliquesced particles and cloud droplets. SPACCIM incorporates the MCMv3.1-CAPRAMv3.0n mechanism (Master Chemical Mechanism (Saunders et al., 2003)/Chemical Aqueous Phase RAdical Mechanism, Tilgner et al., 2013; Brauer et al., 2013) with 11 381 gas phase and 777 aqueous phase reactions. The
MCMv3.1-15
CAPRAM3.0n mechanism incorporates a detailed description of the inorganic and or-ganic multiphase chemistry including phase transfer in deliquesced particles and cloud droplets based on a time-dependent size-resolved aerosol/cloud spectra. Further de-tails about the SPACCIM model framework and the chemical mechanisms are given elsewhere in the literature (Tilgner et al., 2013; Wolke et al., 2005; Sehili et al., 2005,
20
and references therein).
ACPD
14, 23763–23796, 2014Influence of clouds on the oxidising
capacity of the troposphere
L. K. Whalley et al.
Title Page
Abstract Introduction
Conclusions References
Tables Figures
◭ ◮
◭ ◮
Back Close
Full Screen / Esc
Printer-friendly Version Interactive Discussion
Discussion
P
a
per
|
Discus
sion
P
a
per
|
Discussion
P
a
per
|
Discussion
P
a
per
|
the MCM mechanism were performed to provide a more comprehensive initialisation of the chemical gas phase composition at the simulation start. SPACCIM simulations were performed with an air parcel advected along a predefined orography-following trajectory from the upwind site (Goldlauter) through the hill cap cloud, passing Mt. Schmücke (summit site), to the downwind site (Gehlberg). Parcel simulations were performed
5
every 20 min allowing a time-resolved comparison of the predicted and measured HO2
data at the summit site.
2.5 Global chemistry transport model
The GEOS-Chem model version 9.1.3 (www.geos-chem.org) has been run to assess the global impact of the uptake of HO2 by cloud droplets. The model was run at
10
2◦×2.5◦ global resolution for two years. The first year was considered a spin-up and
has been ignored. The standard model includes uptake of HO2onto aerosols (with an
uptake coefficient of 0.2), but, the model has been updated in this work to include an uptake of HO2 onto clouds. This is parameterized as a first order loss onto clouds in a similar way to that onto aerosols following Schwartz (1984) using the temperature
15
dependent parameterization of Thornton et al. (2008) with a cloud pH of 5. The cloud surface area is derived from the cloud liquid water in the each model grid box (provided from the meteorological analyses) and cloud droplet radius is taken to be 6 µm over continents and 10 µm over oceans. Clouds below 258 K are assumed to be ice and no uptake occurs. The parameterization takes diffusional limitation in the gas phase into
20
account but not in the cloud phase.
3 Results and discussion
Near continuous OH and HO2measurements were made at the Mt. Schmücke site from 13 September to 19 October 2010, during which 35 separate orographic cloud events were encountered which lasted as little as 24 min to more than 2 days in duration.
ACPD
14, 23763–23796, 2014Influence of clouds on the oxidising
capacity of the troposphere
L. K. Whalley et al.
Title Page
Abstract Introduction
Conclusions References
Tables Figures
◭ ◮
◭ ◮
Back Close
Full Screen / Esc
Printer-friendly Version Interactive Discussion
Discussion
P
a
per
|
Discus
sion
P
a
per
|
Discussion
P
a
per
|
Discussion
P
a
per
|
ure 2 shows the time-series of OH, HO2,j(O 1
D), NO, O3and liquid water content. OH
concentrations were close to or below the limit of detection (LOD) of the instrument for much of the measurement period. A clear diurnal signal was only observable when sev-eral days of data were averaged together outside of cloud events (Fig. 3). The peak OH concentration was observed at midday at∼1×10⁶molecule cm−3. No clear OH diurnal
5
profile was observed during cloud events. HO2 concentrations were variable depend-ing on whether the site was in cloud or not. The average diurnal peak concentration of HO2 was ∼4×10
7
molecule cm−3 outside of cloud events (Fig. 3). A diurnal pro-file of HO2 was also observed when sampling within clouds with peak concentrations reduced by approximately 90 % on average. The measured rate of ozone photolysis,
10
j(O1D), varied with time of day and cloud thickness. Daily peak photolysis rates were 8.8×10⁻⁶s−1and 3.6×10⁻⁶s−1 outside and within clouds, respectively. Clouds thus
reduced photolysis rates by∼70 %.
Figure 4 shows the dependence of measured HO2 concentration on cloud droplet
surface area. The observed HO2 concentration has been divided by the observed
15
j(O1D) to remove the impact of the changing photolysis rates within the cloud. This ratio has then been normalized to 1 when the droplet surface area was zero and plot-ted against the cloud droplet surface area. The decrease in the ratio with increasing droplet surface area suggests that in addition to the reduction in HO2 caused by a re-duction in the photolysis rates within clouds, there is a further loss process of HO2that
20
increases with cloud droplet surface area. A similar decrease in the ratio is also ob-served with increasing liquid water (not shown). From these observations it becomes apparent that a heterogeneous process must be occurring in the presence of clouds.
An insight into the mechanism by which HO2 is lost to clouds is demonstrated by
the dependence of the measured HO2 concentration as a function of cloud water pH
25
(Fig. 5a). Throughout the project the pH of the cloud water was recorded every hour and ranged from 3.4 to 5.3. The lowest in-cloud HO2 occurred in clouds with the highest
ACPD
14, 23763–23796, 2014Influence of clouds on the oxidising
capacity of the troposphere
L. K. Whalley et al.
Title Page
Abstract Introduction
Conclusions References
Tables Figures
◭ ◮
◭ ◮
Back Close
Full Screen / Esc
Printer-friendly Version Interactive Discussion
Discussion
P
a
per
|
Discus
sion
P
a
per
|
Discussion
P
a
per
|
Discussion
P
a
per
|
3.1 Determining the uptake coefficient for HO2to cloud droplets
The analytical expression derived by Carslaw et al. (1999), and given in Eq. (3), has been used to estimate HO2concentrations both in and out of cloud events (Fig. 6). The expression represents reasonably well the campaign mean diurnal observation of HO2
outside of the cloud events during the daytime (red dashed line and shading). During
5
cloud events, however, the model (black dashed line and shading) over-estimates the observed (grey line) HO2 throughout the day. The inclusion of a first order loss
pro-cess (kLoss=0.1 s− 1
) in the analytical expression is able to bring the observations and calculation into better agreement on average. The cloud droplet surface area was vari-able during the different cloud events encountered (1.2±0.4×103cm2m−3) although
10
no diurnal trend in this parameter was evident. A clear anti-correlation between the ob-served HO2concentration and droplet surface area was observed and this correlation
could only be reproduced by the analytical expression by increasingkLossin the model
from 1×10⁻⁴s−1to 2×10⁻¹s−1as the surface area increased from 1.2×102cm2m−3
to 1.5×103cm2m−3(Fig. 7).
15
This first order loss rate can be converted into an uptake coefficient (γHO2) using
Eq. (7) (Schwartz, 1984). Using campaign mean values for cloud surface area (A) of 1.2×103cm2m−3, droplet radius (rp) of 6 µm, gas phase diffusion constant for HO2
(Dg) of 0.25 cm 2
s−1, and molecular speed of HO2(ω) of 64 000 cm s− 1
gives an uptake coefficient of 0.0065; the uptake coefficient as a function of cloud droplet surface area
20
is presented in the upper panel of Fig. 7.
kloss= rp Dg
+γ 4
HO2ω
!−1
A (7)
These derived uptake coefficients are in good agreement with laboratory studies (Ab-batt et al., 2012), including recent measurements in our laboratory, which ranged be-tween 0.003–0.02, for heterogeneous loss of HO2on aqueous (NH4)2SO4, NaCl and
ACPD
14, 23763–23796, 2014Influence of clouds on the oxidising
capacity of the troposphere
L. K. Whalley et al.
Title Page
Abstract Introduction
Conclusions References
Tables Figures
◭ ◮
◭ ◮
Back Close
Full Screen / Esc
Printer-friendly Version Interactive Discussion
Discussion
P
a
per
|
Discus
sion
P
a
per
|
Discussion
P
a
per
|
Discussion
P
a
per
|
NH4NO3 sub-micron aerosols (George et al., 2013). This methodology provides, for the first time, a direct field assessment of the heterogeneous rate of loss of HO2.
Repeating this analysis but splitting the observations by cloud pH leads to values of
γHO2ranging from 1.65×10− 3
at a pH of 3.7 to 1.04×10⁻¹ at a pH of 5.2 (Fig. 5b).
These values are in good agreement with those calculated by Thornton et al. (2008)
5
suggesting that the Thornton mechanism (which is based entirely on the known aque-ous phase chemistry) is in play in real clouds and that it can be used to estimate the heterogeneous loss of HO2to cloud surfaces in the troposphere.
SPACCIM simulations (Wolke et al., 2005) have also been carried out, focussing on one particular cloud event which fulfilled the required meteorological and connected
10
flow conditions for the cloud passage experiment (additional simulations relating to the other cloud events encountered during HCCT will be presented in future publi-cations). The modelled and measured HO2 concentrations at Mt. Schmücke during
the cloud event, FCE1.1, are presented in Fig. 8. Comparisons between modelled and measured concentrations demonstrate the simulated HO2 concentrations are in
15
a similar range as the measurements. The mean simulated HO2 concentrations of
3.0×10⁶molecule cm−3 for FCE1.1 are a factor of 1.4 greater than the HO2
mea-surements which were, on average 2.2×10⁶molecule cm−3during this particular cloud
event. A further trajectory model simulation has been run and compared to measured HO2concentrations at Mt. Schmücke during a non-cloud event, NCE0.8, also. Figure 9
20
reveals that the model is able to reproduce the modelled HO2concentrations well and tracks the temporal concentration profile throughout this event. The mean predicted HO2concentration is just 24 % smaller than the measurements.
The agreement between the trajectory modelled and measured in-cloud HO2 val-ues confirms the significant reductions of radicals within clouds predicted by complex
25
multiphase box models in the past (Lelieveld and Crutzen, 1990; Tilgner et al., 2005, 2013) and supports the findings presented above. Importantly, the results imply that the phase transfer data for HO2 used within SPACCIM simulations, e.g. the applied
mass accommodation coefficient (αHO2=10− 2
re-ACPD
14, 23763–23796, 2014Influence of clouds on the oxidising
capacity of the troposphere
L. K. Whalley et al.
Title Page
Abstract Introduction
Conclusions References
Tables Figures
◭ ◮
◭ ◮
Back Close
Full Screen / Esc
Printer-friendly Version Interactive Discussion
Discussion
P
a
per
|
Discus
sion
P
a
per
|
Discussion
P
a
per
|
Discussion
P
a
per
|
duced HO2 concentrations for in-cloud conditions. These applied parameters control the uptake fluxes towards the aqueous phase and, ultimately, the aqueous phase HOx
levels. Confidence in the values assumed for these parameters is essential to model in-cloud oxidation within the aqueous phase accurately, with the multiphase chemistry of other important chemical subsystems, such as the S(IV) to S(VI) conversion, the
5
redox-cycling of transition metal ions and the processing of organic compounds all heavily dependent upon the values taken.
3.2 Global impact of the uptake of HO2onto cloud droplets
The GEOS-Chem Chemistry Transport Model (www.geos-chem.org) has been used to assess the impact of the uptake of HO2onto cloud droplets on the global oxidizing
10
capacity using the, now field-validated, mechanism of Thornton. To investigate both the impact of the uptake and whether H2O2 is produced three simulations are run, (i) with
no cloud uptake of HO2, (ii) with cloud uptake of HO2using the Thornton mechanism
to produce H2O2, and (iii) with cloud uptake of HO2 to produce H2O. All simulations include HO2 uptake onto aerosol with γHO2 of 0.2, which is the standard value used
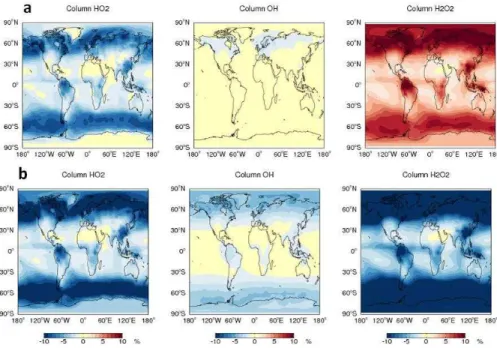
15
in GEOS-Chem (Macintyre and Evans, 2011). Figure 10 shows the annual fractional change in surface HO2, OH and H2O2concentrations with cloud uptake switched on, and with either H2O2 being produced or not. Column changes are shown in Fig. 11. Both with and without H2O2production, the impact is most evident in areas with long
HO2 lifetimes, i.e. regions with low NOx and low HO2 concentrations. These are
con-20
centrated in the extra-tropics with up to 25 % and 10 % reduction in surface and col-umn concentrations respectively. The impact on the H2O2concentration depends
crit-ically on whether H2O2 is produced or not within clouds. In the extra-tropics there are
up to 30 % increases in surface H2O2 if it is produced with a similar reduction if it is not. The impact on surface extra-tropical oxidizing capacity (OH) are of the order 10–
25
ACPD
14, 23763–23796, 2014Influence of clouds on the oxidising
capacity of the troposphere
L. K. Whalley et al.
Title Page
Abstract Introduction
Conclusions References
Tables Figures
◭ ◮
◭ ◮
Back Close
Full Screen / Esc
Printer-friendly Version Interactive Discussion
Discussion
P
a
per
|
Discus
sion
P
a
per
|
Discussion
P
a
per
|
Discussion
P
a
per
|
this field campaign may offer a substantial perturbation to the oxidizing capacity of the atmosphere, especially in the extra-tropics.
4 Conclusions
We have shown here experimentally for the first time that the uptake of HO2onto clouds can have a significant impact on the composition of the atmosphere in a way
con-5
sistent with theoretical predictions. It seems likely, however, that chemistry occurring within clouds will have other currently unknown impacts on the composition of the at-mosphere. Global and regional models need to be developed further to investigate these impacts with predictive pH an especially important development. The impact of these processes may also change in the future with climate induced impacts on the
10
hydrological cycle. Further laboratory, field studies and modelling are required to help resolve these remaining complex questions.
Acknowledgements. The authors would like to thank Trevor Ingham, John Spence and Matthew Broadbent for help with the development of the FAGE instrument to facilitate tower measure-ments. HCCT-2010 was partially funded by the German Research Foundation (DFG), grant
15
He 3086/15-1. SM participation was funded by DFG, grant ME-3534/1-2. LW, DS, IG, ME and DH are grateful to the Natural Environment Research Council for funding.
References
Abbatt, J. P. D., Lee, A. K. Y., and Thornton, J. A.: Quantifying trace gas uptake to tropo-spheric aerosol: recent advances and remaining challenges, Chem. Soc. Rev., 41, 6555–
20
6581, doi:10.1039/C2cs35052a, 2012.
Bielski, B. H. J., Cabelli, D. E., Arudi, R. L., and Ross, A. B.: Reactivity of HO2/O2radicals in aqueous solution, J. Phys. Chem. Ref. Data, 14, 1041–1100, doi:10.1063/1.555739, 1985. Bohn, B., Corlett, G. K., Gillmann, M., Sanghavi, S., Stange, G., Tensing, E., Vrekoussis, M.,
Bloss, W. J., Clapp, L. J., Kortner, M., Dorn, H.-P., Monks, P. S., Platt, U., Plass-Dülmer, C.,
ACPD
14, 23763–23796, 2014Influence of clouds on the oxidising
capacity of the troposphere
L. K. Whalley et al.
Title Page
Abstract Introduction
Conclusions References
Tables Figures
◭ ◮
◭ ◮
Back Close
Full Screen / Esc
Printer-friendly Version Interactive Discussion
Discussion
P
a
per
|
Discus
sion
P
a
per
|
Discussion
P
a
per
|
Discussion
P
a
per
|
Mihalopoulos, N., Heard, D. E., Clemitshaw, K. C., Meixner, F. X., Prevot, A. S. H., and Schmitt, R.: Photolysis frequency measurement techniques: results of a comparison within the ACCENT project, Atmos. Chem. Phys., 8, 5373–5391, doi:10.5194/acp-8-5373-2008, 2008.
Brauer, P., Tilgner, A., Wolke, R., and Herrmann, H.: Mechanism development and modelling
5
of tropospheric multiphase halogen chemistry: the CAPRAM Halogen Module 2.0 (HM2), J. Atmos. Chem., 70, 19–52, doi:10.1007/s10874-013-9249-6, 2013.
Carslaw, N., Jacobs, P. J., and Pilling, M. J.: Modeling OH, HO2, and RO2radicals in the marine boundary layer 2. Mechanism reduction and uncertainty analysis, J. Geophys. Res.-Atmos., 104, 30257–30273, doi:10.1029/1999jd900782, 1999.
10
Commane, R., Floquet, C. F. A., Ingham, T., Stone, D., Evans, M. J., and Heard, D. E.: Ob-servations of OH and HO2radicals over West Africa, Atmos. Chem. Phys., 10, 8783–8801, doi:10.5194/acp-10-8783-2010, 2010.
Emmerson, K. M., Carslaw, N., Carslaw, D. C., Lee, J. D., McFiggans, G., Bloss, W. J., Grave-stock, T., Heard, D. E., Hopkins, J., Ingham, T., Pilling, M. J., Smith, S. C., Jacob, M., and
15
Monks, P. S.: Free radical modelling studies during the UK TORCH Campaign in Summer 2003, Atmos. Chem. Phys., 7, 167–181, doi:10.5194/acp-7-167-2007, 2007.
Fuchs, H., Bohn, B., Hofzumahaus, A., Holland, F., Lu, K. D., Nehr, S., Rohrer, F., and Wah-ner, A.: Detection of HO2by laser-induced fluorescence: calibration and interferences from RO2radicals, Atmos. Meas. Tech., 4, 1209–1225, doi:10.5194/amt-4-1209-2011, 2011.
20
George, I. J., Matthews, P. S. J., Whalley, L. K., Brooks, B., Goddard, A., Romero, M. T. B., and Heard, D. E.: Measurements of uptake coefficients for heterogeneous loss of HO2onto submicron inorganic salt aerosols, Phys. Chem. Chem. Phys., 15, 12859–12845, 2013. Haggerstone, A. L., Carpenter, L. J., Carslaw, N., and McFiggans, G.: Improved model
predic-tions of HO2with gas to particle mass transfer rates calculated using aerosol number size
25
distributions, J. Geophys. Res.-Atmos., 110, D04304, doi:10.1029/2004jd005282, 2005. Hanson, D. R., Burkholder, J. B., Howard, C. J., and Ravishankara, A. R.: Measurement of OH
and HO2radical uptake coefficients on water and sulfuric-acid surfaces, J. Phys. Chem., 96, 4979–4985, doi:10.1021/J100191a046, 1992.
Herrmann, H., Wolke, R., Muller, K., Bruggemann, E., Gnauk, T., Barzaghi, P., Mertes, S.,
30
ACPD
14, 23763–23796, 2014Influence of clouds on the oxidising
capacity of the troposphere
L. K. Whalley et al.
Title Page
Abstract Introduction
Conclusions References
Tables Figures
◭ ◮
◭ ◮
Back Close
Full Screen / Esc
Printer-friendly Version Interactive Discussion
Discussion
P
a
per
|
Discus
sion
P
a
per
|
Discussion
P
a
per
|
Discussion
P
a
per
|
Tilgner, A., Diehl, K., Heinold, B., Hinneburg, D., Knoth, O., Sehili, A. M., Simmel, M., Wur-zler, S., Majdik, Z., Mauersberger, G., and Muller, F.: FEBUKO and MODMEP: field mea-surements and modelling of aerosol and cloud multiphase processes, Atmos. Environ., 39, 4169–4183, doi:10.1016/j.atmosenv.2005.02.004, 2005.
Huijnen, V., Williams, J. E., and Flemming, J.: Modeling global impacts of heterogeneous loss
5
of HO2 on cloud droplets, ice particles and aerosols, Atmos. Chem. Phys. Discuss., 14, 8575–8632, doi:10.5194/acpd-14-8575-2014, 2014.
Jacob, D. J.: Heterogeneous chemistry and tropospheric ozone, Atmos. Environ., 34, 2131– 2159, doi:10.1016/S1352-2310(99)00462-8, 2000.
Lelieveld, J. and Crutzen, P. J.: Influences of cloud photochemical processes on tropospheric
10
ozone, Nature, 343, 227–233, doi:10.1038/343227a0, 1990.
Macintyre, H. L. and Evans, M. J.: Parameterisation and impact of aerosol uptake of HO2 on a global tropospheric model, Atmos. Chem. Phys., 11, 10965–10974, doi:10.5194/acp-11-10965-2011, 2011.
Madronich, S. and Flocke, S.: The role of solar radiation in atmospheric chemistry, in: Handbook
15
of Environmental Chemistry, edited by: Boule, P., Springer, New York, 1–26, 1998.
Mao, J., Fan, S., Jacob, D. J., and Travis, K. R.: Radical loss in the atmosphere from Cu-Fe redox coupling in aerosols, Atmos. Chem. Phys., 13, 509–519, doi:10.5194/acp-13-509-2013, 2013.
Mauldin, R. L., Madronich, S., Flocke, S. J., Eisele, F. L., Frost, G. J., and Prevot, A. S. H.: New
20
insights on OH: Measurements around and in clouds, Geophys. Res. Lett., 24, 3033–3036, doi:10.1029/97gl02983, 1997.
Mauldin, R. L., Frost, G. J., Chen, G., Tanner, D. J., Prevot, A. S. H., Davis, D. D., and Eisele, F. L.: OH measurements during the first Aerosol Characterization Experiment (ACE 1): observations and model comparisons, J. Geophys. Res.-Atmos., 103, 16713–
25
16729, doi:10.1029/98jd00882, 1998.
Nimmo, M. and Fones, G. R.: The potential pool of Co, Ni, Cu, Pb and Cd organic complexing ligands in coastal and urban rain waters, Atmos. Environ., 31, 693–702, doi:10.1016/S1352-2310(96)00243-9, 1997.
Olson, J. R., Crawford, J. H., Chen, G., Fried, A., Evans, M. J., Jordan, C. E., Sandholm, S. T.,
30
Test-ACPD
14, 23763–23796, 2014Influence of clouds on the oxidising
capacity of the troposphere
L. K. Whalley et al.
Title Page
Abstract Introduction
Conclusions References
Tables Figures
◭ ◮
◭ ◮
Back Close
Full Screen / Esc
Printer-friendly Version Interactive Discussion
Discussion
P
a
per
|
Discus
sion
P
a
per
|
Discussion
P
a
per
|
Discussion
P
a
per
|
ing fast photochemical theory during TRACE-P based on measurements of OH, HO2, and CH2O, J. Geophys. Res.-Atmos., 109, D15s10, doi:10.1029/2003jd004278, 2004.
Saunders, S. M., Jenkin, M. E., Derwent, R. G., and Pilling, M. J.: Protocol for the development of the Master Chemical Mechanism, MCM v3 (Part A): tropospheric degradation of non-aromatic volatile organic compounds, Atmos. Chem. Phys., 3, 161–180,
doi:10.5194/acp-3-5
161-2003, 2003.
Schwartz, S. E.: Gas-phase and aqueous-phase chemistry of HO2 in liquid water clouds, J. Geophys. Res.-Atmos., 89, 1589–1598, doi:10.1029/Jd089id07p11589, 1984.
Sehili, A. M., Wolke, R., Knoth, O., Simmel, M., Tilgner, A., and Herrmann, H.: Comparison of different model approaches for the simulation of multiphase processes, Atmos. Environ., 39,
10
4403–4417, doi:10.1016/j.atmosenv.2005.02.039, 2005.
Smith, S. C., Lee, J. D., Bloss, W. J., Johnson, G. P., Ingham, T., and Heard, D. E.: Concentra-tions of OH and HO2radicals during NAMBLEX: measurements and steady state analysis, Atmos. Chem. Phys., 6, 1435–1453, doi:10.5194/acp-6-1435-2006, 2006.
Sommariva, R., Haggerstone, A.-L., Carpenter, L. J., Carslaw, N., Creasey, D. J., Heard, D. E.,
15
Lee, J. D., Lewis, A. C., Pilling, M. J., and Zádor, J.: OH and HO2chemistry in clean marine air during SOAPEX-2, Atmos. Chem. Phys., 4, 839–856, doi:10.5194/acp-4-839-2004, 2004. Spokes, L. J., Campos, M. L. A. M., and Jickells, T. D.: The role of organic matter in
control-ling copper speciation in precipitation, Atmos. Environ., 30, 3959–3966, doi:10.1016/1352-2310(96)00125-2, 1996.
20
Taketani, F., Kanaya, Y., and Akimoto, H.: Kinetics of heterogeneous reactions of HO2radical at ambient concentration levels with (NH4)2SO4and NaCl aerosol particles, J. Phys. Chem. A, 112, 2370–2377, doi:10.1021/Jp0769936, 2008.
Thornton, J. and Abbatt, J. P. D.: Measurements of HO2 uptake to aqueous aerosol: mass accommodation coefficients and net reactive loss, J. Geophys. Res.-Atmos., 110, D08309,
25
doi:10.1029/2004jd005402, 2005.
Thornton, J. A., Jaegle, L., and McNeill, V. F.: Assessing known pathways for HO2loss in aque-ous atmospheric aerosols: regional and global impacts on tropospheric oxidants, J. Geophys. Res.-Atmos., 113, D05303, doi:10.1029/2007jd009236, 2008.
Tilgner, A., Majdik, Z., Sehili, A. M., Simmel, M., Wolke, R., and Herrmann, H.: SPACCIM:
30
ACPD
14, 23763–23796, 2014Influence of clouds on the oxidising
capacity of the troposphere
L. K. Whalley et al.
Title Page
Abstract Introduction
Conclusions References
Tables Figures
◭ ◮
◭ ◮
Back Close
Full Screen / Esc
Printer-friendly Version Interactive Discussion
Discussion
P
a
per
|
Discus
sion
P
a
per
|
Discussion
P
a
per
|
Discussion
P
a
per
|
Tilgner, A., Brauer, P., Wolke, R., and Herrmann, H.: Modelling multiphase chemistry in deliquescent aerosols and clouds using CAPRAM3.0i, J. Atmos. Chem., 70, 221–256, doi:10.1007/s10874-013-9267-4, 2013.
Whalley, L. K., Furneaux, K. L., Goddard, A., Lee, J. D., Mahajan, A., Oetjen, H., Read, K. A., Kaaden, N., Carpenter, L. J., Lewis, A. C., Plane, J. M. C., Saltzman, E. S., Wiedensohler, A.,
5
and Heard, D. E.: The chemistry of OH and HO2radicals in the boundary layer over the trop-ical Atlantic Ocean, Atmos. Chem. Phys., 10, 1555–1576, doi:10.5194/acp-10-1555-2010, 2010.
Whalley, L. K., Blitz, M. A., Desservettaz, M., Seakins, P. W., and Heard, D. E.: Reporting the sensitivity of laser-induced fluorescence instruments used for HO2detection to an
interfer-10
ence from RO2radicals and introducing a novel approach that enables HO2and certain RO2 types to be selectively measured, Atmos. Meas. Tech., 6, 3425–3440, doi:10.5194/amt-6-3425-2013, 2013.
Wolke, R., Sehili, A. M., Simmel, M., Knoth, O., Tilgner, A., and Herrmann, H.: SPACCIM: a par-cel model with detailed microphysics and complex multiphase chemistry, Atmos. Environ., 39,
15
ACPD
14, 23763–23796, 2014Influence of clouds on the oxidising
capacity of the troposphere
L. K. Whalley et al.
Title Page
Abstract Introduction
Conclusions References
Tables Figures
◭ ◮
◭ ◮
Back Close
Full Screen / Esc
Printer-friendly Version Interactive Discussion
Discussion
P
a
per
|
Discus
sion
P
a
per
|
Discussion
P
a
per
|
Discussion
P
a
per
|
Table 1.Details of ancillary measurements used for comparison with radical observations and cubic model constraints.
Measurement Instrument
Liquid Water Content Gerber particle volume monitor Particle Surface Area (drops) Gerber particle volume monitor Effective Drop Radius Gerber particle volume monitor
Temperature Automatic weather station
Relative Humidity Automatic weather station
j(O1D) Filter Radiometer
Cloud droplet pH Mettler 405-60 88TE-S7/120
NOx Chemiluminescence detector
O3 TEI 42c, UV absorption
CO Thermo Electron CO analyser
ACPD
14, 23763–23796, 2014Influence of clouds on the oxidising
capacity of the troposphere
L. K. Whalley et al.
Title Page
Abstract Introduction
Conclusions References
Tables Figures
◭ ◮
◭ ◮
Back Close
Full Screen / Esc
Printer-friendly Version Interactive Discussion
Discussion
P
a
per
|
Discus
sion
P
a
per
|
Discussion
P
a
per
|
Discussion
P
a
per
|
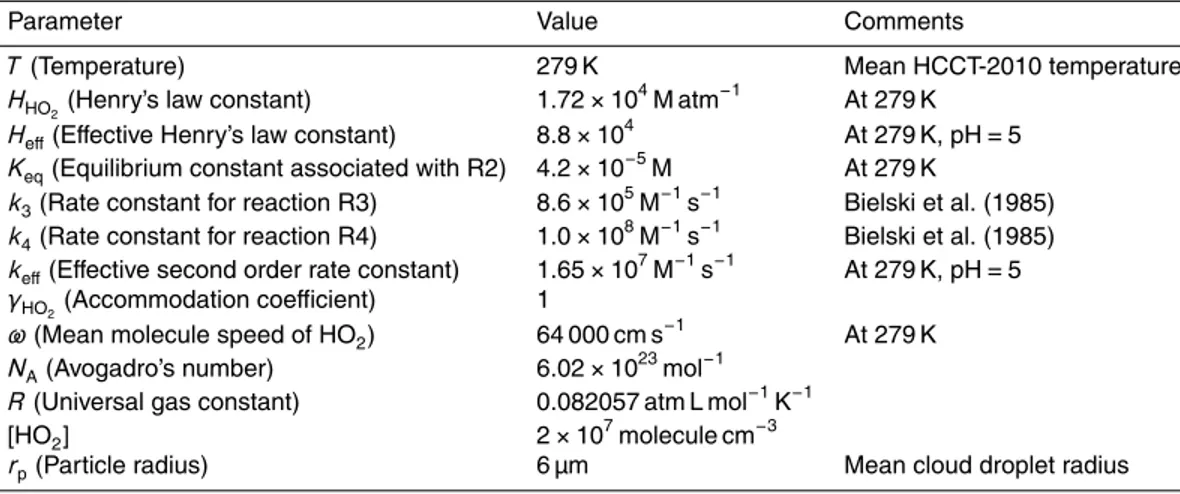
Table 2.The values used for the calculation of the theoretical uptake coefficient, black triangles, Fig. 5b, as a function of pH; values given at a pH=5 here.
Parameter Value Comments
T(Temperature) 279 K Mean HCCT-2010 temperature
HHO2(Henry’s law constant) 1.72×10 4
M atm−1
At 279 K Heff(Effective Henry’s law constant) 8.8×10
4
At 279 K, pH=5 Keq(Equilibrium constant associated with R2) 4.2×10−
5
M At 279 K
k3(Rate constant for reaction R3) 8.6×10 5
M−1 s−1
Bielski et al. (1985) k4(Rate constant for reaction R4) 1.0×10
8 M−1
s−1
Bielski et al. (1985) keff(Effective second order rate constant) 1.65×10
7 M−1
s−1
At 279 K, pH=5 γHO2(Accommodation coefficient) 1
ω(Mean molecule speed of HO2) 64 000 cm s− 1
At 279 K NA(Avogadro’s number) 6.02×10
23 mol−1
R(Universal gas constant) 0.082057 atm L mol−1 K−1
[HO2] 2×10
7
molecule cm−3
ACPD
14, 23763–23796, 2014Influence of clouds on the oxidising
capacity of the troposphere
L. K. Whalley et al.
Title Page
Abstract Introduction
Conclusions References
Tables Figures
◭ ◮
◭ ◮
Back Close
Full Screen / Esc
Printer-friendly Version Interactive Discussion
Discussion
P
a
per
|
Discus
sion
P
a
per
|
Discussion
P
a
per
|
Discussion
P
a
per
|
2010 campaign. ‘PD’
ACPD
14, 23763–23796, 2014Influence of clouds on the oxidising
capacity of the troposphere
L. K. Whalley et al.
Title Page
Abstract Introduction
Conclusions References
Tables Figures
◭ ◮
◭ ◮
Back Close
Full Screen / Esc
Printer-friendly Version Interactive Discussion
Discussion
P
a
per
|
Discus
sion
P
a
per
|
Discussion
P
a
per
|
Discussion
P
a
per
|
(coloured). The error bars represent the 1σ variability of the averaged data; only the
ACPD
14, 23763–23796, 2014Influence of clouds on the oxidising
capacity of the troposphere
L. K. Whalley et al.
Title Page
Abstract Introduction
Conclusions References
Tables Figures
◭ ◮
◭ ◮
Back Close
Full Screen / Esc
Printer-friendly Version Interactive Discussion
Discussion
P
a
per
|
Discus
sion
P
a
per
|
Discussion
P
a
per
|
Discussion
P
a
per
|
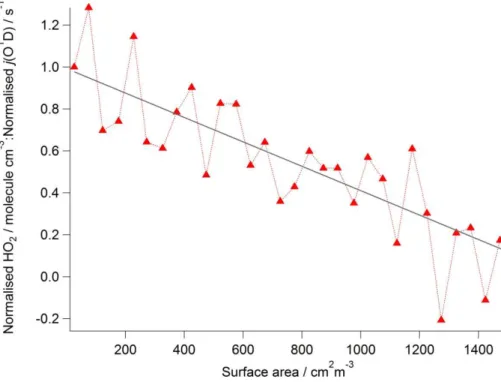
Figure 4.The dependence of the measured HO2concentration as a function of cloud droplet surface area. To remove the influence of changing photolysis rates the measured HO2 con-centrations have been divided by the correspondingly observed rate of photolysis of ozone (j(O1D)). This ratio has then been normalized to give a value of 1 when the droplet surface area was zero. The systematic decrease in this normalised ratio with increasing droplet surface area suggests that in addition to the reduction in HO2caused by a reduction in the photolysis rates within clouds, there is a further loss process that increases with cloud droplet surface area. The ratio decreases linearly with increasing droplet surface area up to 1500 cm2m−3
ACPD
14, 23763–23796, 2014Influence of clouds on the oxidising
capacity of the troposphere
L. K. Whalley et al.
Title Page
Abstract Introduction
Conclusions References
Tables Figures
◭ ◮
◭ ◮
Back Close
Full Screen / Esc
Printer-friendly Version Interactive Discussion
Discussion
P
a
per
|
Discus
sion
P
a
per
|
Discussion
P
a
per
|
Discussion
P
a
per
|
γ
a b
Figure 5. (a)Dependence of the HO2 concentration observed in cloud as a function of cloud pH. All in-cloud HO2data were averaged into corresponding pH bins (0.6 pH units). The [HO2] decreases exponentially with increasing pH with the line of best fit ([HO2]=3.8×10⁵+5.5× 10⁹exp−2.2pH
ACPD
14, 23763–23796, 2014Influence of clouds on the oxidising
capacity of the troposphere
L. K. Whalley et al.
Title Page
Abstract Introduction
Conclusions References
Tables Figures
◭ ◮
◭ ◮
Back Close
Full Screen / Esc
Printer-friendly Version Interactive Discussion
Discussion
P
a
per
|
Discus
sion
P
a
per
|
Discussion
P
a
per
|
Discussion
P
a
per
|
The shading highlights the sensitivity of the model to ± 1σ changes in the CO and HCHO
shading highlights the sensitivity of the model to ± 1σ changes in the CO and HCHO Figure 6. Upper panel. Average measured (solid red line) and simulated (dashed red line) diurnal profile of HO2concentrations outside of cloud events. The simulation is based on an ex-pression originally determined by Carslaw et al. (1999) and described further in Sect. 2.2. The shading highlights the sensitivity of the model to±1σchanges in the CO and HCHO concen-trations used as constraints. Lower panel. Average measured (solid grey line) and modelled (dashed black and blue lines) diurnal profile of HO2 concentration during cloud events. The model was run without (grey) and with (blue) a loss of HO2 to cloud droplets equal to a first order loss rate of 0.1 s−1. The shading highlights the sensitivity of the model to±1σchanges in the CO and HCHO concentrations used as constraints.
ACPD
14, 23763–23796, 2014Influence of clouds on the oxidising
capacity of the troposphere
L. K. Whalley et al.
Title Page
Abstract Introduction
Conclusions References
Tables Figures
◭ ◮
◭ ◮
Back Close
Full Screen / Esc
Printer-friendly Version Interactive Discussion
Discussion
P
a
per
|
Discus
sion
P
a
per
|
Discussion
P
a
per
|
Discussion
P
a
per
|
Figure 7.Lower panel. The dependence of the measured HO2concentration (grey circles) and modelled HO2concentration with a variable first order loss (red squares) as a function of cloud droplet surface area. Middle panel. The dependence of the first order loss term used in the model expression to best replicate the observed in-cloud HO2as a function cloud droplet sur-face area. The line of best fit being (kLoss=1±0.1×10⁻⁴
×SA). Upper panel. The dependence
of γHO
2 calculated using Eq. (7) as a function of cloud droplet surface area and constrained with the variable first order loss term as shown in the middle panel. The line of best fit being (γHO2=9.1±0.7×10⁻⁶×SA).
ACPD
14, 23763–23796, 2014Influence of clouds on the oxidising
capacity of the troposphere
L. K. Whalley et al.
Title Page
Abstract Introduction
Conclusions References
Tables Figures
◭ ◮
◭ ◮
Back Close
Full Screen / Esc
Printer-friendly Version Interactive Discussion
Discussion
P
a
per
|
Discus
sion
P
a
per
|
Discussion
P
a
per
|
Discussion
P
a
per
|
![Figure 2. Time-series showing the average liquid water content during each cloud episode (blue, horizontal lines), [OH] (purple), [HO 2 ] (red), j(O 1 D) (orange), NO (green) and O 3 (grey).](https://thumb-eu.123doks.com/thumbv2/123dok_br/16375166.191419/25.918.101.626.90.474/figure-series-showing-average-liquid-content-episode-horizontal.webp)