AMTD
7, 8233–8270, 2014Performance of a high-resolution X-band weather radar
network – the PATTERN example
K. Lengfeld et al.
Title Page
Abstract Introduction
Conclusions References
Tables Figures
◭ ◮
◭ ◮
Back Close
Full Screen / Esc
Printer-friendly Version
Interactive Discussion
Discussion
P
a
per
|
Discus
sion
P
a
per
|
Discussion
P
a
per
|
Discussion
P
a
per
|
Atmos. Meas. Tech. Discuss., 7, 8233–8270, 2014 www.atmos-meas-tech-discuss.net/7/8233/2014/ doi:10.5194/amtd-7-8233-2014
© Author(s) 2014. CC Attribution 3.0 License.
This discussion paper is/has been under review for the journal Atmospheric Measurement Techniques (AMT). Please refer to the corresponding final paper in AMT if available.
Performance of high-resolution X-band
weather radar networks – the PATTERN
example
K. Lengfeld1, M. Clemens1, H. Münster2, and F. Ament1
1
Meteorological Institute of the University of Hamburg, Hamburg, Germany
2
Max-Planck-Institute for Meteorology, Hamburg, Germany
Received: 25 July 2014 – Accepted: 25 July 2014 – Published: 8 August 2014
Correspondence to: K. Lengfeld ([email protected])
AMTD
7, 8233–8270, 2014Performance of a high-resolution X-band weather radar
network – the PATTERN example
K. Lengfeld et al.
Title Page
Abstract Introduction
Conclusions References
Tables Figures
◭ ◮
◭ ◮
Back Close
Full Screen / Esc
Printer-friendly Version
Interactive Discussion
Discussion
P
a
per
|
Discus
sion
P
a
per
|
Discussion
P
a
per
|
Discussion
P
a
per
|
Abstract
This publication intends to proof that a network of low-cost local area weather radars (LAWR) is a reliable and scientifically valuable complement to nationwide radar net-works. A network of four LAWRs has been installed in northern Germany within the framework of the project Precipitation and Attenuation Estimates from a High-5
Resolution Weather Radar Network (PATTERN) observing precipitation with temporal resolution of 30 s, azimuthal resolution of 1◦and spatial resolution of 60 m. The network covers an area of 60 km×80 km. In this paper algorithms used to obtain undisturbed precipitation fields from raw reflectivity data are described and their performance is analysed. In order to correct for background noise in reflectivity measurements
oper-10
ationally, noise level estimates from the measured reflectivity field is combined with noise levels from the last 10 time steps. For detection of non-meteorological echoes two different kinds of clutter filters are applied: single radar algorithms and network based algorithms that take advantage of the unique features of high temporal and spa-tial resolution of the network. Overall the network based clutter filter works best with
15
a detection rate of up to 70 %, followed by the classic TDBZ filter using the texture of the logarithmic reflectivity field.
A comparison of a reflectivity field from the PATTERN network with the product from a C-band radar operated by the German Meteorological Service indicates high spa-tial accordance of both systems in geographical position of the rain event as well as
20
reflectivity maxima. A longterm study derives good accordance of X-band radar of the network with C-band radar. But especially at the border of precipitation events the stan-dard deviation within a range gate of the C-band radar with range resolution of 1 km is up to 3 dBZ. Therefore, a network of high-resolution low-cost LAWRs can give valuable information on the small scale structure of rain events in areas of special interest, e.g.
25
urban regions, in addition the nationwide radar networks.
AMTD
7, 8233–8270, 2014Performance of a high-resolution X-band weather radar
network – the PATTERN example
K. Lengfeld et al.
Title Page
Abstract Introduction
Conclusions References
Tables Figures
◭ ◮
◭ ◮
Back Close
Full Screen / Esc
Printer-friendly Version
Interactive Discussion
Discussion
P
a
per
|
Discus
sion
P
a
per
|
Discussion
P
a
per
|
Discussion
P
a
per
|
1 Introduction
Flood forecasting, urban hydrology, hydrometeorological applications and management of risk and uncertainty require high-resolution spatial and temporal rainfall estimates near the ground with less than 0.1 km and 1 min, respectively (Einfalt, 2003). There-fore, radar systems capable of producing reliable and accurate quantitative estimates
5
of precipitation at high temporal and spatial resolution are needed. Rainfall products of conventional radar systems used in nationwide or even larger networks are gen-erally based on reflectivity measurements at S- or C-band frequencies with temporal resolution of several minutes and spatial resolution of a few hundred metres.
To meet present and future demands of resolution, radar observations at shorter
10
wavelengths are a promising option as the resolution depends, among other factors, on the width of the antenna and the wavelength. Therefore, recent studies support ob-servations at X-band frequencies as an alternative or an addition to S- and C-band (Lengfeld et al., 2013; Trabal et al., 2013) to fulfil the requirements of urban drainage system modeling as input for rainfall-runoff models of rural river systems, hydraulic
15
simulations, insurance proof, detailed information on extreme events and many more. Besides higher resolution, radars operating at high frequencies benefit from lower costs resulting from smaller antenna size compared to long-wave radars (Bringi et al., 1990). X-band radars can also derive reliable precipitation estimates close to the ground due to their relatively short range. S- or C-band radars measure within a range of
hun-20
dreds of kilometers. Therefore, they cannot observe rainfall near the ground because the radar beam increases in height with increasing distance to the radar due to the ele-vation angle and the earth’s curvature. Measurements taken in a few kilometers height above the earth’s surface need to be extrapolated to give an estimation of rainfall at the ground. These techniques are limited and imprecise leading to large uncertainties
25
in estimated reflectivity.
AMTD
7, 8233–8270, 2014Performance of a high-resolution X-band weather radar
network – the PATTERN example
K. Lengfeld et al.
Title Page
Abstract Introduction
Conclusions References
Tables Figures
◭ ◮
◭ ◮
Back Close
Full Screen / Esc
Printer-friendly Version
Interactive Discussion
Discussion
P
a
per
|
Discus
sion
P
a
per
|
Discussion
P
a
per
|
Discussion
P
a
per
|
paths where the specific attenuation at any distance depends on the size distribution of raindrops and their extinction cross-section. The magnitude of attenuation is generally inverse to the wavelength and the specific attenuation at X-band is approximately two orders of magnitude higher than at S-band according to Doviak and Zrnic (1993). While the effect of attenuation at S-band is practically negligible, it becomes increasingly
se-5
rious as the wavelength is reduced and corrections have to be applied for retrieving intrinsic reflectivity. The basics of microwave attenuation by rain has already been dis-cussed by many authors, e.g. Atlas and Banks (1951), Hitschfeld and Bordan (1954), Gunn and East (1954), Wexler and Atlas (1963), Dutton (1967) and Atlas and Ulbrich (1977), to mention the earliest.
10
To overcome the apparent drawback of strong attenuation at X-band frequencies, several authors introduced concepts of overlapping radar networks consisting of two or more radars. These methods allow for estimation of attenuation and correction of observed reflectivities simultaneously, if at least two radars observe a common volume (Testud and Amayenc, 1989; Kabeche and Testud, 1995; Srivastava and Tian, 1996;
15
Tian and Srivastava, 1997; Chandrasekar and Lim, 2008; Lim et al., 2011).
In the last years several networks consisting of different types of X-band radars have been installed to fill gaps in nationwide networks of C- or S-band radars, e.g. within the project Collaborative Adaptive Sensing of the Atmosphere CASA (Trabal et al., 2013; Mahale et al., 2014), in complex terrain or in areas where detailed information
20
on rainfall is of high interest, e.g. near airports (Turso et al., 2009), in mountaineous regions (Beck and Bousquet, 2013; Shakti et al., 2013; Ventura and Tabary, 2013) or in flood-prone areas (Matrosov et al., 2013) to name a few of them.
Comparing the existing X-band radar networks, one can distinguish between two different approaches. On the one hand there are highly sensitive X-band weather radar
25
systems featuring dual polarisation as standard with a peak power of about 75 kW and a typical antenna size of 2.5 m in diameter. The maximum range is in the order of 100 km with a range resolution of 20 m. On the other hand there is an increasing number of low-cost systems mainly based on conventional nautical radar systems with
AMTD
7, 8233–8270, 2014Performance of a high-resolution X-band weather radar
network – the PATTERN example
K. Lengfeld et al.
Title Page
Abstract Introduction
Conclusions References
Tables Figures
◭ ◮
◭ ◮
Back Close
Full Screen / Esc
Printer-friendly Version
Interactive Discussion
Discussion
P
a
per
|
Discus
sion
P
a
per
|
Discussion
P
a
per
|
Discussion
P
a
per
|
a peak power of 25 kW. These systems are characterised by small antenna diameters with less than 1 m and, in general, they are not capable of performing measurements in Doppler or dual-polarisation mode. The maximum range of these low-cost radars is in the order of 20 km with range resolution similar to the former X-band radar type. Due to their limited range they are often called local area weather radars (LAWR).
5
A network of four LAWRs is installed in northern Germany within the framework of the project Precipitation and Attenuation Estimates from a High-Resolution Weather Radar Network (PATTERN). The goal is to demonstrate that low-cost radar systems are a scientifically valuable tool to investigate spatial structure of precipitation and a network of LAWRs can be used to correct for enhanced attenuation. The network
10
approach based on high-resolution X-band radars has two definite advantages com-pared to large scale C-band radar networks: gain of additional information arises from high resolution (temporal and spatial) as well as the wide overlapping areas of multiple coverage. The former results from the technical specifications of the X-band radar itself, e.g. wavelength, rotational speed of the antenna, pulse length and repitition frequency.
15
The latter is based on the network set-up, that is not designed to cover an area as large as possible like nationwide C-band radar networks but to create large overlapping ar-eas covered by multiple radars. Overall these advantages could not only lead to better attenuation estimates but also to approvements in several retrievals regarding clutter detection, gap filling and finally the estimation of precipitation. In addition, the X-band
20
radars provide precipitation estimates near the ground (McLaughlin et al., 2009) due to their relatively short maximum range.
The aim of this paper is to identify advantages and disadvantages of the network as well as single X-band radars and present algorithms making use of the network ap-proach and the X-band specific characteristics. The X-band radars used in this study
25
AMTD
7, 8233–8270, 2014Performance of a high-resolution X-band weather radar
network – the PATTERN example
K. Lengfeld et al.
Title Page
Abstract Introduction
Conclusions References
Tables Figures
◭ ◮
◭ ◮
Back Close
Full Screen / Esc
Printer-friendly Version
Interactive Discussion
Discussion
P
a
per
|
Discus
sion
P
a
per
|
Discussion
P
a
per
|
Discussion
P
a
per
|
overlapping areas within the network. A comparison with a dual polarised C-band radar operated by the German Meteorological Service (DWD) in Sect. 4 gives a first evalua-tion of the quality of precipitaevalua-tion fields derived from the PATTERN network. In Sect. 5 conclusions are drawn and Sect. 6 gives an outlook on future work.
2 Radar network
5
Within the framework of the project PATTERN, a network of four X-band radars (Hun-griger Wolf Tower (HWT), Quarnstedt (QNS), Bekmünde (BKM) and Moordorf (MOD)) has been set up in the north of Hamburg, Germany (Fig. 1, Lengfeld et al., 2012). Each has a range of 20 km in radius around the site to detect reflectivity. The network spans a region of approximately 60 km×80 km. Two radars are at least 11 km, but not more
10
than 16 km apart. Based on the network design a large area is covered by at least two radars at the border and up to four radars in the centre of the network. Additionally, micro rain radars (MRR) at each radar site complement the network. These vertically profiling K-band radars measure Doppler spectra of hydrometeors at 31 height levels. From these spectra drop size distibutions at each height level and, finally, reflectivity as
15
well as rain rate profiles are derived (Peters et al., 2005). To calibrate the X-band radars and to evaluate retrieved products, three reference stations (OST, MST and WST) are set up within the PATTERN area consisting of MRR and rain gauges corrected for wind speed at each site. The whole PATTERN region is covered by a C-band radar operated by DWD.
20
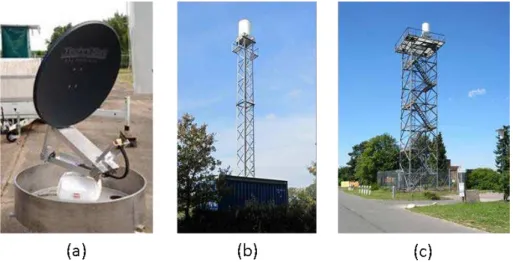
The LAWRs used in PATTERN are modified ship navigation radars of type GEM Scanner SU70-25E with 25 kW transmit power. Corresponding to the technical spec-ifications the modified radars are simple backscatter systems and cannot observe Doppler shift neither do they perform polarimetric measurements. The original fan beam antenna is replaced by a high-gain pencil beam antenna; in order to reduce
25
side lobes an offset parabolic dish of 0.85 m in diameter is used (Fig. 2a). Antenna and scanning drive are protected by a low-loss radome with air conditioning to avoid
AMTD
7, 8233–8270, 2014Performance of a high-resolution X-band weather radar
network – the PATTERN example
K. Lengfeld et al.
Title Page
Abstract Introduction
Conclusions References
Tables Figures
◭ ◮
◭ ◮
Back Close
Full Screen / Esc
Printer-friendly Version
Interactive Discussion
Discussion
P
a
per
|
Discus
sion
P
a
per
|
Discussion
P
a
per
|
Discussion
P
a
per
|
condensation within the radome. Radar control, signal processing and data manage-ment is PC-based. Technical details of the radar systems and the scanning scheme are listed in Table 1.
In the PATTERN set-up LAWRs measure with a pulse width of 0.4 µs at a pulse repitition frequency of 800 Hz. Repetition frequency as well as continuous rotation with
5
a speed of about 24 rpm allows for reflectivity measurements with temporal resolution of 30 s. Due to a beam width of 2.8◦oversampled reflectivity data were used to achieve an angular resolution of 1◦. The scanning scheme is azimuthal only, but fixed elevation angles can be adjusted for optimum operation according to site conditions. For the X-band radars of the PATTERN network a fixed elevation of approximately 2◦is used.
10
The standard system installed at the sites consists of the radar mounted on a two-piece steel tower of 10 m height screwed on a steel frame on top of a container (Fig. 2b). The complete construction is 16 m high. In demounted state the station fits into the container and it can be moved easily. With exception of HWT all PATTERN radars are built up using this standard installation. Radar HWT is placed on an already existing
15
radar tower at the former military airportHungriger Wolf (Fig. 2c).
3 Data processing
Weather radars cannot observe precipitation directly, they measure reflectivity from particles along the radar path. Therefore, raw reflectivity signal does not only contain meteorological echoes from precipitation but also non-meteorological echoes
(clut-20
ter) and background noise. Disturbances caused by other radars and radio links are effectively elimated by filtering peaks within adjacent pulses before reflectivities are recorded as 30 s averages.
In the following algorithms for single radars are presented for estimating background noise, calibrating the X-band radar network with MRR measurements and correcting for
25
AMTD
7, 8233–8270, 2014Performance of a high-resolution X-band weather radar
network – the PATTERN example
K. Lengfeld et al.
Title Page
Abstract Introduction
Conclusions References
Tables Figures
◭ ◮
◭ ◮
Back Close
Full Screen / Esc
Printer-friendly Version
Interactive Discussion
Discussion
P
a
per
|
Discus
sion
P
a
per
|
Discussion
P
a
per
|
Discussion
P
a
per
|
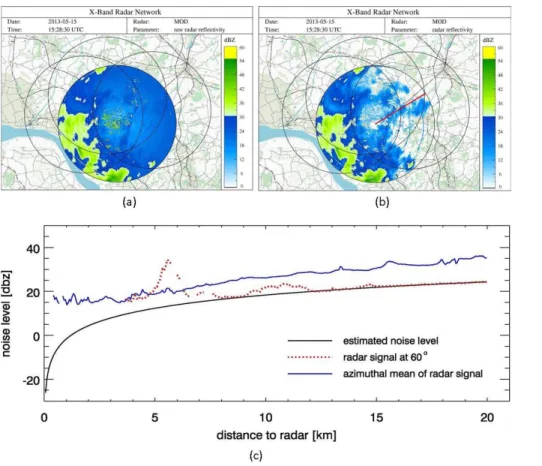
coverage within the network. The functionality of the algorithms is demonstrated exam-plary for a rain event on 15 May 2013 at 15:28:30 UTC observed by radar MOD. The rain event covers the Western part of the radar image with reflectivities of up to 50 dBZ (Fig. 3a).
3.1 Noise detection
5
All reflectivity measurements by radars are affected by noise from internal electrical circuits used in the receiver chain or by atmospheric noise from outside the system. An accurate estimation of the background noise is necessary especially in detection of weak weather signals. A detection algorithm based on received signals has to be implemented in the data processing because the used LAWRs cannot measure the
10
noise level directly. PowerP at the output of the GEM Scanner SU70-25E system con-sists mainly of received powerPrdue to weather signals and noise powerPN. Received
powerPr for distributed weather targets can be expressed as a function dependent on
radar system and physical parameters, summarised by the weather radar constantC, as
15
Pr= C·Z
r2 (1)
which is directly proportional to radar reflectivity factorZ and inversely proportional to the square of distancer (Skolnik, 2008). In contrast, the power of background noisePN
is independent of the distance to the radar. In a first step an inertial guess of the range independent noise level from a rain-free field is used to separate assumed
meteoro-20
logical signals from noise background. In case of more than 10 % rain free radar pixels after subtracting the inertial guess, the 10th percentile of the original reflectivity field is chosen as next noise level. This noise level is applied as inertial guess for noise esti-mation in the next 30 s time step. In order to minimise the influence of radar artefacts on the algorithm, the average of the recent 10 estimates is used to correct the measured
25
AMTD
7, 8233–8270, 2014Performance of a high-resolution X-band weather radar
network – the PATTERN example
K. Lengfeld et al.
Title Page
Abstract Introduction
Conclusions References
Tables Figures
◭ ◮
◭ ◮
Back Close
Full Screen / Esc
Printer-friendly Version
Interactive Discussion
Discussion
P
a
per
|
Discus
sion
P
a
per
|
Discussion
P
a
per
|
Discussion
P
a
per
|
reflectivity field, which is than multiplied by the squared distance to the radar. Range dependent received reflectivitiyZ field due to weather signals and non-meteorological echoes remains (Fig. 3b). Noise level as function of distance to the radar (black line in Fig. 3c) fits the radar signal at 60◦ (red line in Fig. 3b and red dotted line in Fig. 3c) for rain free areas. At ranges with precipitation the signal is the sum of noise and
meteo-5
rological signal. Therefore, considering the rain field in Fig. 3b the azimuthal mean of the radar signal (blue line in Fig. 3c) is always higher than the estimated noise level.
3.2 Clutter filter
Advanced state of the art methods to identify clutter are based on polarimetric mea-surements or observations of Doppler shift. The low-cost radars used in this study do
10
not observe these quantities. Therefore, clutter detection is only based on temporal and spatial variability of reflectivity.
Clutter is characterised by high reflectivity values and can be divided into two different types: static and dynamic clutter. Static clutter is caused e.g. by trees and houses and is present in almost every data set at the same radar pixels. Dynamic clutter is caused
15
by birds, insects or other radars operating in the same frequency range. It varies from timestep to timestep and from pixel to pixel. A number of correction algorithms is ap-plied to reflectivity data of the PATTERN network in order to detect and delete clutter, so that precipitation signal remains. Each correction algorithm pursues a different ap-proach: some base on common clutter identification methods for single radars, others
20
use the unique features of high temporal resolution and large overlap of multiple radars within the network. Many clutter pixels fulfil detection criteria of more than one of these algorithms and are detected by multiple filters. Features of other clutter pixels can be detected by only one of the filters. All pixels detected as clutter are flagged and removed after applying all filters. In the following these algorithms are described in more detail
25
AMTD
7, 8233–8270, 2014Performance of a high-resolution X-band weather radar
network – the PATTERN example
K. Lengfeld et al.
Title Page
Abstract Introduction
Conclusions References
Tables Figures
◭ ◮
◭ ◮
Back Close
Full Screen / Esc
Printer-friendly Version
Interactive Discussion
Discussion
P
a
per
|
Discus
sion
P
a
per
|
Discussion
P
a
per
|
Discussion
P
a
per
|
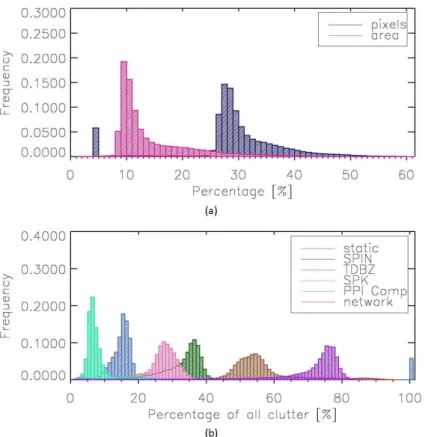
The PATTERN network radar MOD is used examplary to investigate the performance of the clutter filters from July to October 2013. Around 30 % of the radar pixels in each radar are classified as clutter by combinig all detection algorithms (Fig. 4a). Most of the clutter pixels occur close to the radar. Therefore, about 10 % of the area in the radar image is disturbed. The distribution is skewed to the right. This is due to a few
5
disturbances that cannot be identified by the different clutter filters, e.g. wide spikes. In Fig. 4b each algorithm is considered seperately. Most clutter pixels are identified by multiple algorithms. Therefore, the sum of all algorithms is higher than 100 %. The distribution of each clutter filter will be discussed in the following. The blue bar at 5 % in Fig. 4a and at 100 % in Fig. 4b corresponds to cases were the radar reflectivity field
10
is empty and no clutter filter is operational but the static clutter filter.
Static clutter filter
The clutter easiest to identify is static clutter, because it is evident in almost every radar picture at the same pixels. To detect this type of clutter a map is generated by counting the time steps at which reflectivity is higher than 7 dBZ over ten days, corresponding to
15
28 800 time steps (Fig. 5a). That also includes precipitation signal and dynamic clutter. Pixels that exceed the threshold in more than 95 % of the 28800 timesteps are marked as static clutter. 14–27 % of the range gates are identified as static clutter for the four network radars. That corresponds to 8–12 % of the area covered, because static clutter primarily occurs in the vicinity of the radar where the radar beam is close to the ground.
20
The longterm study reveals that for radar MOD up to 20 % of all clutter pixels is static clutter (Fig. 4b). That means, around 80 % of the clutter pixels are not static but dynamic clutter and cannot be detected by the clutter map. Therefore, dynamic clutter filters need to be applied. In some images 100 % seems to be static clutter. This occurs, if there are no measurements for the certain timesteps and the other clutter filters do
25
not operate.
AMTD
7, 8233–8270, 2014Performance of a high-resolution X-band weather radar
network – the PATTERN example
K. Lengfeld et al.
Title Page
Abstract Introduction
Conclusions References
Tables Figures
◭ ◮
◭ ◮
Back Close
Full Screen / Esc
Printer-friendly Version
Interactive Discussion
Discussion
P
a
per
|
Discus
sion
P
a
per
|
Discussion
P
a
per
|
Discussion
P
a
per
|
Dynamic clutter filters for single radars
For identifying dynamic clutter several algorithms are applied based on the structure of the reflectivity field and comparison to the last time steps. First, two common methods to detect dynamic clutter are used: texture of logarithmic reflectivity (TDBZ) field and SPIN field (Hubbert et al., 2009). The TDBZ field is computed as average of squared
5
logarithmic reflectivity difference between adjacent range gates:
TDBZ = " N
X
i
(dBZi−dBZi−1)2
#
/N (2)
where dBZ is reflectivity and N is the number of radar beams used. If the mean of squared reflectivity difference (Fig. 5b) within 5 consecutive range gates is higher than 3 dBZ the pixel is flagged as clutter.
10
The SPIN field (Fig. 5c) is a measure of how often reflectivity gradient changes sign along radial direction. Two conditions must be fulfilled:
signXi−Xi−1=−signXi+1−Xi (3)
and
|Xi−Xi−1|+|Xi+1−Xi|
2 > spinthres (4)
15
whereXi+1,Xi and Xi−1 represent three consecutive dBZ values along a radar radial
and spinthres is a reflectivity threshold set to 3 dBZ. The number of sign changes is calculated within a window of 11 range gates around the centre pixel in radial direction. If both criteria are fulfilled in more than 10 % of the consecutive range gates the pixel is flagged as clutter.
20
AMTD
7, 8233–8270, 2014Performance of a high-resolution X-band weather radar
network – the PATTERN example
K. Lengfeld et al.
Title Page
Abstract Introduction
Conclusions References
Tables Figures
◭ ◮
◭ ◮
Back Close
Full Screen / Esc
Printer-friendly Version
Interactive Discussion
Discussion
P
a
per
|
Discus
sion
P
a
per
|
Discussion
P
a
per
|
Discussion
P
a
per
|
between neighbouring radar beams, rings by a sign change in differences between neighbouring range gates. If Eq. (3) is fulfilled in more than 3 times within a window of 5 range gates in radial or in beam direction around the centre pixel, it is flagged as clutter.
Despite the application of TDBZ, SPIN as well as spike and ring filters some clutter
5
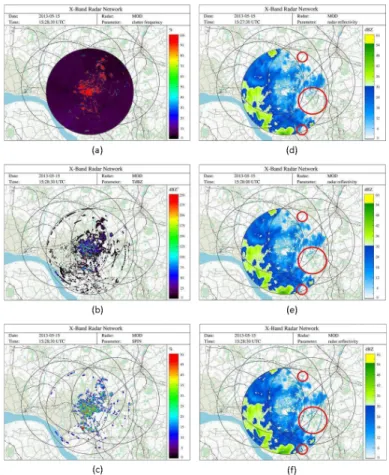
pixels remain in the radar image. The unique feature of high temporal resolution gives additional information for further clutter detection in contrast to common radar systems: range gates with high reflectivities that are present in the current plan position indicator (PPI) image but not in the two previous ones are most likely clutter and are flagged. In Fig. 5d–f the PPI images of reflectivity fields without noise for 13:28:30 UTC (Fig. 5f)
10
and the two previous time steps (13:27:30 UTC in Fig. 5d and 13:28 UTC in Fig. 5e) are shown. Red circles indicate examples of range gates that have reflectivity values greater than the noise level only at 13:28:30 UTC and are, therefore, flagged as clutter. Clutter caused by external emitters is present for a short period of time. Therefore, it appears in only one timestep whereas precipitation structures remaining nearly
con-15
stant within the 30 s. For radars with temporal resolution in the order of a few minutes this method is not applicable.
Comparing the performance of the described dynamic clutter filters, the most efficient algorithm is the TDBZ filter (Fig. 4b). It detects between 40 and 60 % of all clutter pixels, followed by the SPIN filter with 20–40 %. The filter for spike and ring identification
20
detects between 15 and 35 % of all clutter pixels. The filter comparing three timesteps (PPI Comp) operates in rain free areas and detects up to 10 % of all clutter pixels.
Network based clutter filter
In contrast to single radar systems, networks give multiple information on reflectivitiy in overlapping areas. Each radar observes in a different height above a certain location.
25
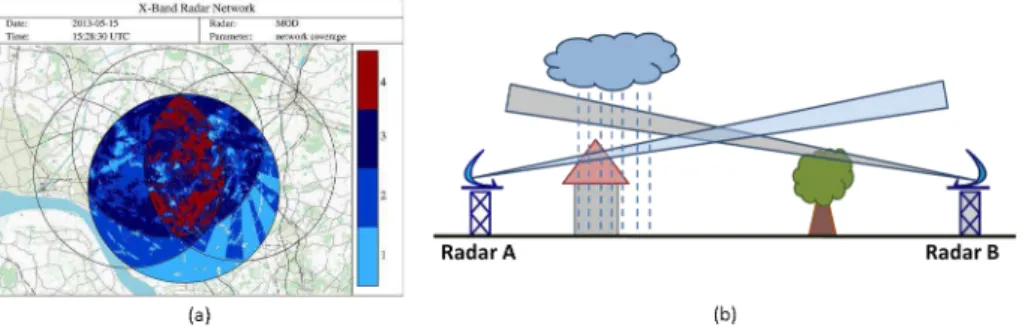
This additional information is used for clutter detection in areas covered by more than two radars (dark blue and red areas in Fig. 6a).
AMTD
7, 8233–8270, 2014Performance of a high-resolution X-band weather radar
network – the PATTERN example
K. Lengfeld et al.
Title Page
Abstract Introduction
Conclusions References
Tables Figures
◭ ◮
◭ ◮
Back Close
Full Screen / Esc
Printer-friendly Version
Interactive Discussion
Discussion
P
a
per
|
Discus
sion
P
a
per
|
Discussion
P
a
per
|
Discussion
P
a
per
|
Obstacles in the near-field of a radar will occur as clutter, e.g. the house in the image of radar A (Fig. 6b). The beam of radar B is higher above the ground at the same location and, therefore, not affected. To assure, that a range gate is affected by clutter the filter is applied in areas covered by at least three radars. If a range gate of one radar shows reflectivity, but the corresponding range gates of the other at least two radars do
5
not, it is most likely to be clutter.
The longterm study of performance of the network based clutter filter shows, that this algorithm is the most efficient one (Fig. 4b). More than 60 % and up to 80 % of the clutter pixels are detected by the network algorithm. This is a very good performance considering the fact, that the network algorithm only works in areas that are covered
10
by more than two radars (60 % in this case).
3.3 Calibration
In order to calibrate reflectivity measurements of the X-band radar network, three ref-erence stations are operated in the overlapping area of the PATTERN network. Each reference station consists of micro rain radar (MRR), rain gauge and wind sensor. The
15
largest source of error in rain gauge measurements are wind-induced losses. Thus, wind speed measurements from the wind sensor are used to correct three hour av-erages of rain gauge measurements within the calibration period from April to Octo-ber 2013 according to Rubel and Hantel (1999). These wind-corrected measurements from rain gauges are used to calibrate the micro rain radars. The MRRs at the
refer-20
ence stations derive rain rate and reflectivity observations in 31 height levels from the ground to 1085 m height. For measurements in the nearfield of the MRR the relation between powerP and distancer is not valid, because the height resolution is almost in the order of the measuring height. The MRRs are operated with a height resolution of 35 m and, therefore, it is common to omit the two lowest levels. The P–r-relation
25
is applicable from the third level. Three hour averages of rain rate are calibrated with rain gauge measurements. The logarithmic calibration factor for MRR (CMRR) rain rates
AMTD
7, 8233–8270, 2014Performance of a high-resolution X-band weather radar
network – the PATTERN example
K. Lengfeld et al.
Title Page
Abstract Introduction
Conclusions References
Tables Figures
◭ ◮
◭ ◮
Back Close
Full Screen / Esc
Printer-friendly Version
Interactive Discussion
Discussion
P
a
per
|
Discus
sion
P
a
per
|
Discussion
P
a
per
|
Discussion
P
a
per
|
MRR (dBRMRR) and rain gauge (dBRRG):
CMRR=dBRMRR− dBRRG (5)
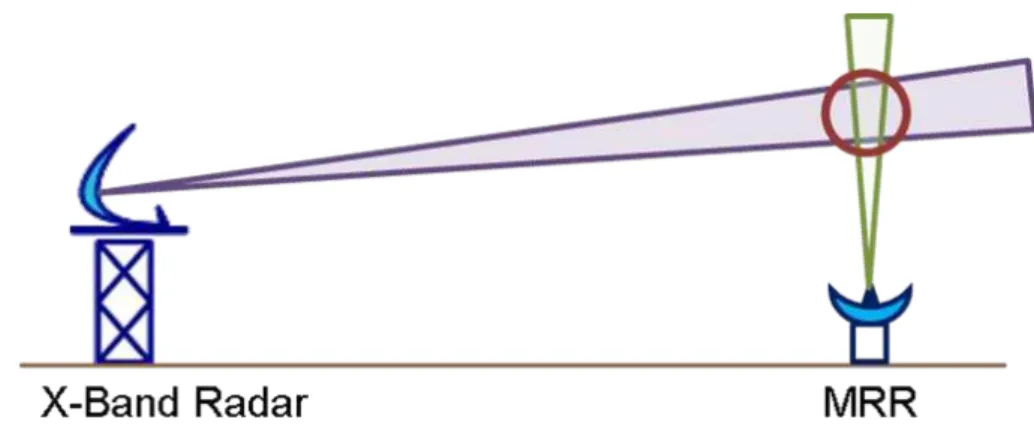
The X-band radars are calibrated with reflectivity measurements of MRRs. Therefore, directly measured reflectivity of the X-band radar is used for calibration and not the precipitation product that is used for calibration with rain gauges. Another advantage of
5
this method is, that both systems observe reflectivity at the same height and, therefore, more or less in the same volume (Fig. 7). This volume is derived for each combination of X-band radar and MRR individually. A linear fit of the form
ZMRR=a·ZX (6)
is applied, whereZMRR is reflectivity of the MRR, ZX reflectivity of the X-Band radar 10
andais the calibration coefficient:
a=100.1·(dBZX−dBZMRR). (7)
As an example, a comparison between radar MOD and the reference station WST is depicted in Fig. 8 for April to October 2013. Overall X-band radar MOD fits MRR WST measurements quite well with a mean bias of 2.59 dBZ, an RMSE of ca. 4 dBZ and
15
a correlation of 0.91. A list of the calibration coefficients can be found in Table 2.
3.4 Attenuation correction
As X-band frequency range is highly influenced by attenuation, parts of an algorithm especially developed for small single-polarised X-band radars is used according to Del-rieu et al. (1997) based on Marzoug and Amayenc (1994). AttenuationA(r) at a range
20
gater is multiplicative and the true reflectivity profileZ(r) can be calculated with the measured reflectivity profileZm(r) and a constant radar calibration errorδC:
Zm(r)=Z(r)δCA(r). (8)
AMTD
7, 8233–8270, 2014Performance of a high-resolution X-band weather radar
network – the PATTERN example
K. Lengfeld et al.
Title Page
Abstract Introduction
Conclusions References
Tables Figures
◭ ◮
◭ ◮
Back Close
Full Screen / Esc
Printer-friendly Version
Interactive Discussion
Discussion
P
a
per
|
Discus
sion
P
a
per
|
Discussion
P
a
per
|
Discussion
P
a
per
|
Attenuation influences the radar beam on both ways, away and back to the radar. Therefore, two-way apparent attenuation K is calculated as integral along the path from range gate 0 to range gater and back:
K(r)=2
r
Z
0
Z
m(s) α
β1
ds (9)
with coefficients α=132 250 and β=1.2 for X-band frequency range (Delrieu et al.,
5
1997). The attenuation factorAfor a certain range gater is then calculated as
A(r)=
1−0.23
β Km(r)
β
. (10)
The determination of attenuation works along a path with undisturbed measure-ments. Because of the elimination of clutter affected range gates, data gaps occur that need to be filled. A common method for single radars is interpolation of data gaps.
10
Thereby, information on small scale variability of the rain event gets lost. In the over-lapping areas within in the network the advantage of multiple information from different radars is used to fill data gaps. Therefore, the structure of precipitation is kept and allows for more precise attenuation estimation within the network compared to single radars. The attenuation field is presented in Fig. 9a. In areas of high reflectivities in
15
the most Southern and Western parts of the radar image, the attenuation factorA(r) is higher than 0.5. The corrected reflectivity field after clutter filtering, calibration and attenuation correction is shown in Fig. 9b.
3.5 Composite of network radars
The X-band radar network derives multiple information on reflectivity, clutter and
attenu-20
AMTD
7, 8233–8270, 2014Performance of a high-resolution X-band weather radar
network – the PATTERN example
K. Lengfeld et al.
Title Page
Abstract Introduction
Conclusions References
Tables Figures
◭ ◮
◭ ◮
Back Close
Full Screen / Esc
Printer-friendly Version
Interactive Discussion
Discussion
P
a
per
|
Discus
sion
P
a
per
|
Discussion
P
a
per
|
Discussion
P
a
per
|
resolution of 250 m is used. Each radar pixel is assigned to the grid cell its centre is located in and the average of reflectivity values of all radar pixels in a certain grid cell is calculated. To make sure that grid boxes far away from the radar centres contain at least one radar pixel, the resolution of the radar is artificially enhanced by dividing each azimuth angle into 0.1◦steps. In order to determine rainfall ratesRof the composite of
5
reflectivities (Fig. 10), a commonZ–R-relation as used by DWD is applied:
R=a Zb (11)
with coefficientsa=320, 200 or 77 andb=1.4, 1.6 or 1.9, respectively, depending on the strength of the rain event. The result is a nearly undisturbed precipitation field that covers the Western half of the network area.
10
4 Comparison to C-band radar
In the last section it has been shown that several algorithms are needed to obtain nearly undisturbed calibrated reflectivity fields from raw data. In order to give an estimation on the quality of products from the PATTERN X-band radar network, reflectivity data is compared to the products of radar Fuhlsbüttel operated by DWD in Hamburg 40 km
15
northeast of the network area. Radar Fuhlsbüttel provides reflectivity measurements in the C-band frequency range with spatial resolution of 1 km, azimuthal resolution of 1◦ and temporal resolution of 5 min. The PATTERN network observes reflectivity with a temporal resolution of 30 s. Therefore, reflectivity fields obtained by the PATTERN network are compared to the closest 5 min measurements of radar Fuhlsbüttel.
20
A comparison of the composite of reflectivity fields of the four PATTERN radars (Fig. 11a) for 15 May 2013, 15:28:30 UTC to the product of radar Fuhlsbüttel (Fig. 11b) for 15 May 2013, 15:30 UTC indicates high spatial accordance of both systems. Both, geographical position of the precipitation area as well as it’s maxima in the Western part of the network area, are displayed well by the PATTERN radars and radar Fuhlsbüttel.
25
AMTD
7, 8233–8270, 2014Performance of a high-resolution X-band weather radar
network – the PATTERN example
K. Lengfeld et al.
Title Page
Abstract Introduction
Conclusions References
Tables Figures
◭ ◮
◭ ◮
Back Close
Full Screen / Esc
Printer-friendly Version
Interactive Discussion
Discussion
P
a
per
|
Discus
sion
P
a
per
|
Discussion
P
a
per
|
Discussion
P
a
per
|
than for radar Fuhlsbüttel. The precipitation field is slightly shifted to the East in the image derived by radar Fuhlsbüttel. This is due to the time shift of 1.5 min between Fig. 11a and b.
The good agreement between PATTERN network and radar Fuhlsbüttel in terms of reflectivity is also evident in a long term comparison of both systems shown in Fig. 12.
5
Reflectivities from the PATTERN network are averaged on the grid of radar Fuhls-büttel. All precipitation events that occur from May to September 2013 are taken into account and reflectivity values are divided into 1 dBZ steps. Overall, both systems are in good agreement. The PATTERN network slightly overestimates measurements of radar Fuhlsbüttel for reflectivities lower than 15 dBZ, which results in small intercept of
10
−3.23 dBZ when PATTERN is used as regressor. For DWD radar as regressor intercept is nearly 0 dBZ. Slopes are close to one for both regression. The good agreement in reflectivity values between PATTERN and radar Fuhlsbüttel demonstrates that overall the PATTERN network provides reliable reflectivity data and promising results in terms of higher resolution.
15
The higher resolution of the PATTERN product compared to radar Fuhlsbüttel allows for enhanced and more detailed spatial allocation of precipitation. In order to inves-tigate the variability of reflectivity within a single range gate of radar Fuhlsbüttel with range resolution of 1 km and azimuthal resolution of 1◦, the number of rain pixel from the PATTERN network is calculated for each DWD range gate (Fig. 13a). The lower the
20
percentage of rain pixels the smaller is the rain covered area in a certain DWD range gate. The Western part of the network is completely covered by rain and, therefore, the percentage of rain pixels from the network is 100 % for almost all DWD range gates. At the border of the precipitation field in the centre of the network area, the percentage drops to less then 10 %. These small scale structures cannot be observed with the
25
AMTD
7, 8233–8270, 2014Performance of a high-resolution X-band weather radar
network – the PATTERN example
K. Lengfeld et al.
Title Page
Abstract Introduction
Conclusions References
Tables Figures
◭ ◮
◭ ◮
Back Close
Full Screen / Esc
Printer-friendly Version
Interactive Discussion
Discussion
P
a
per
|
Discus
sion
P
a
per
|
Discussion
P
a
per
|
Discussion
P
a
per
|
5 Conclusions
A network consisting of four X-band radars has been deployed within the framework of the projectPrecipitation and Attenuation Estimates from a High-Resolution Weather Radar Network(PATTERN) that is operational since January 2012. The radars provide reflectivity fields with spatial resolution of 60 m, azimuthal resolution of 1◦ and
tempo-5
ral resolution of 30 s. Algorithms have been developed to remove disturbances in raw reflectivity fields of single radars. The performance of these algorithms is examplary shown for one of the network radars (MOD). Noise level is estimated for each radar using the 5th percentile of the smoothed reflectivity field and the noise levels of the last 10 time steps.
10
Approximately 10 % of the radar covered area is disturbed by reflection from obsta-cles such as trees or houses or from other transmitters. In order to identify these clutter pixels, two different types of clutter detection algorithms are applied: single radar and network based algorithms. Some of the single radar algorithms base on classic clutter detection methods, such as texture of dBZ field (TDBZ), sign changes in neighbouring
15
pixels (SPIN), the shape of disturbances from other transmitters (spikes or rings) or a static clutter map. The most efficient of these single radar algorithms is the TDBZ filter, that detects up to 60 % of all clutter pixels, followed by the SPIN filter with up to 40 %. The advantage of high temporal resolution of 30 s is also used for clutter detec-tion by comparing the PPI image of the current time step to the two previous ones.
20
Pixels with reflectivity values higher than the noise level that don’t occur in the two previous images are flagged as clutter. This type of filter only works for high temporal resolution because the spatial shift in the precipitation field is small compared to a time step of 5 min which is the common temporal resolution of operational regional radar systems. Around 10 % of clutter can be detected with this type of filter that operates in
25
rain free areas.
The second type of clutter filter is based on the advantage of having a network of four radars with high spatial resolution. In areas covered by more than two radars,
AMTD
7, 8233–8270, 2014Performance of a high-resolution X-band weather radar
network – the PATTERN example
K. Lengfeld et al.
Title Page
Abstract Introduction
Conclusions References
Tables Figures
◭ ◮
◭ ◮
Back Close
Full Screen / Esc
Printer-friendly Version
Interactive Discussion
Discussion
P
a
per
|
Discus
sion
P
a
per
|
Discussion
P
a
per
|
Discussion
P
a
per
|
pixels with reflectivities higher than the noise level that do not appear in at least two other radars are flagged as clutter. This network based clutter filter is more efficient than all single radar algorithms with a detection rate of more than 70 %. Therefore, the network of X-band radars is a very useful tool for clutter filtering that is also used to fill the gaps resulting from clutter filtering. Thus, smoothing of the reflectivitiy field due to
5
interpolation is avoided and the small scale structure of rain events is kept.
Three reference stations are deployed within the network covered area for calibra-tion purposes, consisting of rain gauge, wind sensor and micro rain radar (MRR). Using MRRs for X-band radar calibration has the advantage of comparing reflectiv-ity measurements at the same height level and not to observation at the ground from
10
rain gauges. A slight overestimation of MRR measurements is detected and corrected for radar MOD. X-band radars are highly influenced by attenuation from liquid water. Therefore, a simple single radar algorithm for attenuation correction is applied to the network radars.
A composite of all four radars is calculated on a 250 m×250 m grid by averaging
15
reflectivities from all pixels that fall into a certain grid cell. A comparison to measure-ments from a C-band radar operated by DWD indicates that the PATTERN network slightly overestimates reflectivity but displays the spatial structure of rain events very well in higher resolution than nationwide radar networks can do. Both systems are in good agreement for all rain events that occured from May to September 2013. It has
20
been shown that especially at the border of rain events, where only parts of the C-band radar pixels are covered by rain, the higher resolution of the X-band radar network provides more detailed information on the structure of precipitation. Within a C-band radar pixel the standard deviation can be up to 3 dBZ. Therefore, an X-band radar is a useful addition to large S- or C-band radar systems in areas of special interest, e.g.
25
AMTD
7, 8233–8270, 2014Performance of a high-resolution X-band weather radar
network – the PATTERN example
K. Lengfeld et al.
Title Page
Abstract Introduction
Conclusions References
Tables Figures
◭ ◮
◭ ◮
Back Close
Full Screen / Esc
Printer-friendly Version
Interactive Discussion
Discussion
P
a
per
|
Discus
sion
P
a
per
|
Discussion
P
a
per
|
Discussion
P
a
per
|
6 Outlook
It has been shown in this paper that a network of LAWRs gives reliable precipitation estimates and can be a useful addition to nationwide radar networks. For further im-provement, the next step will be implementation of attenuation correction algorithms that use the advantage of a network (e.g. Chandrasekar and Lim, 2008; Srivastava
5
and Tian, 1996; Testud and Amayenc, 1989). Better estimation of attenuation can lead to better precipitation estimates because the relation between attenuation and precipi-tation is more stable than the relation between reflectivity and precipiprecipi-tation.
Furthermore, the fixed relation between radar reflectivity and precipitation will be replaced by a dynamic relation determined operationally using measurements of seven
10
MRRs installed in the PATTERN catchment. This allows for adaptation ofZ–R-relations to current weather conditions, e.g. shower, light or stratiform rain.
High-resolution products of the PATTERN network will also be used as input for rainfall-runoff simulations. Currently, hydrometeorological models use products from C- or S-band radars as input with resolution of several minutes in time and kilometres
15
in space. Higher spatial and temporal resolution of precipitation estimates can be used to improve rainfall-runoff simulations in areas of special interest, e.g. in small scale structured urban areas.
Acknowledgements. The project Precipitation and Attenuation Estimates from a High-Resolution Weather Radar Network (PATTERN) is a joint project between the University
20
of Hamburg and the Max-Planck-Institute for Meteorology. It is funded by the Deutsche Forschungsgemeinschaft (grant AM308/3-1).
The authors thank the German Weather Service (DWD) for making products of their C-band radar network available for research purposes within the project PATTERN.
References
25
Atlas, D. and Banks, H. C.: The interpretation of microwave reflections from rainfall, J. Meteorol., 8, 271–282, 1951. 8236
AMTD
7, 8233–8270, 2014Performance of a high-resolution X-band weather radar
network – the PATTERN example
K. Lengfeld et al.
Title Page
Abstract Introduction
Conclusions References
Tables Figures
◭ ◮
◭ ◮
Back Close
Full Screen / Esc
Printer-friendly Version
Interactive Discussion
Discussion
P
a
per
|
Discus
sion
P
a
per
|
Discussion
P
a
per
|
Discussion
P
a
per
|
Atlas, D. and Ulbrich, C. W.: Path- and area-integrated rainfall measurement by microwave attenuation in the 1–3 cm band, J. Appl. Meteorol., 1, 1322–1331, 1977. 8236
Beck, J. and Bousquet, O.: Using gap-filling radars in mountainous regions to complement a na-tional radar network: improvements in multiple-doppler wind syntheses, J. Appl. Meteorol., 52, 1836–1850, 2013. 8236
5
Bringi, V. N., Chandrasekar V., Balakrishnan N., and Zrnic, D. S.: An examination of propagation effects in rainfall radar measurements at microwave frequencies, J. Atmos. Ocean. Tech., 7, 829–840, 1990. 8235
Chandrasekar, V. and Lim, S.: Retrieval of reflectivity in a networked radar environment, J. At-mos. Ocean. Tech., 25, 1755–1767, 2008. 8236, 8252
10
Delrieu, G., Caoudal, S., and Creutin, J. D.: Feasibility of using mountain return for the cor-rection of ground based X-band weather radar, J. Atmos. Ocean. Tech., 14, 368–385, 1997. 8246, 8247
Doviak, R. J. and Zrnic, D. S.: Doppler Radar and Weather Observations, 2nd Edn., 42, Dover Publications, 1993. 8236
15
Dutton, E. J.: Estimation of radio attenuation in convective rainfalls, J. Appl. Meteorol., 6, 622– 668, 1967. 8236
Einfalt, T.: A user perspective in Germany: what is espected by agencies and government from radar data?, Int. J. River Basin Management, 1, 1–5, 2003. 8235
Gunn, K. L. S. and East, T.: The microwave properties of precipitation particles, Q. J. Rox.
20
Meteor. Soc., 80, 522–545, 1954. 8236
Hitschfeld, W. and Bordan, J.: Errors inherent in the radar measurement of rainfall at attenuating wavelengths, J. Meteorol., 11, 58–67, 1954. 8236
Hubbert, J. C., Dixon, M., and Ellis, S. M.: Weather radar ground clutter. Part II: Real-time identification and filtering, J. Atmos. Ocean. Tech., 26, 1181–1197, 2009. 8243
25
Kabeche, A. C. and Testud, J.: Stereoradar meteorology: a new unified approach to process data from airborne or ground-based meteorological radars, J. Atmos. Ocean. Tech., 12, 783– 799, 1995. 8236
Lengfeld, K., Clemens, M., Feiertag, N., and Ament, F.: Precipitation and attenuation estimates from a high-resolution weather radar network (PATTERN): design of the experiment, in:
Pro-30
AMTD
7, 8233–8270, 2014Performance of a high-resolution X-band weather radar
network – the PATTERN example
K. Lengfeld et al.
Title Page
Abstract Introduction
Conclusions References
Tables Figures
◭ ◮
◭ ◮
Back Close
Full Screen / Esc
Printer-friendly Version
Interactive Discussion
Discussion
P
a
per
|
Discus
sion
P
a
per
|
Discussion
P
a
per
|
Discussion
P
a
per
|
Lengfeld, K., Clemens, M., Münster, H., and Ament, F.: PATTERN: advantages of high-resolution weather radar networks, in: Proceedings of American Meteorological Society 36th Conference on Radar Meteorology, Breckenridge, CO, USA, 16–20 September 2013, 2013. 8235
Lim, S., Chandrasekar, V., Lee, P., and Jayasumana, A. P.: Real-time implementation of
5
a network-based attenuation correction in the CASA IP1 testbed, J. Atmos. Ocean. Tech., 28, 197–209, 2011. 8236
Mahale, V. N., Brotzge, J. A., and Bluestein, H. B.: The advantages of a mixed-band radar network for severe weather operations: a case study of 13 May 2009, Weather Forecast., 29, 78–98, 2014. 8236
10
Marzoug, M. and Amayenc, P.: A class of single- and dual-frequency algorithms for rain-rate profiling from a spaceborne radar. Part I: Principle and tests from numerical simulations, J. Atmos. Ocean. Tech., 11, 1480–1506, 1994. 8246
Matrosov, S. Y., Cifelli, R., and Gochis, D.: Measurements of heavy convective rainfall in the presence of hail in flood-prone areas using an X-band polarimetric radar, J. Appl. Meteorol.,
15
52, 395–407, 2013. 8236
McLaughlin, D., Pepyne, D., Chandrasekar, V., Philips, B., Kurose, J., Zink, M., Droegemeier, K., Cruz-Pol, S., Junyent, F., Brotzge, J., Westbrook, D., Bharadwaj, N., Wang, Y., Lyons, E., Hondl, K., Liu, Y., Knapp, E., Xue, M., Hopf, A., Kloesel, K., DeFonzo, A., Kollias, P., Brew-ster, K., Contreras, R., Dolan, B., Djaferis, T., Insanic, E., Frasier, S., and Carr, F.:
Short-20
wavelength technology and the potential for distributed networks of small radar systems, B. Am. Meteorol. Soc., 90, 1797–1817, 2009. 8237
Peters, G., Fischer, B., Münster, H., Clemens, M., and Wagner A.: Profiles of raindrop size distributions as retrieved by micro rain radars, J. Appl. Meteorol., 44, 1930–1949, 2005. 8238 Rubel, F. and Hantel, M.: Correction of daily rain gauge measurements in the Baltic Sea
25
drainage basin, Nord. Hydrol., 30, 191–208, 1999. 8245
Shakti, P. C., Maki, M., Shimizu, S., Maesaka, T., Kim, D.-S., Lee, D. I., and Iida, H.: Correction of reflectivity in the presence of partial beam blockage over a mountainous region using X-band dual polarization radar, J. Hydrometeorol., 14, 744–764, 2013. 8236
Skolnik, M. I. (Ed.): Radar Handbook, 3rd Edn., McGraw-Hill, New York, 2008. 8240
30
Srivastava, R. C. and Tian, L.: Measurements of attenuation by a dual-radar method, J. Atmos. Ocean. Tech., 13, 937–947, 1996. 8236, 8252
AMTD
7, 8233–8270, 2014Performance of a high-resolution X-band weather radar
network – the PATTERN example
K. Lengfeld et al.
Title Page
Abstract Introduction
Conclusions References
Tables Figures
◭ ◮
◭ ◮
Back Close
Full Screen / Esc
Printer-friendly Version
Interactive Discussion
Discussion
P
a
per
|
Discus
sion
P
a
per
|
Discussion
P
a
per
|
Discussion
P
a
per
|
Tian, L. and Srivastava, R. C.: Measurements of attenuation at C-band in a convective storm by a dual-radar method, J. Atmos. Ocean. Tech., 14, 184–196, 1997. 8236
Testud, J. and Amayenc, P.: Stereoradar meteorology: a promising technique for observation of precipitation from a mobile platform, J. Atmos. Ocean. Tech., 6, 89–108, 1989. 8236, 8252 Trabal, J. M., Colom-Ustariz, J., Cruz-Pol, S., Pablos-Vega, G. A., and McLaughlin, D. J.:
Re-5
mote sensing of weather hazards using a low-cost and minimal infrastructure off-the-grid weather radar network, IEEE T. Geosci. Remote, 51, 2541–2555, 2013. 8235, 8236
Turso, S., Zambotto, M., Gabella, M., Orione, F., Notarpietro, R., and Perona, G.: Microradar-net: An Innovative Wireless Micro Radar Network for High Resolution Weather Monitoring, presented at 9th European Conference on Applications of Meteorology, Toulouse, France,
10
28 September–2 October 2009, 2009. 8236
Ventura, J. F. I. and Tabary, P.: The new French operational polarimetric radar rainfall rate product, J. Appl. Meteorol., 52, 1817–1835, 2013 8236
Wexler, R. and Atlas, D.: Radar reflectivity and attenuation of rain, J. Appl. Meteorol., 2, 276– 280, 1963 8236
AMTD
7, 8233–8270, 2014Performance of a high-resolution X-band weather radar
network – the PATTERN example
K. Lengfeld et al.
Title Page
Abstract Introduction
Conclusions References
Tables Figures
◭ ◮
◭ ◮
Back Close
Full Screen / Esc
Printer-friendly Version
Interactive Discussion
Discussion
P
a
per
|
Discus
sion
P
a
per
|
Discussion
P
a
per
|
Discussion
P
a
per
|
Table 1.LAWR specifications.
Performance parameters Specifications
Range resolution 60 m Azimuth resolution 1◦ Time resolution 30 s Maximum range 20 km Calibration accuracy ±1dB Transmit power 25 kW Frequency 9410 MHz Pulse width 0.4 µs Pulse repitition frequency 800 Hz Beam width 2.8◦
AMTD
7, 8233–8270, 2014Performance of a high-resolution X-band weather radar
network – the PATTERN example
K. Lengfeld et al.
Title Page
Abstract Introduction
Conclusions References
Tables Figures
◭ ◮
◭ ◮
Back Close
Full Screen / Esc
Printer-friendly Version
Interactive Discussion
Discussion
P
a
per
|
Discus
sion
P
a
per
|
Discussion
P
a
per
|
Discussion
P
a
per
|
Table 2.Calibration coefficientsafor every possible combination of X-band radar (HWT, MOD,
QNS and BKM) and MRR (OST, MST and WST) and the average coefficient in dBZ.
aOST aMST aWST a
AMTD
7, 8233–8270, 2014Performance of a high-resolution X-band weather radar
network – the PATTERN example
K. Lengfeld et al.
Title Page
Abstract Introduction
Conclusions References
Tables Figures
◭ ◮
◭ ◮
Back Close
Full Screen / Esc
Printer-friendly Version
Interactive Discussion
Discussion
P
a
per
|
Discus
sion
P
a
per
|
Discussion
P
a
per
|
Discussion
P
a
per
|
Figure 1.Position of the four network radars Hungriger Wolf Tower (HWT), Quarnstedt (QNS),
Bekmünde (BKM) and Moordorf (MOD) marked in red, the Hamburg radar marked in blue and their 20 km range. Reference stations OST, MST and WST are marked in green.
AMTD
7, 8233–8270, 2014Performance of a high-resolution X-band weather radar
network – the PATTERN example
K. Lengfeld et al.
Title Page
Abstract Introduction
Conclusions References
Tables Figures
◭ ◮
◭ ◮
Back Close
Full Screen / Esc
Printer-friendly Version
Interactive Discussion
Discussion
P
a
per
|
Discus
sion
P
a
per
|
Discussion
P
a
per
|
Discussion
P
a
per
|
Figure 2.Modified ship navigation radar with parabolic dish(a), typical radar tower in
AMTD
7, 8233–8270, 2014Performance of a high-resolution X-band weather radar
network – the PATTERN example
K. Lengfeld et al.
Title Page
Abstract Introduction
Conclusions References
Tables Figures
◭ ◮
◭ ◮
Back Close
Full Screen / Esc
Printer-friendly Version
Interactive Discussion
Discussion
P
a
per
|
Discus
sion
P
a
per
|
Discussion
P
a
per
|
Discussion
P
a
per
|
Figure 3.Estimating noise level for radar MOD for 15 May 2013, 15:28:30 UTC:(a)Raw
reflec-tivity field,(b)reflectivity field without background noise with red line indicating 60◦azimuth and
(c)noise level and radar signal as function of distance to the radar.
AMTD
7, 8233–8270, 2014Performance of a high-resolution X-band weather radar
network – the PATTERN example
K. Lengfeld et al.
Title Page
Abstract Introduction
Conclusions References
Tables Figures
◭ ◮
◭ ◮
Back Close
Full Screen / Esc
Printer-friendly Version
Interactive Discussion
Discussion
P
a
per
|
Discus
sion
P
a
per
|
Discussion
P
a
per
|
Discussion
P
a
per
|
Figure 4.Distribution of clutter for the period from July to October 2013.(a)Histogram of the
AMTD
7, 8233–8270, 2014Performance of a high-resolution X-band weather radar
network – the PATTERN example
K. Lengfeld et al.
Title Page
Abstract Introduction
Conclusions References
Tables Figures
◭ ◮
◭ ◮
Back Close
Full Screen / Esc
Printer-friendly Version
Interactive Discussion
Discussion
P
a
per
|
Discus
sion
P
a
per
|
Discussion
P
a
per
|
Discussion
P
a
per
|
Figure 5. Clutter detection for radar MOD for 15 May 2013, 15:28:30 UTC: (a) static clutter
map,(b) TDBZ field, (c) SPIN field. Clutter detection using previous PPIs: (d) dBZ field for 15:27:30 UTC,(e)dBZ field for 15:28:00 UTC,(f)dBZ field for 15:28:30 UTC.
AMTD
7, 8233–8270, 2014Performance of a high-resolution X-band weather radar
network – the PATTERN example
K. Lengfeld et al.
Title Page
Abstract Introduction
Conclusions References
Tables Figures
◭ ◮
◭ ◮
Back Close
Full Screen / Esc
Printer-friendly Version
Interactive Discussion
Discussion
P
a
per
|
Discus
sion
P
a
per
|
Discussion
P
a
per
|
Discussion
P
a
per
|
Figure 6. (a)Coverage within the X-Band radar network and(b)sketch of obstacles and
AMTD
7, 8233–8270, 2014Performance of a high-resolution X-band weather radar
network – the PATTERN example
K. Lengfeld et al.
Title Page
Abstract Introduction
Conclusions References
Tables Figures
◭ ◮
◭ ◮
Back Close
Full Screen / Esc
Printer-friendly Version
Interactive Discussion
Discussion
P
a
per
|
Discus
sion
P
a
per
|
Discussion
P
a
per
|
Discussion
P
a
per
|
Figure 7.Sketch of set-up for calibration of X-band radars with MRR.
AMTD
7, 8233–8270, 2014Performance of a high-resolution X-band weather radar
network – the PATTERN example
K. Lengfeld et al.
Title Page
Abstract Introduction
Conclusions References
Tables Figures
◭ ◮
◭ ◮
Back Close
Full Screen / Esc
Printer-friendly Version
Interactive Discussion
Discussion
P
a
per
|
Discus
sion
P
a
per
|
Discussion
P
a
per
|
Discussion
P
a
per
|
Figure 8.Comparison of X-band radar MOD (ordinate) to micro rain radar WST (abscissa) for
AMTD
7, 8233–8270, 2014Performance of a high-resolution X-band weather radar
network – the PATTERN example
K. Lengfeld et al.
Title Page
Abstract Introduction
Conclusions References
Tables Figures
◭ ◮
◭ ◮
Back Close
Full Screen / Esc
Printer-friendly Version
Interactive Discussion
Discussion
P
a
per
|
Discus
sion
P
a
per
|
Discussion
P
a
per
|
Discussion
P
a
per
|
Figure 9.Attenuation correction for radar MOD for 15 May 2013, 15:28:30 UTC:(a)attenuation
field and(b)corrected dBZ field.
AMTD
7, 8233–8270, 2014Performance of a high-resolution X-band weather radar
network – the PATTERN example
K. Lengfeld et al.
Title Page
Abstract Introduction
Conclusions References
Tables Figures
◭ ◮
◭ ◮
Back Close
Full Screen / Esc
Printer-friendly Version
Interactive Discussion
Discussion
P
a
per
|
Discus
sion
P
a
per
|
Discussion
P
a
per
|
Discussion
P
a
per
|
Figure 10.Composite of the precipitation fields of all four PATTERN radars for 15 May 2013,