Genome-Assisted Prediction of Quantitative
Traits Using the R Package
sommer
Giovanny Covarrubias-Pazaran*
Department of Horticulture, University of Wisconsin, Madison, Wisconsin, Unites States of America
Abstract
Most traits of agronomic importance are quantitative in nature, and genetic markers have been used for decades to dissect such traits. Recently, genomic selection has earned atten-tion as next generaatten-tion sequencing technologies became feasible for major and minor crops. Mixed models have become a key tool for fitting genomic selection models, but most current genomic selection software can only include a single variance component other than the error, making hybrid prediction using additive, dominance and epistatic effects unfeasible for species displaying heterotic effects. Moreover, Likelihood-based software for fitting mixed models with multiple random effects that allows the user to specify the var-iance-covariance structure of random effects has not been fully exploited. A new open-source R package calledsommeris presented to facilitate the use of mixed models for genomic selection and hybrid prediction purposes using more than one variance compo-nent and allowing specification of covariance structures. The use ofsommerfor genomic prediction is demonstrated through several examples using maize and wheat genotypic and phenotypic data. At its core, the program contains three algorithms for estimating variance components: Average information (AI), Expectation-Maximization (EM) and Efficient Mixed Model Association (EMMA). Kernels for calculating the additive, dominance and epistatic relationship matrices are included, along with other useful functions for genomic analysis. Results fromsommerwere comparable to other software, but the analysis was faster than Bayesian counterparts in the magnitude of hours to days. In addition, ability to deal with missing data, combined with greater flexibility and speed than other REML-based software was achieved by putting together some of the most efficient algorithms to fit models in a gentle environment such as R.
Introduction
With next generation sequencing technologies (NGS) becoming cheaper and consequently more feasible for all crops, huge genomic data sets have become available to help during selec-tion and decision making in plant breeding programs [1,2]. The idea of using genetic markers to accelerate and improve plant and animal breeding systems originated with Sax in 1923 who first reported an association of a simply inherited genetic marker with a quantitative trait in plants [3,4]. On the other hand, the development of statistical tools for breeding purposes, a11111
OPEN ACCESS
Citation:Covarrubias-Pazaran G (2016) Genome-Assisted Prediction of Quantitative Traits Using the R Packagesommer. PLoS ONE 11(6): e0156744.
doi:10.1371/journal.pone.0156744
Editor:Aimin Zhang, Institute of Genetics and Developmental Biology, CHINA
Received:March 20, 2016 Accepted:May 18, 2016 Published:June 6, 2016
Copyright:© 2016 Giovanny Covarrubias-Pazaran. This is an open access article distributed under the terms of theCreative Commons Attribution License, which permits unrestricted use, distribution, and reproduction in any medium, provided the original author and source are credited.
Data Availability Statement:All genotypic and phenotypic information used in this research are freely accessible and can be found in the R package documentation. The maize data can be accessed as data (cornHybrid), and data (wheatLines). The script for all analysis can be found inS1 File.
Funding:CONACYT (Mexico) funded PhD studies of GCP, but the funder had no role in study design, data collection and analysis, decision to publish, or preparation of the manuscript.
particularly, Henderson’s mixed model equations in 1949 (not published until 1963 with the help of Searle), gave rise in animal breeding to kinship-based selection, breeding value estima-tion, and prediction of breeding materials [5–7]. More recently, genetic markers have been exploited in plant breeding to detect quantitative trait loci (QTL) for marker assisted selection (MAS). However, after decades of QTL studies, the real application and value of the QTL para-digm in plant breeding has been questioned [8,9].
With the advent of inexpensive and high-throughput genotyping technologies in the last decade, a new plant and animal breeding selection paradigm called genomic selection has emerged [4]. Genomic selection allows the prediction of the phenotypes of individuals based on known marker effects or genetic relationships (kinship-based), and in plants it has been used for predicting trait performance of hybrids and unrealized crosses. One of the first meth-ods proposed for genomic selection was a statistical method called ridge regression (RR), where the ridge parameter (λ) can be observed in a mixed model framework as theσ2e/σ2u ratio between the residual and random effect variances. This can be applied in the genomic context whereσ2uis the genetic variance and best linear unbiased predictor (BLUP) can be interpreted as the genomic estimated breeding values (GEBV), where the random effect refers to genotype effects and the variance-covariance structure is the additive or genomic relation-ship matrix (AorAg). The genetic variance can also be interpreted in terms of marker effects in the form of marker-based BLUPs [10–13].
The use of mixed models to estimate breeding and genetic values can be generalized to more complex scenarios. Mixed models can be used to address general and specific combining abil-ities in hybrid populations. In particular, they can be used to predict the performance of unrea-lized crosses, such as single cross hybrids in species which commonly display additive and dominance (heterosis) effects [7,14]. These effects, also called general and specific combining abilities (GCA and SCA, respectively), can be dissected in a mixed model as random effects with a particular variance-covariance structure (G) and with distribution:
y u ε 2 6 6 4 3 7 7 5 Xb 0 0 2 6 6 4 3 7 7 5 ;
ZGZ0þR ZG R
GZ0 G 0
R 0 R
2 6 6 4 3 7 7 5 0 B B @ 1 C C A being G¼ K 1s 2
u1 0 0 0
0 K
2s 2
u2 0 0
0 0 . . . 0
0 0 0 K
js 2 uj 2 6 6 6 6 6 4 3 7 7 7 7 7 5
Here,XandZare incidence matrices for fixed and random effects respectively,R=Iσ2e,
Kiis the variance covariance structure for the ithrandom effect andσ2uiis the variance com-ponent for the ithrandom effect. Such covariance structures in a general mixed model are usually unknown, but in genomic selection theory such covariance structures are expressed as relationships among individuals, estimated by an additive, genomic, or other type of rela-tionship matrix [13]. Despite all the molecular and statistical advances that allow genomic selection, there is few open source genomic selection or mixed model software that allows the modeling of several variance components at a time and particularly the modeling of SCA effects by likelihood methods, such as some popular R packages; regress, and EMM-REML [13,15–19]. The purpose of this paper is to describe the R packagesommer(solving mixed model equations in R), an open-source REML-based package that can handle more than one variance component, and at the same time allows for flexible specification of var-iance-covariance structures of random effects and compare it to popular Bayesian and Likelihood-based software.Sommeris especially useful for hybrid prediction of species dis-playing strong heterotic or specific combining ability effects. The package relies on three algorithms based on maximum likelihood (ML) and restricted maximum likelihood Abbreviations:AI, average information algorithm;
(REML); efficient mixed model association (EMMA) [20], direct average information (AI) [21,22], and expectation maximization (EM) [23,24]. In addition,sommerincludes other kernels for calculating additive, dominance and epistatic relationship matrices [25] and per-form genome wide association studies (GWAS) (the software can be found and downloaded athttps://cran.rstudio.com/web/packages/sommer/[verified 10 May 2016]). The key fea-tures of the package are demonstrated using wheat data (Triticum aestivumL.) for genomic prediction of species displaying small or null heterotic effects where only the additive kernel is required (a single random effect), and prediction of single-cross maize hybrids (Zea mays
L.), which require the use of additive and dominance kernels (multiple random effects), and can be extended to any species displaying heterotic effects.
Materials and Methods
Algorithms
Thesommerpackage solves the mixed model equations proposed by Henderson [6], and it has been implemented to work with incidence matrices and known variance covariance matrices for each random effect through the use of themmerfunction and a ASReml-type version namedmmer2. If an incidence or a variance-covariance matrix is omitted, the software assumes an identity matrix. Currently, three algorithms for variance component estimation are supported; efficient mixed model association (EMMA) [18], average information (AI) [21,22], and expectation maximization (EM) [23,24]. The EMMA method is useful when only one var-iance component other than the error varvar-iance component (σ2e) is estimated [25]. When more than one variance component needs to be estimated, the AI and EM algorithms should be used. The AI algorithm is the default, similar to other commercial software such as ASReml [21].
Genomic breeding value estimation in a wheat population
We performed genomic breeding value estimation (GEBV) and hybrid prediction with wheat data, and the results were compared to other genomic selection and mixed model software, including rrBLUP [13], ASReml [21], regress (used by synbreed as well) [17,18], EMMREML [19], MCMCglmm [15], and BGLR [16]. We used the wheat data contained in the R package BGLR consisting of 599 inbred lines genotyped with 1279 diversity array technology (DArT) markers [16]. Phenotypic data consisted of grain yield (GY) for the 599 lines from the historical CIMMYT's Global Wheat Program evaluated in four mega-environments.
From the 599 wheat lines, 179,101 distinct single crosses can be performed. Kinship-based BLUP prediction for the 599 lines were obtained using rrBLUP (ridge regression), ASReml (average information), regress (Newton-Raphson), EMMREML (modified EMMA), BGLR (using the Reproducing kernel Hilbert space [RKHS] kernel), MCMCglmm (Gibbs sampling) and the three algorithms implemented insommer(AI, EM, and EMMA). Similarity among BLUPs using all software was performed in R and displayed in tables and figures [26]. The genomic estimated breeding values (GEBV) for each of the 599 inbred lines was used to predict the performance of possible crosses as the average among the breeding value of the parental lines. The mixed model fitted has the form:
y¼XbþZuþε with variance:
and the mixed model equations for this model are:
X0R 1X X0R 1Z
Z0R 1X Z0R 1Z þG 1
" # 1
X0R 1
y
Z0R 1
y
" #
¼ b
u " #
Here,G=Kσ2u, is the variance covariance matrix of the random effect u, from a multivari-ate normal distribution u ~ MVN(0,Kσ2u), K being, in the genomics context, the additive or genomic relationship matrix (AorAg).XandZare incidence matrices for fixed and random effects respectively, andRis the matrix for residuals (hereIσ2e). A mixed model with a single var-iance component other than the error (σ2e) can be used to estimate the genetic variance (σ2u) along with genotype BLUPs to exploit the genetic relationships between individuals coded inK
(A). The genomic relationship matrix was constructed according to VanRaden whereK=ZZ’/ 2Spi(1-pi) [27]. Genotype BLUPs were calculated and considered equal to the GEBV and these were used to predict the performance of the 179,101 possible crosses as the average of parental genomic breeding values. We fitted this model using thesommerpackage by specifying the inci-dence and variance-covariance matrices and using the three algorithms implemented (AI, EM, EMMA). In addition, a five-fold cross validation was performed to calculate the predictive corre-lation for grain yield in the four mega environments available for the wheat data using the som-merpackage. In addition, heritability was estimated as h2=σ2
u/σ2u+σ2e.
Single cross hybrid prediction in corn
Genotypic data was simulated consisting of 511 SNP markers in 40 inbred lines belonging to two heterotic groups (20 in each). Phenotypic data was simulated consisting of grain yield (GY) and plant height (PH) for the 40 parents and 100 out the 400 possible hybrids produced from the single-cross of both heterotic groups allowing for heterosis. Genotypes of the 40 par-ents were used to estimate the genomic relationship matrices asK=ZZ’/2Spi(1-pi) [27] for both heterotic groups (K1andK2), and the genomic relationship matrix for the 400 possible hybrids was obtained as the Kronecker product of the parental genomic relationship matrices
K1K2(K3). Given that the phenotypic data for the possible crosses was not masked, the hybrids were predicted by estimating the BLUPs for general combining abilities in males and females (GCAfemale, GCAmale) and specific combining abilities (SCA) of crosses along with their variance components (σ2GCA1,σ2GCA2,σ2SCA). The model has the form:
y¼XbþZ1u
GCA1þZ2uGCA2þZ3uSCAþε The mixed model equations for this model are:
X0R 1X X0R 1Z
1 X0R
1Z
2 X0R
1Z 3 Z
10R 1X Z
10R 1Z
1þG 1
1 Z10R 1Z
2 Z10R 1Z
3 Z
20R
1X Z 20R
1Z
1 Z20R 1Z
2þG 1
2 Z20R 1Z
3 Z
30R
1X Z 30R
1Z
1 Z30R 1Z
2 Z30R 1Z
3þG 1 3 2 6 6 6 6 6 4 3 7 7 7 7 7 5 1
X0R 1
y
Z 10R
1
y
Z 20R
1y Z
30R 1 y 2 6 6 6 6 6 4 3 7 7 7 7 7 5 ¼ b
uGCA1
uGCA2
uSCA 2 6 6 6 6 6 4 3 7 7 7 7 7 5
whereβis the vector offixed effects, uGCA1, uGCA2, uSCAare the BLUPs for GCAfemale, GCAmale, and SCA effects,XandZs are incidence matrices forfixed and random effects respectively,Ris the matrix for residuals (hereIσ2e), andG-11,G-12,G-13are the inverse of the variance-covariance matrices for random effects. The BLUPs uGCA1, uGCA2, uSCAwere used to predict the rest of the sin-gle-crosses as the sum of their respective GCA and SCA effects.
estimate more than one variance component. The model could not be implemented in rrBLUP which is also limited to a single variance component. In the BGLR package the Reproducing kernel Hilbert space [RKHS] kernel was used, in ASReml and MCMCglmm the‘ginverse’ argu-ment was used to specify the variance-covariance structures, and in the regress package the multiple random effects model using theZKZ’kernel was fitted. EMMREML uses a similar syntax thansommer. Results from other software were compared withsommer. In addition, a five-fold cross validation was performed to calculate the prediction accuracy for plant height and grain yield in this population.
In order to show the advantage of fitting a model including dominance (SCA) compared to a pure additive models (GCA) with respect to the prediction ability for species displaying het-erotic effects, two additional models were fitted including only GCA effects; 1) both parents having the same variance component and 2) each parent from a different heterotic group hav-ing a different variance component:
G¼ ½Ks2
u and G¼
K
1s 2
u1 0
0 K
2s 2 u2
2
4
3
5
Models were compared with respect to their prediction ability after 500 runs of a five-fold cross validation for plant height and grain yield. Models were fitted usingsommerwith the default AI algorithm. In addition, heritability for both trait was estimated as; h2= (σ2
GCA1+ σ2GCA2) / (σ2GCA1+σ2GCA2+σ2e).
Capabilities with big data sets and comparison with other software
In order to test the capabilities ofsommercompared with other software, posterior analysis were performed with REML-based counterparts: rrBLUP, regress, ASReml, EMMREML, and Bayesian-based: BGLR (iterations = 13000, burn-in = 2000), and MCMCglmm (itera-tions = 13000, burn-in = 2000; default parameters). Such comparisons were performed using bigger data sets. We simulated phenotypic and genotypic data for 5000 individuals with 10000 markers for a single trait and single additive kernel, with heritability h2= 0.5 and GEBVs were estimated. Computing time as a function of the population size (N) for the different ML/REML algorithms found across software packages for a single variance component scenario was recorded. We recorded elapsed times for population sizes from 500 to 5000 in intervals of 500 increments and plotted using R.The phenotypic and genotypic data available from Technow et al. [28] was used to predict the genetic value (GV) of 10578 possible single cross hybrids from the cross of the Flint by Dent heterotic groups, which included additive and dominance effects (three variance compo-nents). The same model was fitted withsommercounterparts when possible for time and flex-ibility comparison purposes. Flint and Dent lines were genotyped with 35,432 SNP markers. Computing time as a function of the population size (N) was recorded for population sizes from 1000 to 8000 in intervals of 1000 increments usingsommerand other REML-based soft-ware with ability to fit multiple random effects.
All genotypic and phenotypic information used in this research is freely accessible and can be found in the R package documentation. The maize data can be accessed as data(cornHybrid), data(wheatLines), and data(Technow_data). The script for all analysis can be found inS1 File.
Results and Discussion
and variance covariance matrices for each random effect. The function returns the variance components, the maximized log-likelihood, best linear unbiased estimators (BLUEs) for fixed effects and the BLUP solutions for random effects, along with other information of interest such as residuals, Akaike information criterion (AIC), Bayesian information criterion (BIC), etc.
In addition to the mixed model solver able to fit genome wide association (GWA) models in diploid and polyploidy organisms based on Yu et al. [29] and Rosyara et al. [30], thesommer
package has been equipped with kernels to estimate additive relationship matrices based on Endelman [13] and VanRaden [27], and dominance and epistatic relationship matrices based on Su et al. [31] and Muñoz et al. [25], calculated respectively as:
A¼ ZZ
0
2Pm
j¼1pjð1 pjÞ
D¼ ZZ
0
Pm
j¼12pjqjð1 pjqjÞ
Eaa¼A#A ðadditive by additive interactionsÞ Edd¼D#D ðdominance by dominance interactionsÞ Ead¼A#D ðadditive by dominance interactionsÞ
Denoting # the Hadamard product between matrices,Zbeing the scaled marker matrix, p and q the allelic frequencies for the jthmarker (j = 1. . .m). Markers are coded -1, 0, 1 with respect to a reference allele for the null homozygous, heterozygote, and positive homozygote respectively, for the additive relationship matrixA. On the other hand, markers are coded as 0 and 1’s for homozygotes and heterozygotes respectively for the dominance relationship matrixD.
Additional functions to 1) draw genetic maps, 2) convert letter format to numeric data, and 3) design matrices for half diallel designs, have been included in the package as well and are documented within the software.
Genomic breeding value estimation in wheat
model is easily fitted by specifying the variance-covariance structureG=Kσ2u, withKbeing the additive or genomic relationship matrix (AorAg) among genotypes.
The BLUPs obtained bysommerwere compared with rrBLUP [13], ASReml [21], regress [17], EMMREML [19], BGLR [16], and MCMCglmm [15]. We found all statistics such as BLUPs (u), BLUEs (βs), and variance components (σ2s) to be equal, showing that all software provided similar and sometimes identical results. Similar results were obtained using all the algorithms implemented insommer(EMMA, EM, AI) to estimate variance components and
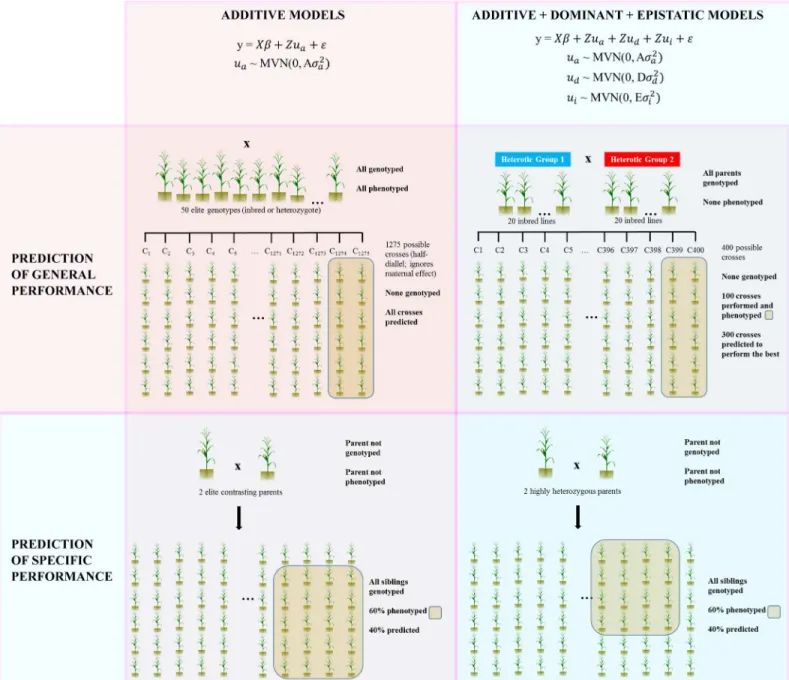
Fig 1. Examples of genome-assisted prediction performed usingsommer.In the first row of the figure, genomicprediction of general performance (cross performance prediction)is summarized; in the 1stsquare, the model to predict crosses with a single additive kernel (wheat example) is depicted. In the 2ndsquare the prediction including additive, dominance and epistatic kernels is shown (single cross hybrid example). In the second row, genomic
prediction of specific performance (within cross performance prediction)is shown; in the 1stsquare, prediction within a biparental cross is shown using a single additive kernel for species displaying small or null heterotic effects whereas in the 2ndsquare prediction within biparental populations is shown using additive, dominance and epistatic kernels (examples are included in the package).
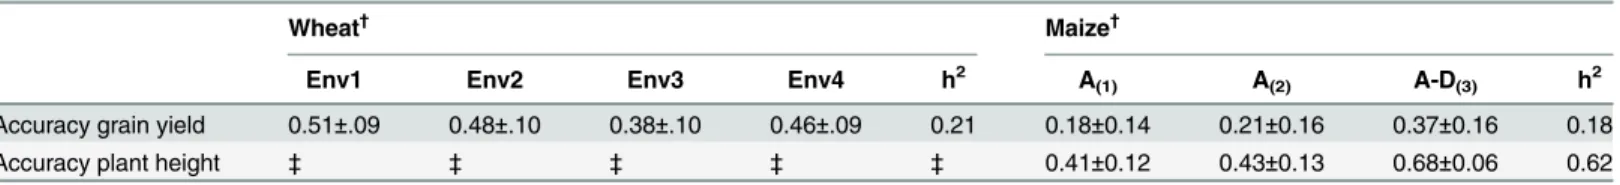
other parameters. However, the EM and AI algorithms converged slower than EMMA when only one variance component was estimated due to the iterative procedure used with EM and AI. We found prediction accuracies of 0.51, 0.48, 0.38 and 0.46 for grain yield in the 4 mega-environments, respectively, which was consistent with the expected predictability upper bound expected for the prediction accuracy, which is the square root of heritability, h2= 0.21 and
ffiffiffiffiffi h2 p
= 0.46 (Table 1) in the kinship-based prediction.
Single cross hybrid prediction in corn
One of the strengths of thesommerpackage is the ability to specify more than one random effect and their variance-covariance structure, which is usually necessary when genomic selec-tion needs to be performed in species displaying heterotic effects. The model requires the esti-mation of GCA effects for parents and SCA effects for specific crosses. We used the simulated data for crosses between different heterotic groups that displayed heterotic effects for grain yield. We estimated the genomic relationship matrix (Ag) for both groups of lines (K1andK2) and calculated the Kronecker product of both matrices to obtain the SCA relationship matrix (K3), in order to predict the other 300 hybrids. We fitted the following model specifying the variance-covariance matrices withsommerand compared with ASReml [21], regress [17], EMMREML [19], BGLR [16] and MCMCglmm [15]. In sommer the model can be fitted in the following manner:
libraryðsommerÞ
dataðcornHybridÞ
A¼cornHybrid$K
y¼cornHybrid$Yield
X1¼model:matrixðLocation;data¼cornHybridÞ
Z1¼model:matrixðGCA1 1;data¼cornHybridÞ
Z2¼model:matrixðGCA2 1;data¼cornHybridÞ
Z3¼model:matrixðSCA 1;data¼cornHybridÞ
K1¼A½levelsðcornHybrid$GCA1Þ;levelsðcornHybrid$GCA1Þ
K2¼A½levelsðcornHybrid$GCA2Þ;levelsðcornHybrid$GCA2Þ
K3¼kroneckerðK1;K2Þ
ETA¼listðGCA1¼listðZ¼Z1;K¼K1Þ;GCA2¼listðZ¼Z2;K¼K2Þ;SCA¼listðZ¼Z3;K¼K3Þ
ans¼mmerðy¼y;Z¼ETA;method¼AIÞ
Table 1. Cross-validation of prediction accuracies usingsommer(5-fold) for wheat and maize populations.
Wheat† Maize†
Env1 Env2 Env3 Env4 h2 A(1) A(2) A-D(3) h2
Accuracy grain yield 0.51±.09 0.48±.10 0.38±.10 0.46±.09 0.21 0.18±0.14 0.21±0.16 0.37±0.16 0.18
Accuracy plant height ‡ ‡ ‡ ‡ ‡ 0.41±0.12 0.43±0.13 0.68±0.06 0.62
Prediction accuracies for grain yield were obtained for each of the 4 mega environments available for the 599 lines of wheat. Prediction accuracies for grain yield and plant height were obtained for a maize population consisting of 100 hybrids tested in 4 locations using only additive (GCA) effects with a single variance component for both parents [A(1)], one variance component for each parent (GCA1and GCA2; A(2)), and additive (GCA) and dominance (SCA) effects [A-D(3)].
†Accuracy values are averages over 500 runs of a 5-fold cross validation. ‡Trait not evaluated in wheat.
or using a data frame
ans¼mmer2ðy1;random¼GCA1þGCA2þSCA;G¼listðGCA1¼K2;GCA2
¼K2;SCA¼K3Þ;data¼cornHybridÞ
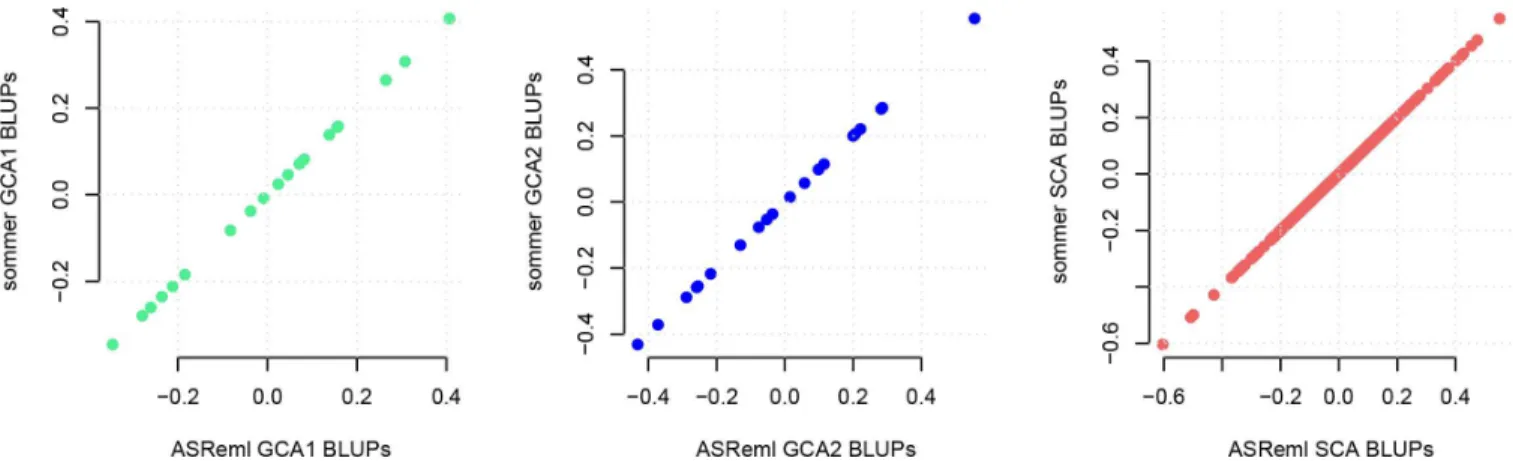
The BLUPs for uGCA1, uGCA2, and uSCAeffects obtained bysommerand ASReml were the same (Fig 2) since they use by default the AI algorithm. On the other hand,sommerperformed faster due to the use of the direct inversion AI algorithm compared to the mixed model equa-tion based AI algorithm found in ASReml, based on the mathematical properties found by Lee et al. [22] when multiple random effects with dense covariance structures are present, and the use of an eigen decomposition on theGstructure when there is a simple random effect [32] (please refer to the cites for more details on the differences between the two AI algorithms). Slight differences were found when comparing BLUPs fromsommerwith BGLR and
MCMCglmm. However, this was expected due to the fact that Bayesian methods are based on Gibbs sampling, and require a high number of iterations to achieve the same parameters than likelihood software. In addition,sommer, regress and EMMREML were the fastest taking ~5 seconds to estimate the variance components and perform all calculations, but regress overesti-mated the error variance and returned some negative variance components, indicating that some constraints have not been implemented yet. EMMREML handles multiple random effects but does not return the variance components other than the first one. On the other hand, BGLR (iterations = 13000, burn-in = 2000) took 2 minutes and 2 seconds (sommerwas 25 times faster), and MCMCglmm (iterations = 13000, default) took 7 minutes and 13 seconds (sommerwas 87 times faster), showing that speed is one of the strengths of using REML-based software in dense genetic models.
Given that phenotypic data was masked for the corn hybrids, cross validation was con-ducted in order to assess the prediction accuracy of hybrids for plant height and grain yield using the hybrid prediction method stated above. The estimated heritability (h2) for grain yield was 0.18, and 0.62 for plant height in this population. According to selection theory, these values for grain yield set the upper bound for prediction to 0.43 for grain yield and 0.79 for plant height (pffiffiffiffiffih2). We found consistent results by usingfive-fold cross validations, which resulted in an average of 0.37±0.16 prediction accuracy for grain yield and 0.67±0.061 for plant height (Table 2;Fig 3). As expected, hybrids resulting from different heterotic groups were
Fig 2. Best linear unbiased prediction (BLUP) comparisons for general and specific combining ability effects (GCA and SCA) using
sommerversus ASReml.BLUPs for GCA and SCA related to grain yield were computed in a corn population with 400 individuals evaluated in 4 locations usingsommerand ASReml.Sommerestimates are shown on the y axis and are similar to results from the ASReml estimates shown on the x axis.
predicted taller and more productive than predicted hybrids resulting from a cross within the same heterotic group.
Additive vs additive-dominance models
We found an increase in prediction ability when models fitted included additive and domi-nance effects (GCA+SCA) relative to a pure additive model (GCA) under the two assumptions that both parents have the same additive variance or each parent from a different heterotic group has its own additive variance. For grain yield the prediction accuracy changed from ~0.18–0.20 for the purely additive models to 0.52 in a model including GCA and SCA effects, whereas for plant height the prediction accuracy changed from 0.41–0.43 for the additive mod-els to 0.85 for the model including additive and dominance effects (GCA+SCA;Table 2). This highlights the importance of considering dominance effects in addition to the only-additive models. The package provides kernels to calculate additive, dominance, and epistatic
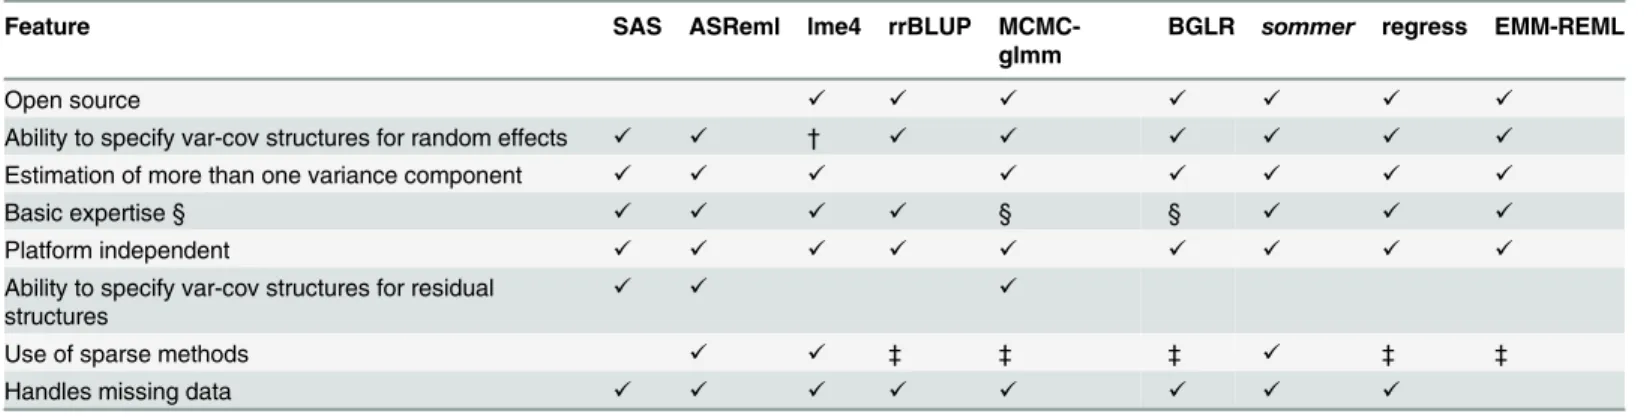
Table 2. Comparison ofsommerversus the most common mixed model software available for genomic selection.
Feature SAS ASReml lme4 rrBLUP MCMC-glmm
BGLR sommer regress EMM-REML
Open source ✓ ✓ ✓ ✓ ✓ ✓ ✓
Ability to specify var-cov structures for random effects ✓ ✓ † ✓ ✓ ✓ ✓ ✓ ✓
Estimation of more than one variance component ✓ ✓ ✓ ✓ ✓ ✓ ✓ ✓
Basic expertise § ✓ ✓ ✓ ✓ § § ✓ ✓ ✓
Platform independent ✓ ✓ ✓ ✓ ✓ ✓ ✓ ✓ ✓
Ability to specify var-cov structures for residual structures
✓ ✓ ✓
Use of sparse methods ✓ ✓ ‡ ‡ ‡ ✓ ‡ ‡
Handles missing data ✓ ✓ ✓ ✓ ✓ ✓ ✓ ✓
Advantages and disadvantages of each software with check marks indicating whether they possess the stated feature.
†Thepedigreemmpackage which is an extension oflme4allows the user to introduce pedigrees, but it does not allow the user to provide the variance-covariance matrices directly. Examples available in thepedigreemmpackage were run usingsommerobtaining similar results, butsommerran 4 times faster thanpedigreemm. Examples are included insommerdocumentation.
‡Information not available.
§ These packages are based on Bayesian methods requiring the user to have a more advanced statistical background to decide the correct number of iterations, burn-in length and ability to analyze trace plots, and therefore the feature was defined as‘Basic expertise’.
doi:10.1371/journal.pone.0156744.t002
Fig 3. Prediction accuracy results usingsommerin corn hybrids with a 5-fold cross validation.Cross validation results for plant height in a corn population of 400 individuals evaluated in 4 locations are shown in blue, whereas grain yield cross validation results for the same population is shown in red. Each dot represents the average of one run of a 5-fold cross validation.
relationship matrices and examples of their use in the documentation, which have been shown to increase prediction accuracies in certain scenarios and family structures [31].
Mixed model software availability and big data sets
There is limited open-source and user-friendly mixed models software that allow flexible speci-fication of variance-covariance structures for random effects. We comparedsommerand some of the most popular mixed model software available to highlight the strengths of this new soft-ware (Table 2). This software represents a valuable resource for genomic selection and GWAS studies, but it can also be used as any other mixed model software for analysis of non-plant and animal breeding experiments.
Although we have shown genomic selection applications using a kinship-based estimation of GEBV, some models depend on knowing marker effects, such as marker × environment interactions [33–35], which can be implemented as well using thesommerpackage. Half diallel designs and genome wide association studies (GWAS), and general mixed model analysis, can
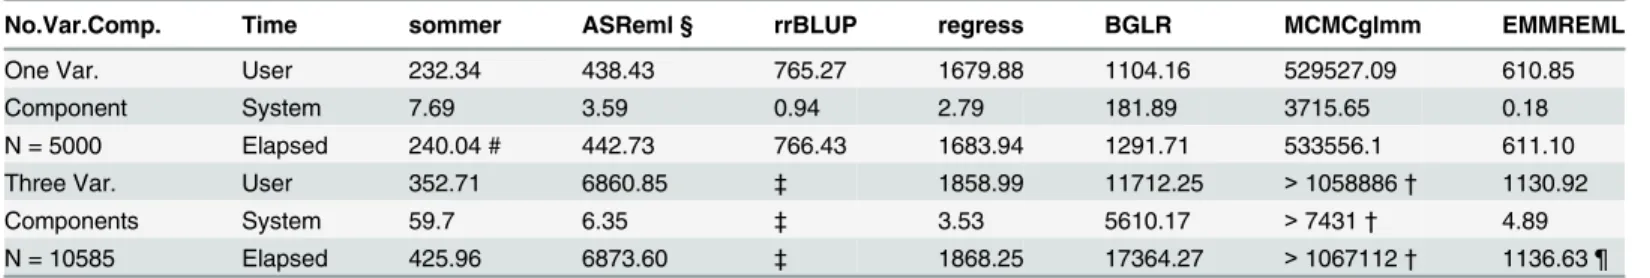
Table 3. Time comparison among different software for densest genomic models tested in the study.
No.Var.Comp. Time sommer ASReml § rrBLUP regress BGLR MCMCglmm EMMREML
One Var. User 232.34 438.43 765.27 1679.88 1104.16 529527.09 610.85
Component System 7.69 3.59 0.94 2.79 181.89 3715.65 0.18
N = 5000 Elapsed 240.04 # 442.73 766.43 1683.94 1291.71 533556.1 611.10
Three Var. User 352.71 6860.85 ‡ 1858.99 11712.25 >1058886† 1130.92
Components System 59.7 6.35 ‡ 3.53 5610.17 >7431† 4.89
N = 10585 Elapsed 425.96 6873.60 ‡ 1868.25 17364.27 >1067112† 1136.63 ¶
Time consumption for a GBLUP model with a single variance component (additive) with 5000 individuals and 10000 markers is shown in thefirst row. A GBLUP model with 3 variance components (additive, dominance, epistasis) with 10,585 hybrids to be predicted genotyped with 35,432 SNPs is displayed in the second row. The two models represent the biggest population sizes used in the study to highlight the differences when big data is encountered. ‡No more than one variance component other that the error can be estimated.
†Work stopped after 12 days running the model.
§ In both models ASReml returned a warning message of abnormal termination.
¶ Although EMMREML can handle multiple random effects does not return the value for the variance components and cannot handle missing data. # Using the average information with eigen decomposition proposed by Lee et al. [22].
doi:10.1371/journal.pone.0156744.t003
Fig 4. Time performance for different algorithms.In A) different color lines represent the different likelihood-based algorithms tested for populations sizes from 500 to 5000 in steps of 500 as a function of population size (N) for a single random effect. In B) the different color lines represent the algorithms able to deal with multiple random effects for a model with different population sizes (N), from 1000 to 8000 individuals for 3 random effects (GCA1, GCA2, and SCA).
be performed insommeras well, and examples are included in the documentation of the package.
A bigger data set with 5000 individuals genotyped with 10000 markers each, was simulated in order to test the performance ofsommeragainst their counterparts under a bigger data set scenario with a single random effect.Sommertook 4 minutes to estimate all parameters for N = 5000 whereas, ASReml took 7.37 minutes, rrBLUP took 12.8 minutes, regress took 28.06 minutes, EMMREML 10.18 minutes, BGLR 21.5 minutes, and MCMCglmm 148 hours (using the default parameters specified in the M&M section. All calculations performed in a PC-Dell with processor 3.4 GHz Intel Core i7 and a 16 GB RAM memory). For a model with 3 variance components (GCA1, GCA2, SCA) with dense covariance structures consisting in 10578 hybrids
sommertook 7.1 minutes to estimate all parameters, rrBLUP cannot estimate more than one variance component, regress took 31.13 minutes, ASReml took 114.56 minutes, EMMREML 15.61 minutes, BGLR took 289.4 minutes, and MCMCglmm took more than 12 days. This shows an important time reduction usingsommerselected algorithms in comparison with other genomic prediction software in the magnitude of minutes for REML-based, and hours to days compared to Bayesian-based software (Table 3).
We use the simulated dataset with 5000 individuals and 10000 markers to show how the computing time behaves as a function of the population size (N) for the different ML/REML algorithms found across software packages. We recorded the elapsed time for different popula-tion sizes from 500 to 5000 in intervals of 500. We found all algorithms to have a similar com-putation time for small population sizes (Fig 4A). As the problem increased in complexity (i.e. above 2000 individuals) we found the EMMA and AI algorithm using the eigen decomposition (AI-eig) to perform better than other algorithms such as EM and NR and AI-D. The time increment followed a quadratic behavior which exemplifies the issue of dealing with big popu-lations (Fig 4B). The use of sparse methods such as the eigen decomposition on covariance matrices proposed by Lee and van der Werf [32] and Zhou and Stephens [36] constitute an important alternative to confront the population size increment that the researcher should take advantage of. On the other hand, when dealing with multiple random effects and more com-plex structures, we found the AI-D and NR algorithms to perform better than EM and RKHS sampling method.
The efficiency ofsommercompared to most software relies on the use of the direct average algorithm (AI) proposed by Lee et al. [22], which surpasses in performance most algorithms when multiple random effects and dense covariance structures are present, the use the EMMA algorithm [20] or the use of an eigen decomposition in theGcomponent when a single random effect is present [32], and the capability to switch to the expectation maximization algorithm (EM) [23] when covariance structures are rather sparse.
In addition, packages such as BGLR and regress require to form the kernel productZKZ’ for each random effect as an input. This becomes an expensive operation as the model increase in size and complexity, although the Newton-Raphson algorithm performs quite fast, once this kernel has been formed. In the same way, packages such as MCMCglmm and ASReml-R require the inversion of the covariance matrix for the‘ginverse’argument, becoming quite computationally expensive as the covariance structures of the model increases in complexity. This was reflected in the computation time for the three random effects model, where inverting a 10,585 x 10,585 matrix (SCA matrix), corresponded to most of the computation time reported inTable 3for those programs.
Conclusion
The purpose of this paper was to describe and make available a general and flexible mixed model solver with popular and efficient algorithms in order to fit genomic selection models, genome wide association studies (GWAS) in diploid and polyploidy organisms, and other non-genetic analyses. Efficient mixed model association (EMMA), expectation-maximization (EM) and average information (AI) algorithms along with kernel methods for estimating addi-tive, dominance and epistatic relationship matrices were developed and presented for plant breeders and scientists through the new R packagesommer. At the core of the package, the ‘mmer’function allows specification of flexible variance-covariance structures and can be used to solve marker-based and kinship-based versions of the genomic prediction and selection models. Examples using maize data illustrated the strengths ofsommerto increase prediction accuracy in species displaying heterotic effects, which require the estimation of GCA and SCA effects with covariance structures for such random effects. We also showed the functionality of
sommerin species with null or small heterotic effects and mainly additive effects by analyzing a dataset of wheat lines and obtaining similar results at a smaller computation time, and greater flexibility compared to those obtained with other popular software for genomic selection, based on Bayesian statistics and other REML-based software. Future implementations in som-merwill include the addition of residual structures (R structures) to allow users to model spa-tio-temporal trends or longitudinal data, and other popular algorithms to provide more flexibility.
Supporting Information
S1 File. Code for analysis and tables.R code to recreate the analysis. (R)
Acknowledgments
The author thanks Natalia de Leon, Jeffrey Endelman, Juan Zalapa, Brandon Schlautman, Maria Kamenetsky, and Brett Burdo for their helpful comments on the manuscript, and two anonymous reviewers who helped to enhance the quality of the paper with valuable comments and ideas.
Author Contributions
Conceived and designed the experiments: GCP. Performed the experiments: GCP. Analyzed the data: GCP. Contributed reagents/materials/analysis tools: GCP. Wrote the paper: GCP.
References
1. Margulies M, Egholm M, Altman WE, Attiya S, Bader JS, Bemben LA, et al. Genome sequencing in microfabricated high-density picolitre reactors. Nature 2005, 437:376–380. PMID:16056220
2. Goddard ME, and Hayes BJ. Mapping genes for complex traits in domestic animals and their use in breeding programmes. Nat. Rev. Genet. 2009, 10:381–391. doi:10.1038/nrg2575PMID:19448663
3. Gianola D, and Rosa GJM. One Hundred Years of Statistical Developments in Animal Breeding. Annu. Rev. Anim. Biosci. 2015, 3:19–56. doi:10.1146/annurev-animal-022114-110733PMID:25387231
4. Sax K. The Relation between Chromosome Number, Morphological Characters and Rust Resistance in Segregates of Partially Sterile Wheat Hybrids. Genetics 1923, 8(4):301–321. PMID:17246015
5. Henderson CR. Selection index and expected genetic advance. In Statistical Genetics and Plant Breeding, ed. Hanson WD, Robinson HF, Publ. 992. Washington, DC: Natl. Acad. Sci. Natl. Res. Counc. 1963 pp. 141–63.
7. Bernardo R. Prediction of maize single-cross performance using RFLPs and information from related hybrids. Crop Sci. 1994, 34:20–25.
8. Bertrand CY, and Mackill DJ. Marker-assisted selection: an approach for precision plant breeding in the twenty-first century. Phil. Trans. R. Soc. B. 2008, 363:557–572. doi:10.1098/rstb.2007.2170PMID: 17715053
9. Xu Y, and Crouch JH. Marker-Assisted Selection in Plant Breeding: From Publications to Practice. Crop Sci. 2008, 48:391–407. doi:10.2135/cropsci2007.04.0191
10. Whittaker JC, Thompson R, and Denham MC. Marker-assisted selection using ridge regression. Genet. Res. Camb. 2000, 75:249–252.
11. Meuwissen TH, Hayes BJ, and Goddard ME. Prediction of total genetic value using genome-wide dense marker maps. Genetics 2001, 157:1819–1829. PMID:11290733
12. Searle SR, Casella G, and McCulloch CE. Variance components. John Wiley & Sons, Hoboken, NJ. 2006
13. Endelman JB. Ridge regression and other kernels for genomic selection with R package rrBLUP. Plant Genome 2011, 4:250–255.
14. Zhao Y, Mette MF, and Reif JC. Genomic selection in hybrid breeding. Plant Breeding 2015, 134:1–10.
15. Hadfield JD. MCMC Methods for Multi-Response Generalized Linear Mixed Models: The MCMCglmm R Package. Journal of Statistical Software 2010, 33(2), 1–22. Available:http://www.jstatsoft.org/v33/ i02/.
16. Pérez P, de los Campos G. Genome-Wide Regression & Prediction with the BGLR Statistical Package. Genetics 2014; doi:10.1534/genetics.114.164442
17. Clifford D and McCullagh P. The regress function. R News 2006, 6(2):6–10
18. Wimmer V, Albrecht T, Auinger HJ and Schoen CC (2012) synbreed: a framework for the analysis of genomic prediction data using R. Bioinformatics, 28: 2086–2087 doi:10.1093/bioinformatics/bts335 PMID:22689388
19. Deniz Akdemir and Okeke Uche Godfrey (2015). EMMREML: Fitting Mixed Models with Known Covar-iance Structures. R package version 3.1. Available:http://CRAN.R-project.org/package=EMMREML
20. Kang HM, Zaitlen NA, Wade CM, Kirby A, Heckerman D, Daly MJ, et al. Efficient control of population structure in model organism association mapping. Genetics 2008, 178:1709–1723. doi:10.1534/ genetics.107.080101PMID:18385116
21. Gilmour AR, Thompson R, Cullis BR. Average Information REML: An efficient algorithm for variance parameter estimation in linear mixed models. Biometrics 1995, 51(4):1440–1450.
22. Lee SH, Werf JH van der. An efficient variance component approach implementing an average informa-tion REML suitable for combined LD and linkage mapping with a general complex pedigree. Genetics, Selection, Evolution 2006, 38(1):25–43. doi:10.1186/1297-9686-38-1-25PMID:16451790
23. Searle SR. Applying the EM algorithm to calculating ML and REML estimates of variance components. Paper invited for the 1993 American Statistical Association Meeting, San Francisco.
24. Bernardo R. Breeding for quantitative traits in plants. Second edition. Stemma Press. Woodbury, MN; 2010.
25. Munoz PR, Marcio FR, Resende Jr., Gezan SA, Vilela Resende MD, de los Campos G, et al. Unravel-ing Additive from Nonadditive Effects UsUnravel-ing Genomic Relationship Matrices. Genetics 2014, 198:1759–1768. doi:10.1534/genetics.114.171322PMID:25324160
26. R Core Team. R: A language and environment for statistical computing. R Foundation for Statistical Computing, Vienna, Austria 2016. Available:http://www.R-project.org/.
27. VanRaden PM. Efficient Methods to Compute Genomic Predictions. Journal of Dairy Science 2008, 91 (11):4414–23. doi:10.3168/jds.2007-0980PMID:18946147
28. Technow F, Schrag TA, Schipprack W, Bauer E, Simianer H, and Melchinger AE. Genome Properties and Prospects of Genomic Prediction of Hybrid Performance in a Breeding Program of Maize. Genetics 2014, 197:1343–1355. doi:10.1534/genetics.114.165860PMID:24850820
29. Yu J, Pressoir G, Briggs WH, Bi IV, Yamasaki M, Doebley JF, et al. A unified mixed-model method for association mapping that accounts for multiple levels of relatedness. Genetics 2006, 38:203–208. PMID:16380716
30. Rosyara UR, De Jong WS, Douches DS, Endelman JB. Software for Genome-Wide Association Stu-dies in Autopolyploids and Its Application to Potato. The Plant Genome 2016, doi:10.3835/
plantgenome2015.08.0073
Polymorphism Markers. PLoS ONE 2012, 7(9): e45293. doi:10.1371/journal.pone.0045293PMID: 23028912
32. Lee SH and van der Werf JHJ. MTG2: An efficient algorithm for multivariate linear mixed model analysis based on genomic information. Bioinformatics 2016, doi:10.1093/bioinformatics /btw012
33. Crossa J, de los Campos G, Pérez P, Gianola D, Burgueño J, Araus JL, et al. Prediction of genetic values of quantitative traits in plant breeding using pedigree and molecular markers. Genetics 2010, 186:713–724. doi:10.1534/genetics.110.118521PMID:20813882
34. Bernardo R, Moreau L, and Charcosset A. Number and fitness of selected individuals in marker-assisted and phenotypic recurrent selection. Crop Sci. 2006, 46:1972–1980.
35. Zhong S, and Jannink JL. Using quantitative trait loci results to discriminate among crosses on the basis of their progeny mean and variance. Genetics 2007, 177:567–576. PMID:17660556