Invited Review
Value of genomics in breeding objectives for beef cattle
Michael D. MacNeil1,2
1 Delta G, Miles City, Montana, USA.
2 University of the Free State, Bloemfontein, South Africa.
ABSTRACT - The objective of this research was to discern the contribution of genomic information to multiple-trait breeding objectives and thus understand the economic value of that information. True genetic values were simulated for each of n, possibly correlated, traits. These true genetic values, combined with uncorrelated random noise, resulted in both genomic and phenotypic estimated breeding values, EBVg and EBVp, respectively. The separate EBV were then merged (blended) as a function of their respective accuracies to produce a unified EBV for each of the n traits. Finally, for each simulated animal (N = 10000), the sum of products of economic weights and EBV was calculated to predict the economic value (net merit) of the individual. Accuracies of the EBV for the individual traits and net merit were calculated as correlations between predicted and true values. Predicted responses to selection for individual traits included in the breeding objectives were enhanced from 9% to 76% with the greatest benefit accorded to those economically relevant traits that are recorded after selection decisions are made at one year of age, measured less frequently in national cattle evaluation, or often predicted using information from indicator traits. Combining the EBV to predict net merit for terminal and maternal breeding objectives resulted in predicted increases in selection response due to incorporation of genomic information of 27% and 57%, respectively. The results are interpreted to suggest that the economic benefit to be derived from selection based on a multiple-trait economic breeding objective, which is predicted using genomically enhanced EBV, can substantially exceed the present day cost of genotyping the candidates for selection.
Key Words: animal breeding, assisted selection, genetic gain, production system
ISSN 1806-9290
www.sbz.org.br R. Bras. Zootec., 45(12):794-801, 2016
Received October 15, 2015 and accepted August 29, 2016. Corresponding author: [email protected] http://dx.doi.org/10.1590/S1806-92902016001200010
Copyright © 2016 Sociedade Brasileira de Zootecnia. This is an Open Access article distributed under the terms of the Creative Commons Attribution License (http://creativecommons.org/licenses/by/4.0/), which permits unrestricted use, distribution, and reproduction in any medium, provided the original work is properly cited.
Introduction
Genomics may have much to offer in the implementation of breeding objectives and conversely well-defined breeding objectives can lead to efficient capture of value from genomics. Advantages of genomic prediction include increased accuracy of estimated breeding values (EBV) for traits that have been components of routine genetic evaluations. Perhaps more importantly, genomic prediction makes it possible to include traits that are too costly or too difficult to measure and traits that are measured too late in life or are sex-limited, such that candidates for selection cannot have EBV with high accuracy at the time when selection decisions are made. In dairy, genomic selection also allows for a marked reduction in generation interval.
Material and Methods
In general, a breeding objective (O) reflects a functional relationship between breeding values (BV) of biological traits and profit (e.g., O = a1BV1 + a2BV2 + a3BV3 …, in
which ai is the economic value of the i-th economically
relevant trait). Implementation of a breeding objective depends on a genetic evaluation system such that: Ô = a1EBV1 + a2EBV2 + a3EBV3… Derivation of the economic
weights corresponds to the partial derivative of a “profit function” with respect to each trait. The profit function is expected to reflect production system efficiency (Dickerson, 1970, 1976, 1982):
,
in which Rd = annualized replacement cost; Id= annual non-feed cost;Fmd= annual maintenance feed cost;Fpd= annual feed cost for performance (e.g., milk production);
No = number of offspring marketed per breeding female (may be fractional); Do= number of days from weaning to harvest for offspring; Io = daily non-feed cost for progeny during the post-weaning period; Fmo = daily feed cost for maintenance of offspring; Fpo = daily feed cost for performance of offspring; So = annual non-feed cost per offspring marketed; Pd = annualized product marketed from a breeding female (i.e., a cull cow);Vd = unit value of product marketed from a breeding female;Po= annual product marketed from offspring; and Vo = unit value of product marketed from offspring.
It is anticipated that, in many instances, this breeding objective would be transformed from a ratio to some linear function (i.e., income – expense). There is no guarantee that this transformation leads to similar selection criterion with selection based on the linear function, quite possibly leading to the enterprise being rescaled without changing production efficiency (reviewed by Goddard, 1998). It is important to recognize that, while the breeding objective itself may be complex, presentation of the evaluation that results from its use is simple; it is an EBV for profit.
To facilitate calculation of the value of genomic estimates of breeding value, a simplified breeding objective corresponding to feed efficiency, with components average daily gain (ADG) and average daily feed intake (ADFI), was considered. Following Lin (1980), the ratio objective was transformed to a linear one and economic weights for the components of feed efficiency were estimated from the ratio of phenotypic means for the two traits. For this
example, the feed to gain ratio was assumed to be 5:1. Thus, following Henderson (1969), the selection index (I) to improve the feed efficiency breeding objective would be:
,
in which, EBV1 = the EBV for ADG and EBV2 = the EBV
for ADFI. Then let
be the genetic variance-covariance matrix for components of feed efficiency (MacNeil et al., 2013). In this example, the genetic correlation between the components of efficiency was 0.66±0.08 and heritability estimates for ADG and ADFI were 0.25±0.05 and 0.37±0.05, respectively.
Let rp1 and rg1 be accuracies of the EBV for ADG calculated from phenotypes (EBVp1) and genotypes (EBVg1), respectively. Similarly, let rp2 and rg2 be accuracies of the EBV for ADFI, also calculated from phenotypes (EBVp2) and genotypes (EBVg2), respectively. As a consequence of the accuracies being less than 1.0, the variances of the EBV are reduced. Thus, variance ;
variance ; variance ; and variance
, in which Vi is the additive genetic variance of the i-th trait. Then, following Kachman (2013), the EBV for ADG (EBV1) and ADFI (EBV2) that utilize appropriately blended information from phenotypes and genotypes are:
, and
.
The relationships above were then used to simulate a series of data sets with accuracies of phenotypic and genomic EBV that ranged from 0.1 to 0.9 in increments of 0.1. Details are presented for five analysis, in which accuracies of the EBV quartet [EBVp1, EBVg1, EBVp2, and
EBVg2] were [0.50, 0.00, 0.61, and 0.00], [0.50, 0.40, 0.61, and 0.40], [0.50, 0.60, 0.61, and 0.60], [0.60, 0.40, 0.70, and 0.40], and [0.60, 0.60, 0.70, and 0.60].
born during a 4-mo spring calving season and weaned at an average age of 192 d, over a 5-yr period. After weaning, the calves were fed a diet of moderate energy density for an average of 106 d before being transported to a feedlot for finishing. Daily feed intake of individual animals was measured in contemporary groups of 96 steers using a Calan Broadbent Feeding System. A stepwise series of five rations that increased in energy density were used throughout the finishing period. Harvest date was determined to target a contemporary group to an average 1.3 cm fat depth at the 12-13th rib and/or to avoid discounts for under- and over-weight carcasses. In the afternoon before harvest, steers were weighed and transported overnight to the packing plant for harvest and collection of carcass data. Carcass data included harvest date, hot carcass weight, marbling score, fat depth, longissimus muscle area, and percentage kidney, pelvic, and heart fat. In all, the simulation model employed 76 production and economic variables to simulate performance of straightbred Angus. Expenses associated with production were accumulated as they occurred and income was derived solely from the sale of steers at harvest. For the simulation, a stochastic multivariate normal distribution of marbling, yield grade, and carcass weight was used to value the carcasses. Economic values were calculated by approximation of the partial derivatives of profit with respect to driving variables that corresponded to the EBV profile generated from the progeny test data arising from the sires being evaluated. The corresponding
genetic (co)variance matrix employed in the simulation is as follows:
The second objective, for a specialized dam line with calves marketed at weaning, was more recently developed and is unpublished (Table 2). Much of the simulation model used for this objective was similar to that described above for the terminal objective, with the addition of a more detailed description of the cow herd based on a matrix model (Leslie, 1945; 1948) describing development (progress through the life cycle) as a function of age-specific mortality and reproduction. Parameters for the Leslie matrix model were derived from data of breed associations that use inventory-based recording systems. In addition, rather than considering a straightbred Angus system, the maternal objective was formulated based on a two-breed rotation of biologically similar dam lines. The corresponding genetic (co)variance matrix employed in the simulation is as follows:
Table 1 - Estimates of mean (μ), phenotypic standard deviation (σ), heritability (h2), economic weight (∂P/∂t), and accuracy for traits (t)
included in an Angus terminal sire breeding objective
Trait µ σ h2 ∂P/∂t Relative value, % Accuracy
EBVg EBVp
Birth weight, kg 35.4 5.00 0.41 –1.86 8.8 0.68 0.76 Weaning weight, kg 194. 39.5 0.23 0.90 25.4 0.56 0.66 Average daily gain, kg/d 1.32 0.18 0.36 104.29 16.9 0.66 0.60 Daily feed intake, kg/d 9.2 1.00 0.41 –22.05 21.1 0.74 0.56 Marbling score1 5.8 1.00 0.26 13.54 10.3 0.67 0.59
Yield grade 3.4 0.70 0.22 –35.28 17.4 0.65 0.57
EBVg - genomic estimated breeding values; EBVp - phenotypic estimated breeding values. 1 4.0 - slight00; 5.0 - small00; etc.
Table 2 - Estimates of mean (μ), phenotypic standard deviation (σ), heritability (h2), economic weights (∂P/∂t), and accuracies for traits (t)
included in a breeding objective for an Angus specialized dam line
Trait µ σ h2 ∂P/∂t Relative value, % Accuracy
EBVg EBVp
Stayability, % 55.1 16.2 0.21 8.00 50.6 0.58 0.37 Heifer pregnancy, % 91.0 22.6 0.14 1.61 11.6 0.45 0.31 Calving ease (d), % 85.5 28.6 0.12 1.90 16.0 0.62 0.65
Calving ease (m), % - 0.13 1.90 16.7 0.32 0.46
Weaning weight (d), kg 256.7 49.6 0.30 0.19 4.4 0.56 0.66 Weaning weight (m), kg - 0.14 –0.05 0.8 0.36 0.51
For each breeding objective, two scenarios were simulated: where the accuracies of both the phenotypic and genomic EBV were >0.0 (as presented in Tables 1 and 2); and where the accuracies of the genomic EBV were = 0.0 (i.e., no genomic information was available). When an appropriate estimate for Angus was not available, the necessary accuracy estimates were taken from Saatchi et al. (2012). Accuracy estimates for the phenotype-based EBV were extracted from a 2015 Angus national cattle evaluation for 2014 bulls that were not genotyped. Thus, the accuracies of the EBV were approximately those that would be available from choosing among yearling bull candidates for selection. The evaluation of these scenarios was otherwise parallel to the evaluation of the feed efficiency objective as described above.
Finally, the univariate form of the “Breeder’s equation”:
,
in which, R = response to selection; h = square root of heritability or accuracy; σa = genetic standard deviation;
and i = selection intensity, was used to assess selection response as a function of changes in accuracy due to the addition of genomic information to traditional phenotype-based predictions of genetic merit.
Results and Discussion
While much research into genetic improvement has been enamored with statistical and genomic technologies, the critical question of what exactly constitutes improvement also requires attention (MacNeil et al., 1997). An obvious, though far from trivial, question in defining objectives of genetic improvement is the identification of the economic values of traits affecting the breeding goal. Here, simulation models were developed to aid in addressing this question. Existence of industry-wide specifications for beef products, production systems, and, therefore, different enterprises do not necessarily suggest that there should be an industry-wide selection index. Resources available for production and level of production also vary among production systems and individual farms or ranches, resulting in different economic structures. As a result, relative economic values may differ among production systems and units and each may have a numerically different selection index. However, even across production and marketing systems as widely divergent as those existing between South Africa and the United States, the correlation between breeding objectives for Angus used as terminal sires was found to be positive and substantial (MacNeil, 2005a). Additionally, correlations among breeding objectives for terminal sires across breeds
and marketing systems in the United States ranged from 0.74 to 0.98 (MacNeil, 2005b).
The use of simulation to calculate an economic value is not without difficulty, particularly when the desired economic value is relevant to a state variable rather than a driving variable. For a driving variable, the use of a straightforward perturb-and-observe approach can be used to approximate the appropriate partial derivative and yield the desired economic value. This equation illustrates the approach:
,
in which ai is the economic value of trait i; P is profit;μi is the population mean for trait I; and ∆ is the unit increase in μi. However, for a state variable, whose value changes as one or more driving variables changes, the possibility of double counting is introduced. In the Angus maternal breeding objective, an economic value for stayability was desired. However, stayability is a state variable calculated as a consequence of age-specific reproduction and survival parameters that drive the Leslie-matrix component of the simulation. Driving variables, for which economic values were desired, were simultaneously required to have partial derivatives with respect to stayability equal to zero, thus avoiding the possibility of double counting, which would inflate their economic values.
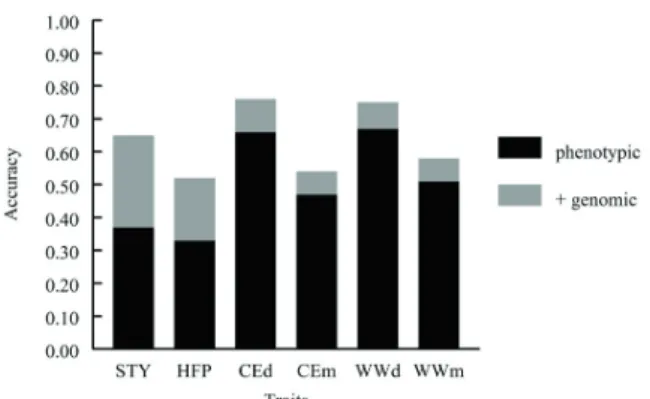
For individual traits in the terminal objective, selection response is increased through the use of genomic predictors by 9% to 41% with the least effect on birth weight and the greatest effect on dry matter intake (Figure 2). In general, these effects were greater on post-weaning traits that are less frequently recorded and (or) monitored with indicator traits. For individual traits in the maternal objective, selection response is increased through genomic predictors by 12% to 76% with by far the greatest effects on stayability and heifer pregnancy (Figure 3), traits that are unobserved on bull candidates for selection at the time when the selection decisions are typically reached. As identified by Johnston et al. (2012), in many circumstances, the accuracy of genomic prediction is low in beef, most likely due to the
relatively few animals with genotypes and phenotypes that have been used in developing genomic prediction equations. Furthermore, improving the accuracy of genomic predictions will require genotypes and phenotypes from many more animals with even greater numbers of observations needed for lowly heritable traits, such as female reproduction and other fitness traits (Johnston et al., 2012).
The use of breeding objectives also allows the consequences of incorporating genomic information to be translated into economic terms, assuming the classical pyramid paradigm for flows of genetic and economic signals in the beef industry (Figure 4). Conceptually, the industry is divided into two segments: one, a seedstock or stud breeding sector, wherein data recording and subsequent
Figure 2 - Effects of genomic information on accuracy of estimated breeding values for birth weight (BWT), weaning weight (WWT), post-weaning ADG, daily dry matter intake (DFI), marbling score (MRB), and USDA yield grade (YG).
Figure 3 - Effects of genomic information on accuracy of estimated breeding values for stayability (STY), heifer pregnancy (HFP), direct (CEd) and maternal (CEm) calving ease, and direct (WWd) and maternal (WWm) weaning weights.
Figure 1 - Accuracy of feed efficiency breeding objective as a function of scenarios defined by differences in accuracies of conventional and genomic EBV for average daily gain (trait 1) and daily food intake (trait 2).
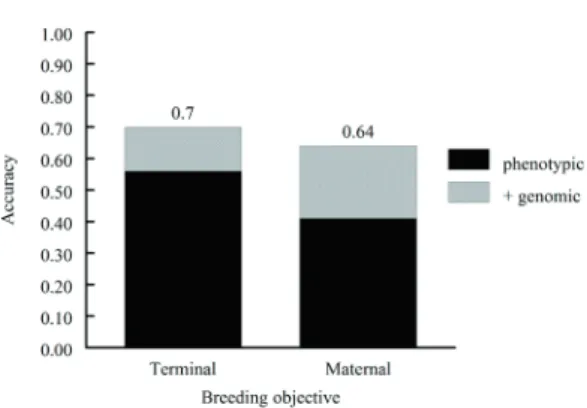
genetic evaluation facilitate genetic improvement that results in enhanced profitability for the commercial producers that form the second segment. These commercial producers benefit from the selection decisions that have been made by stud breeders and reward them for the enhanced genetic merit of the stock that they sell for use in commercial production. Here, assume that in the seedstock segment, 5% of bulls and 30% of heifers are retained for breeding and thus i = (2.06 and 1.16)/2 = 1.61. For the terminal (Table 1) and maternal (Table 2) objectives outlined above, σa ≈ 25 and 67, respectively. A degree of caution is warranted in interpreting these standard deviations, as the breeding objectives that they result from were based on different economic scenarios. These results indicate selection response for economic merit, as reflected in the breeding objectives, would be increased 1.25- and 1.56-fold by including genomic information in the EBV in the terminal and maternal objectives, respectively (Figure 5). The difference in selection response when adding genomic information to the prediction of EBV is $5.64 for the terminal index and $24.81 for the maternal objective. These values reflect the potential that may be attainable in the seedstock sector. When the genetically improved seedstock is used in the commercial sector, one-half of the increase in economic merit can be captured across the number of progeny produced. If an individual terminal sire were to produce 60 offspring, then the expected net increase in merit would total $169.09. For comparative purposes, the net increase in merit resulting from selection based on the maternal objective should be regressed to a present value that is one generation in arrears. Considering a generation interval of four years (for sires of daughters) and a real
interest rate of 4%, genomic prediction would, in total, add $159.09 for a sire producing 15 daughters that were retained as replacement females.
The results found here are sensitive to the accuracies of the genomic EBV, with less accurate genomic EBV resulting in diminished value of the genotyping. In addition, the results are contingent on the number of progeny that the commercial producer expects to produce for the purpose anticipated by the breeding objective. The assessment of the value resulting from bulls evaluated by the maternal objective is further clouded by any potential change in value of the sibs of the retained females. Fortunately, it appears that maternal and terminal breeding objectives may be positively correlated (Oschner, 2016) and thus, here, the value to a commercial producer using a maternal breeding objective would have been underestimated. It is also unknown the degree to which having genomically enhanced EBV as opposed to only phenotypic EBV affects the demand and, consequently, the prices paid for the bulls that a seedstock producer offers for sale (Miller, 2010).
The approach used here is consistent with the philosophy advocated by Thallman (2004), in which all information that adds to the accuracy of prediction is incorporated into a single EBV for each trait (Figure 6). True genetic values for each of n, possibly correlated traits, are the cause of differences in both genomic and phenotypic estimated breeding values EBVg and EBVp, respectively.
The separate EBV are then merged (blended) as a function of their respective accuracies to produce an EBV for each of the n traits. Finally, for each animal, the sum of products of economic weights and EBV is calculated to predict its economic value. An alternative approach in which
Figure 5 - Effect of adding genomic information to traditional phenotype-based estimated breeding values on the accuracy of breeding objectives for beef cattle selected specialized sire (terminal) and dam (maternal) lines.
Figure 6 - Conceptual model employed to incorporate of genomic information into multiple-trait economic breeding objectives.
the genomic and conventional EBV remained separate was examined by Togashi et al. (2011). They found it was important to combine the EBVp and EBVg into a genomically enhanced index to maximize genetic response to selection. Similar to the result found here, Togashi et al. (2011) found that the EBVg-assisted index was consistently more effective than EBVp-only index (scenario 1) and that the incorporation of genomic information was particularly valuable when the accuracy of the conventional EBV was low. It is noteworthy that these results are also consistent with those obtained when the contribution of genomic values to prediction of EBV for single traits has been evaluated (e.g., Spangler, 2011).
Conclusions
The perspective taken in this paper is that of a commercial beef producer buying bulls. Does that producer make a better (more profitable) decision if the bulls have been genotyped? Without doubt, genomically enhanced estimated breeding values are more accurate predictors of merit than traditional estimated breeding values. The value of this increase in accuracy can be assessed through consideration of the breeding objective of a commercial producer, with the results being unique to that particular objective. Genomic prediction is likely to be of greatest value to the commercial producer when the breeding objective includes traits that are not recorded on candidates for selection at the time when the choice among them is made, and thus their estimated breeding values for those traits have low accuracy. It is logical that if the commercial producer receives greater value as a result of the seedstock producer having genotyped the bulls that are offered for sale, then the commercial producer will also willingly pay more for those bulls and thus offset the cost of genotyping by the seedstock producer.
Acknowledgments
This work contributes to the following projects: “Development of breeding objectives, selection indexes and cost-benefit of economic selection, and genomic selection for Brazilian beef cattle”, which is supported by CNPq-CSF-PVE grant 303423/2014-5 from the National Council for Scientific and Technological Development of the Ministry of Science, Technology, and Innovation as a component of the Brazilian Science Without Borders Program; and “Identification and management of alleles impairing heifer fertility while optimizing genetic gain in Angus cattle”, which is supported by award no. 2013-68004-20364
from National Institute of Food and Agriculture to the University of Missouri.
The author gratefully acknowledges Jim Gibb (Neogen) for the original motivation for this work, substantive critiques by Matthew Spangler (University of Nebraska) and Scott Newman (Genus), and the assistance of Dan Moser (American Angus Association) in providing current estimates of most of the accuracies used in evaluation of the indexes.
References
de Roos, A. P.; Schrooten, C.; Veerkamp, R. F. and van Arendonk, J. A. 2011. Effects of genomic selection on genetic improvement, inbreeding, and merit of young versus proven bulls. Journal of Dairy Science 94:1559-1567.
Dickerson, G. E. 1970. Efficiency of animal production – molding the biological components. Journal of Animal Science 30:849-859. Dickerson, G. E. 1976. Inbreeding and heterosis in animals. p.54-77.
In: Proceedings of the Animal Breeding and Genetics Symposium in Honor of Dr. J. L. Lush. American Society of Animal Science and American Dairy Science Association, Champaign, IL. Dickerson, G. E. 1982. Effect of genetic changes in components of
growth on biological and economic efficiency of meat production. In: Proceedings of the 2nd World Congress Genetics Applied Livestock Production. Madrid, Spain. V:252-267.
Goddard, M. E. 1998. Consensus and debate in the definition of breeding objectives. Journal of Dairy Science 81(Suppl. 2):6-18. Hayes, B. J.; Bowman, P. J.; Chamberlain, A. J. and Goddard, M. E.
2009. Invited review: Genomic selection in dairy cattle: Progress and challenges. Journal of Dairy Science92:433-443.
Henderson, C. R. 1969. Index and Expected Genetic Advance. NAS-NRC Publ. National Academy of Science, Washington, DC, USA. Publication No. 982. p.141-162.
Johnston, D. J.; Tier, B. and Graser,H-U. 2012. Beef cattle breeding in Australia with genomics: opportunities and needs. Animal Production Science 52:100-106.
Kachman, S. D. 2013. Derivation of a blended BV. University of Nebraska, Lincoln. Available at: <https://beef.unl.edu/c/ document_library/get_file?uuid=ee09c533-a8ca-4d06-9b40-ddfd 39894840&groupId=4178167&.pdf >. Accessed on: Apr. 1, 2015. Leslie, P. H. 1945. The use of matrices in certain population
mathematics. Biometrika33:183-212.
Leslie, P. H. 1948. Some further notes on the use of matrices in population mathematics. Biometrika 35:213-245.
Lin, C. Y. 1980. Relative efficiency of selection methods for improvement of feed efficiency. Journal of Dairy Science 63:491-494.
MacNeil, M. D. 2005a. Breeding objectives for Angus cattle in South Africa and the United States. p.17-23. In: Proceedings of the 9th World Angus Forum Technology Meeting, Cape Town, South Africa.
MacNeil, M. D. 2005b. Breeding objectives for terminal sires for use in U.S. beef production systems. p.82-87. In: Proceedings of the Beef Improvement Federation 37th Annual Research Symposium and Annual Meeting. Billings, Montana, USA.
MacNeil, M. D.; Nugent, R. A. and Snelling, W. M. 1997. Breeding for profit: an introduction to selection index concepts. In: Proceedings of the Range Beef Cow Symposium XV. Rapid City, South Dakota, USA.
MacNeil, M. D. and Herring, W. O. 2005. Economic evaluation of genetic differences among Angus bulls. Proceedings of the Western Section of the American Society of Animal Science 56:87-90.
Miller, S. 2010. Genetic improvement of beef cattle through opportunities in genomics. Revista Brasileira de Zootecnia 39(Supl.):247-255.
Oschner, K. P. 2016. Development of terminal and maternal economic selection indices in Beefmaster cattle. M.S. Thesis. University of Nebraska, Lincoln.
Saatchi, M.; Schnabel, R. D.; Rolf, M. M.; Taylor, J. F. and Garrick, D. J. 2012. Accuracy of direct genomic breeding values for nationally evaluated traits in US Limousin and Simmental beef cattle. Genetics Selection Evolution 44:38.
Spangler, M. 2011. Integrating molecular data into NCE: expectations, benefits, and needs. In: p.117-122. Proceedings of the Beef Improvement Federation 43th Annual Research Symposium and Annual Meeting. Bozeman, Montana, USA.
Thallman, R. M. 2004. DNA testing and marker assisted selection. p.20-25. In: Proceedings of the Beef Improvement Federation 36th Annual Research Symposium and Annual Meeting. Sioux Falls, South Dakota, USA.