Abstract— An Analog to Digital converter (ADC) is crucial component in video, radar, communications, high-speed data acquisition and measurement systems. ADC decides the overall accuracy of such systems. Many times the input to ADC in an application is different than standard signals such as sine wave or triangular wave. As ADC parameters are dependent on input frequency and other test conditions so parameters determined using standard signals are not useful. Therefore dynamic testing of ADC under application conditions is needed. This paper discuses methodology to test ADC using application input. Different sinusoidal signals present in the application input are determined by first digitizing using accurate ADC and then computing Interpolated Fast Fourier Transform (IFFT). Determination of Differential Nonlinearity (DNL) of ADC for application input using deviation of experimental count from reference count and estimation of Integral Nonlinearity (INL) from summation of DNL are presented. Code transition levels of ADC transfer characteristics are computed and Effective Number of Bits (ENOB) of 5 bit simulated ADC is determined based upon INL computation. It is expected that this work will initiate research towards ADC testing using application input.
Index Terms— Differential Nonlinearity, Histogram, Effective
Number of Bits, Transfer Characteristics, Code Transition Levels.
I. INTRODUCTION
Usually manufacturer of a device provides specifications of the device in its data sheet but these specifications were determined by device manufacturer over conditions other than the application conditions of a user. If the aim is to select a better device for an application, then data sheet specifications are sufficient for comparison. But, if a selected device is to be used in a design then determination of its functional parameters over application conditions is a must. Hence, objective of our work for dynamic testing of an ADC is to develop better
Manuscript received on June 30th, 2007. This work has been carried out in
SMDP-VLSI project laboratory funded by the Ministry of Information and Communication Technology, Government of India.
*D.K. Mishra and R.S. Gamad are with Shri G.S. Institute of Technology and Science, Indore, M.P., 452003, India Phone: +91-731-2434095, Fax: +91-731-2432540 email: * [email protected], [email protected]
methods, using application inputs to an ADC, for manufacturer’s point of view as well as user’s point of view. In real life testing of a flash ADC, a family board containing device and associated circuits such input buffer, ADC clock generator, and output data latches are used along with function generator and power supplies for proper operation of the ADC. Due to high cost of ADCs and its test instruments like programmable function generator, power supply and instrument controller, development of dynamic test methods are carried out by simulating ADC transfer characteristics, and ADC input (such as sine wave, triangular wave and application inputs) through software. Test methods developed by simulation are equally suitable for testing a real life ADC in application conditions with little changes related with hardware and software matching.
Most of the time, the input to the ADC is different than standard sine wave, triangular wave or a dc. Methods used for testing an ADC using these signals are not applicable for testing ADC using other arbitrary signals. Standard histogram technique is based upon determination of DNL by probability estimation and also code transition levels are determined by computing cumulative histogram based upon phase estimation [1],[2],[14]-[16]. As far as application multi-frequency signal is concerned, it is not possible to derive a formula for DNL based upon probability estimation and also code transition levels based upon phase estimation. Further, sine wave curve fitting technique for determination of ENOB of an ADC is already very complex and extension of same approach is extremely difficult, if not impossible. In case of Fast Fourier Transform (FFT) testing of an ADC, when a mono frequency sine wave is digitized by test ADC at a sampling frequency, line spectra of sine wave is reproduced centered at frequencies separated by sampling frequency [1]-[4]. Though, this approach to spectrum analysis is computationally efficient but it has two major drawbacks due to windowing by finite time domain window (a) The frequency resolution is inversely proportional to the measurement time interval, (b) Due to leakage effects, energy of the main lobe leaks into “side lobes”. Later problem can be minimized to some extent by proper selection of time window with non-uniform weighting [5]. This however, decreases the resolution of the spectral estimates and causes the loss of phase information. With multiple frequency application signal, this reproduction of base band
Determination of Nonlinearity and Effective
Resolution of an A/D Converter for Arbitrary
Application Input
D.K Mishra and R.S. Gamad
Proceedings of the World Congress on Engineering and Computer Science 2007 WCECS 2007, October 24-26, 2007, San Francisco, USA
spectrum at regular interval at sampling rate, makes it very difficult to accurately determine frequencies, amplitudes, and phases of different components of input [6].
Hence for testing an ADC for an arbitrary input either totally different approach or suitable modifications are needed in test methods which are already in use. Different sinusoidal component of input are computed by applying IFFT algorithm. This algorithm requires simple calculation beyond DFT of the signal [7],[10],11]. This IFFT algorithm provides accurate determination of amplitudes, frequencies and phases of different components of application input.
II. DNL AND INL DETERMINATION
DNL determination for application input is done by taking deviation of experimental count and corresponding reference count and INL is computed by taking summation of DNL for all preceding codes [8]:
1
)
(
)
(
)
(
=
−
i
H
i
H
i
DNL
REFEXP
(1)
∑
==
i
j
j
DNL
i
INL
1
)
(
)
(
(2)Where HEXP(i) = Experimental count of code i, and HREF(i) = Reference count of code i
Experimental count is computed for each code bin by frequency of occurrence of each code, when actual application input is digitized by test ADC. While reference count is determined by frequency of occurrence of each code, when simulated application input is digitized by ideal simulated ADC through software. Simulated application input is computed by IFFT method [9].
III. ACTUAL TRANSFER CHARACTERISTICS & ENOB
DETERMINATION
Actual transfer characteristics of the test ADC is determined by first computing code transition levels from INL and other parameters [3],[12]:
G
i
INL
Q
V
T
Q
i
i
T
(
1
).
(
1
)
OS.
(
)
)
(
=
−
+
−
−
(3)Where Q = Average code bin Width, T(i) = ith Transition Level. Vos = The offset Voltage nominally zero, G = Gain nominally 1.
The ENOB may be considered as number of bits of a perfect
ADC, whose rms quantization error would be equal to total rms error from all ADC under test. The ENOB can be expressed as [2],[13]:
⎥
⎦
⎤
⎢
⎣
⎡
−
=
)
(
)
(
2
ideal
rmserror
actual
rmserror
Log
N
ENOB
(4)Where N is the ideal resolution of the ADC.
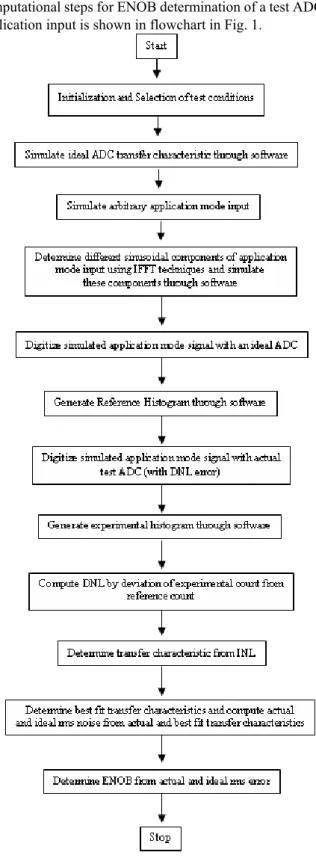
Best Fit transfer characteristics are determined by least square error minimization method. ENOB of the test ADC for application input is computed by deviation of actual transfer characteristics from best fit transfer characteristics. Different computational steps for ENOB determination of a test ADC for application input is shown in flowchart in Fig. 1.
Fig. 1 ENOB determination by deviation of experimental histogram from reference histogram and least square minimization techniques.
Proceedings of the World Congress on Engineering and Computer Science 2007 WCECS 2007, October 24-26, 2007, San Francisco, USA
IV. RESULTS AND DISCUSSION
Computation of DNL error is carried out for 5 bit ADC by simulating arbitrary DNL error and then computing deviation of experimental count from reference count. Similarly INL for each code is computed by summation of DNL for previous codes. Code transitions levels are determined from INL and other errors in the ADC. ENOB is computed based on actual rms error and ideal rms error in the ADC for application input.
A. DNL error using full scale sine wave as input
Ideal transfer characteristics of 5 bit ADC is simulated through software and arbitrary DNL error is introduced in ADC transfer characteristics. A perfect sine wave with 0.95 MHz frequency simulated through software is applied to the input of simulated ADC. Sampling frequency is taken equal to 5 MHz. Experimental and reference count are computed through software. Figure 2 shows comparison of DNL error for 5 bit ADC using present method with standard histogram method reported in the literature.
Fig. 2 DNL comparison using Present Method [a] and Standard Histogram Method [b] using sine wave.
B. ENOB using full scale sine wave as input
5 bit ideal ADC is simulated and arbitrary INL error is introduced and a full scale sine wave of 0.95 MHz frequency with peak amplitude (2N-1+0.5) LSB) (which is sufficient to slightly overdrive the ADC) is sampled by ADC at 5 MHz frequency. Table 1 compares ENOB computed by present method with standard histogram method reported in the literature [5].
Table 1 : Comparison of ENOB by Present method and Histogram method using Sine Wave as input
Number of samples ENOB by present method
ENOB by Histogram method
512 4.378599 4.393888
1024 4.413217 4.341025
2048 4.409588 4.361735
4096 4.412828 4.359600
8192 4.424342 4.332037
16384 4.425141 4.341084
30000 4.424726 4.340817
C. DNL and INL using application input
Application input is simulated by taking sum of two sinusoidal components with frequency, amplitude, and phase as 0.095 MHz, 5.12 Volts and zero phase for one component and 1.9 MHz, 2.56 Volts, and zero phase for second component. This input is digitized by a 5 bit simulated ADC with arbitrary DNL error introduced in transfer characteristics of ADC. Figure 3 shows DNL determined by present method.
Fig. 3 DNL of 5 bit ADC using Application input.
Figure 4 shows INL which is determined by summation of DNL for preceding codes.
Fig.4 INL of 5 bit ADC using Application input
Proceedings of the World Congress on Engineering and Computer Science 2007 WCECS 2007, October 24-26, 2007, San Francisco, USA
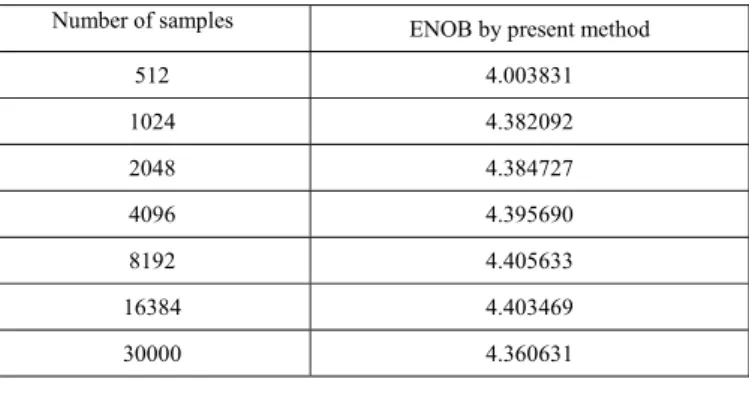
D. ENOB using application input
All test conditions are kept same as that of DNL error computation. Application input is applied to simulated ADC with arbitrary DNL error introduced in its transfer characteristics. First, DNL and INL computation are carried out and based upon this results code transition levels and actual transfer characteristics of 5 bit ADC for application input are determined. Table 2 shows ENOB which is computed for 5 bit simulated ADC.
Table 2:ENOB by present method for 5 bit ADC using application input
Number of samples ENOB by present method
512 4.003831
1024 4.382092
2048 4.384727
4096 4.395690
8192 4.405633
16384 4.403469
30000 4.360631
V. CONCLUSION
When input to an ADC is different than sine wave and triangular wave e.g., radar or communication signal, a different approach for testing ADC in application mode is necessary. Experimental count is determined by digitizing actual application input by actual ADC. Comparison of present methods of DNL and INL determination and ENOB determination with corresponding standard histogram methods are also done for sine wave as input. Application input is simulated by taking two sinusoidal signals and then DNL, INL and ENOB determination is carried out. Only one method which is proposed in this paper is possible for application input testing of an ADC. The overall research work carried out has given a significant contribution for ADC design and testing with arbitrary application inputs. The techniques discussed in the paper are very much useful in testing high speed ADCs by manufacturer as well as circuit designer.
REFERENCES
[1] B.E. Peetz, "Dynamic Testing of Waveform Recorders", IEEE Transactions on Instrumentation and Measurement, Vol. IM-32, No. 1, pp. 12-17, March 1983.
[2] M.F. Wagdy and S. S. Awad, "Determining ADC Effective Number of Bits via Histogram Testing", IEEE Transactions on Instrumentation and Measurement, Vol. 40, No.4, pp. 770-772, Aug. 1991
[3] J. Blair, "Histogram Measurement of ADC Non-Linearity using Sine Waves", IEEE Transactions on Instrumentation and Measurement, Vol. 43, No. 3, pp. 373-383, June 1994
[4] V.K. Jain, W.L. Collins, and D.C. Davis, “High Accuracy Analog Measurements via Interpolated FFT”. IEEE Transactions on Instrumentation and Measurement, Vol. IM 28, pp.113-122, 1979.
[5] J.J. Blair, “A Method for Characterizing Waveform Recorder Errors using the Power Spectral Distribution”, IEEE Transactions on Instrumentation and Measurement, Vol.41, No.5, pp. 604-610, Oct. 1992.
[6] A Oppenheim and R. Schafer, “Digital Signal Processing”, Englewood Cliffs, N.J., Prentice- Hall, 1975.
[7] J. Schoukens, R. Pintelon, and H.V. Hamme, “The Interpolated Fast Fourier Transform : A Comparative Study”, IEEE Transactions on Instrumentation and Measurement, Vol. 41, No.2, pp. 226-232, April 1992.
[8] F. Azais, S. Bernard, Y. Bertrand, M. Renovell Towards an ADC BIST scheme using the histogram test technique, European Test Workshop, 2000. Proceedings. IEEE 23-26 May 2000 Page(s):53 - 58.
[9] D.K. Mishra, “ADC Testing using Interpolated Fast Fourier Transform (IFFT) Technique”, Published in International Journal of Electronics, Taylor & Francis Publications, Vol. 90, No. 7, pp 459-469, July 2003. [10] T. Grandke, “Interpolation Algorithms for Discrete Fourier Transforms
of Weighted Signals”, IEEE Transactions on Instrumentation and Measurement, Vol. IM-32, pp. 350-355, June 1983
[11] C. Offelli and D. Petri, “Interpolation Techniques for Real-Time Multi-Frequency Waveform Analysis”, IEEE Transactions on Instrumentation and Measurement, Vol. 39, pp. 106-111, 1990.
[12] “Dynamic Performance Testing of A to D Converters”, Hewlett Packard Product Note 5180 A-2.
[13] D.K. Mishra, “Some Methods for Dynamic Testing of A/D Converters”, Ph.D. Thesis, May 2000.
[14] D. K. Mishra, N. S. Chaudhari, and M. C. Shrivastava, “New Dynamic Test Methods for Determination of Nonlinearity and Effective Resolution of A/D Converters”, The Research Journal of the Institution of Electronics and Tele communication Engineers (India), IETE, Vol.43, No.6, pp.403-409, Nov-Dec, 1997.
[15] D. K. Mishra, N. S. Chaudhari, and M. C. Shrivastava, “Dynamic Testing of an ADC by Least Square Error Minimization in Histogram Technique”,
The Journal of Institution of Engineers (India), Electrical Engineering
Division, Vol. 78, pp. 31-35, May 1997.
[16] D. K. Mishra, N. S. Chaudhari, and M. C. Shrivastava, “ADC’s Effective Number of Bits Determination by Combination of Histogram and Least Square Error Minimization Techniques”, The Research Journal of the Institution of Electronics and Tele communication Engineers (India), IETE, Vol.43, No.4, pp. 327-332, July-August, 1997.
Proceedings of the World Congress on Engineering and Computer Science 2007 WCECS 2007, October 24-26, 2007, San Francisco, USA
![Fig. 2 DNL comparison using Present Method [a] and Standard Histogram Method [b] using sine wave](https://thumb-eu.123doks.com/thumbv2/123dok_br/18174783.330361/3.892.479.803.165.367/comparison-using-present-method-standard-histogram-method-using.webp)