Heated Rotating Cavity System
ABDUL FATAH ABBASI*, JAWAID DAUDPOTO*, AND MUHAMMAD SALEH JUMANI**
RECEIVED ON 17.05.2013 ACCEPTED ON 11.09.2013
ABSTRACT
This paper presents the finite difference solutions for buoyancy-induced flow in the asymmetrical heated rotating cavity system for the range of rotational Reynolds numbers Reθθθθθ=====6.13x10⁵<Re
θ θθ θθ=====4.4x10
6 and
the mass flow rates C
w<28000<Cw < 3000. All the simulations have been carried out through the CFD
(Computational Fluid Dynamics) commercial code, ANSYS Fluent 12.0, by adopting axisymmetric, Steady-state and elliptic technique. Two well know models namely k-εεεεε and the Reynolds stress models have been employed. The simulated results illustrate the important aspects of the heated rotating cavity flow system. The noteworthy influence of buoyancy-induced flow have been observed on the predicted stream lines, static temperature contours and the local Nusselt numbers for the rotating cavity space. A comparison of the predicted local Nusselt numbers for the hot and cold discs showed a good level of agreement with the measurements.
Key Words: Rotating Cavity System, Low Reynolds Number Second Moment Closure, Buoyancy-Induced Flow.
* Assistant Professor, Department of Mechanical Engineering, Mehran University of Engineering & Technology, Jamshoro.
* * Assistant Professor, Department of Industrial Engineering & Management, Mehran University of Engineering & Technology, Jamshoro.
1.
INTRODUCTION
help the researchers to devise an effective air cooling system for the future generation engines. In the heated rotating cavity system, the flow structure is distorted due to the buoyancy-induced effects. Result of that heat is transferred from the hot disc to cold disc through the transport of fluid. Previous research work provided the experimental and computational research papers for the rotating disc flow system. The flow visualization experiments of Owen and Onur [2] showed the parametric effects on the nature of flow, which was oscillating and chaotic in the nature. Memon [3] also illustrated the same behaviour of the rotationally-induced buoyancy parameter on heat transfer calculations by considering the rotational Grashof number. Mirzaee, et. al. [4]
Predictions of Buoyancy-induced Flow in Asymmetrical Heated Rotating Cavity System
presented numerical and experimental studies regarding the rotating cavity flows for the rotational Reynolds number Reθ= 1.5x10⁶ and C
w= 3000. Their work illustrated
the uniform tangential velocity profiles in the centre of cavity and corroborated the significant effects of vortices (free and forced) in this region. Kilic [5] investigated the significant effects of various parameters (G, Reθ and Cw) on the predicted flow structures and heat transfer calculations in the rotating cavity system with peripheral air flow conditions. Karabay, et. al. [6] reported theoretical and computational studies of the flow and heat transfer in pre-swirl rotating disc system by considering the turbulent flow parameters such as, pre-swirl ratio, mass flow rate (Cw) and rotational Reynolds number (Reθ). These parameters also are considered in the work of Lock, et. al. [7] for the heat transfer measurements. Later on Owen, et. al. [8,9] investigated experimentally the effects of buoyancy-induced parameter on the heat transfer calculations in the rotating cavity system. They pointed out the three multi-cell structures of cyclonic and anti-cyclonic vortices. Recently, Vinod Kumar, et. al. [10] presented numerical study of rotating cavities with radial inflow by using two popular eddy viscosity models (the Spalart-Allmaras and the k-ε) and a Reynolds stress model. They have mentioned the some shortcomings of former model and improved results of later model. Similarly, in the present study main focus has been given to both models, the k-ε and the Reynolds stress model. Both the models are employed to investigate the buoyancy-induced flow parameter and its effects on the heat transfer calculations. Therefore, the range of rotational Reynolds numbers, Reθ=6.13x10⁵<Re
θ=4.4x10
6
and the mass flow rates, Cw<28000<Cw<3000 are considered for the predictions of heat and fluid flow in the heated rotating cavity system. All the predictions have been carried out by implementing the CFD commercial code, ANSYS Fluent by activating two low Reynolds number turbulence models, the k-ε model and the Reynolds stress model, so-called the low Reynolds number second moment closure. The simulations have been compared with the measurement of Mark-II rig
TFMRC (Thermo Fluid Mexchanics Research Centre), University of Sussex (Memon, [3]).
2.
PROBLEM SPECIFICATION AND
NUMERICAL METHOD
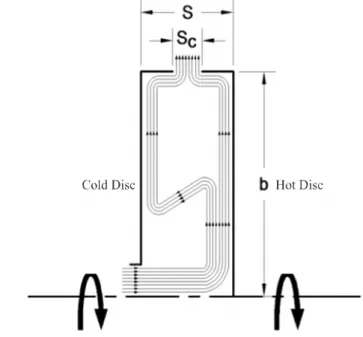
The geometry of the simulation domain is identical to the experimental rig of Mark-II Memon [3], as presented in Fig. 1. The dimensions of the geometry and applied boundary conditions are given as under:
b=427.5mm, ri =44.5mm, s=56.0mm and G= 0.138
U=V=W=0 at z=0, ri<r<b, V=W=0, U=Ui at z=0, 0<r< ri
U=V=0, W=Ωr at z=s, 0<r<b, U=W=0, V=Vo at r=b, 0<z<Sc
where b, ri, s and G are the cavity outer radius, inlet radius, axial spacing and gap ratio respectively.
The boundary conditions at the inlet and outlet show that the cooling air enters the rotating cavity axially passing through a central hole in the upstream disc and impinges directly on the downstream disc (hot disc) and developed a wall jet along the disc in radial direction. The temperature distribution on the hot disc is assumed to be non-uniform and increasing radially and reaches the maximum value of
Predictions of Buoyancy-induced Flow in Asymmetrical Heated Rotating Cavity System
100oC near the outer edge of the disc, whereas temperature
of the cold disc is similar to inlet air temperature of 20oC.
Non-uniform and coarser meshing 75x92 in axial and radial direction respectively has been implemented for the simulations. For fine distributions of the grid nodes near the wall region, a distance of y+<0.5 has been used, as
shown in Fig. 2.
The HYBRID and HOUS (High Order Upwind Scheme), discretisation schemes have been adopted in combined form for the evaluation of the mean and fluctuating components at the control volume faces. To couple the pressure and velocity flow field and to satisfy the mass continuity within the system, a SIMPLEC (Semi-implicit Method for Pressure-Linked Equation of Consistency) algorithm of Van Doormal and Raithby [11] has been implemented.
3.
TURBULENCE MODELS
Two turbulence models, the low Reynolds number k-ε
model and the low Reynolds number second moment closure along with the energy equation have been employed. These models are built-in by default in the
ANSYS Fluent CFD commercial code. Both the turbulence models are categorised according to the modelling of the Reynolds stress components, which are appeared in the time-averaging process of a Navier Stokes equations. The details of governing equations are given as:
3.1
Low Reynolds Number k-
εεεεε
Model
A well known low Reynolds number k-ε model which is based on the suggestions of Morse [12] has been used for the predictions. This model solves the turbulence quantities through the gradient transport hypothesis procedure, which is based on the transport equation for the kinetic energy (k) and its dissipation rate (ε):
⎟ ⎟ ⎠ ⎞ ⎜ ⎜ ⎝ ⎛ ∇ − + −
= ij V
i x j U j x i U T k ij j u i
u 2 3 2 3δ .
∂ ∂ ∂ ∂ μ ρ δ ρ (1)
where ∇.V is the divergence of the velocity vector:
r V r V z U
V = + +
∇ δ δ δ δ . (2)
2/3δij Normal stresses (i.e. i=j only)
3.2
Low Reynolds Number Second
Moment Closure
The low Reynolds number second moment closure, which is based on the suggestions of Lai and So [13] has been adopted for the predictions. In this modelling procedure, an isotropic eddy viscosity approach is not invoked and the transport equations are resolved for each Reynolds stress component so-called Reynolds stress closure. The exact governing equation for the Reynolds stress components are expressed in Cartesian tensor as under:
(
)
(
)
k X j u k X i u i X p u u j X p i u k X j U k u i u k X i U k u i u k u j u i u k X k X j u i u k X j u i u k U k X δ δ δ δ μ δ δ δ δ δ δ δ δ ρ ρ δ δ δ δ δ δ ρ δ δ 2 − + − + − − + = ⎟ ⎟ ⎠ ⎞ ⎜ ⎜ ⎝ ⎛ ⎟⎟ ⎠ ⎞ ⎜⎜ ⎝ ⎛ ⎟ ⎟ ⎠ ⎞ ⎜ ⎜ ⎝ ⎛ (3)( ) (
⎣
Predictions of Buoyancy-induced Flow in Asymmetrical Heated Rotating Cavity System
or symbolically as:
Cij = Dv ij + D
T
ij + Pij + Πij - εij (4)
where from left to the right can be read as convection, viscous diffusion, turbulent diffusion, production by mean strain, redistribution and diffusion due to the pressure interactions, and viscous dissipation of the Reynolds stresses respectively.
Modelling of the turbulent diffusion, pressure-strain interactions and viscous dissipation terms individually formed the exact equation for the low Reynolds number second moment closure, which represents the all the correlations in detail given as under:
[
] [
]
(
) (
) (
)
( )
(
)
Dkk j u k u k j n k n u k u n k n u k u j n i n i n k n k u j u j n k n k u i u j u k u k w f w f ij i n k n k u j u j n k n k u i u k k P ij ij P k ij j u i u k c w f k P ij ij P c k ij j u i u k c k X i U k u i u k X i U k u j u k X j u i u u k u k s c k X k X j u i u k X ij C − + + + + − − − + − − + − + − − − − + − + ⎥⎦ ⎤ ⎢⎣ ⎡ ⎥ ⎦ ⎤ ⎢ ⎣ ⎡ ⎥ ⎥ ⎦ ⎤ ⎢ ⎢ ⎣ ⎡ ⎥ ⎥ ⎦ ⎤ ⎢ ⎢ ⎣ ⎡ 2 / 1 3 1 1 1 1 3 / 2 3 / 2 3 / 2 1 3 / 2 2 3 / 2 1 1 ε ρ ρε δ ε ρ δ α δ ε ρ δ δ ε ρ δ δ δ δ ρ δ δ ε ρ δ δ δ δ μ δ δ
For full detail see references, Abbasi, et. al. [14], Memon [3,15] and Lai and So [13].
3.3
Energy Equation
The generalized form of Reynolds-averaged energy equation for steady turbulent flow can be written in Cartesian tensor notation as:
( )
=⎢⎣
⎡
− φ⎥⎦
⎤
δ δφ μ δ δ φ δ δ uj xj xj Ujxj Pr (5)
The cylindrical polar-coordinate form of the governing equations presented for the general variable (ε):
( )
( )
μδφδ φδ δφ μ δ δ φ δ δ φ δ δ s r r x x rV r r U
x + = + ⎟⎠+
⎞ ⎜ ⎝ ⎛ ⎟ ⎠ ⎞ ⎜ ⎝ ⎛ Pr Pr 1 (6)
Where the turbulent heat flux tensor emerged in Equation (5) is represented by the source term (ε).
4.
DISCUSSION OF NUMERICAL
RESULTS
The simulated results are presented for a rotating disc flows system for different values of rotational Reynolds numbers Reθ=6.13x10⁵ < Re
θ < 4.4x10
6 and mass flow rates,
Cw < 28000 < Cw < 30000.
4.1
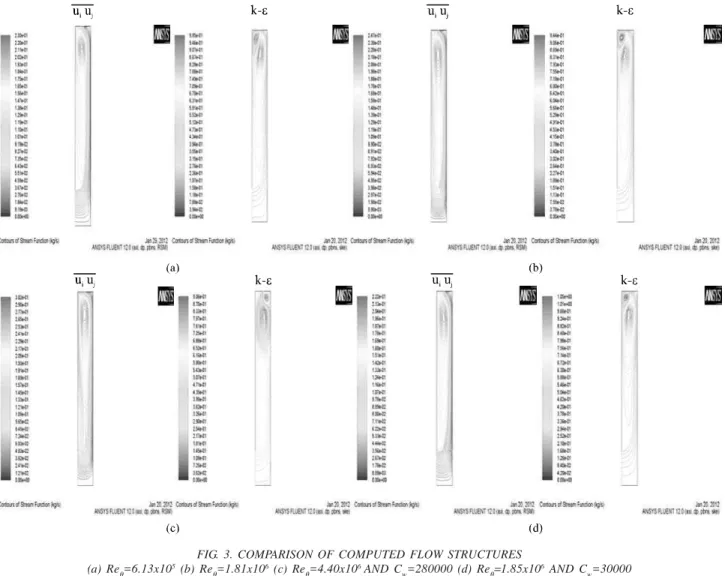
Computed Flow Structure
Fig. 3(a-d) shows the predicted stream lines for the range of rotational Reynolds number Reθ=6.13x10⁵ < Re
θ < 4.4x10
6
and the mass flow rates, Cw < 28000 < Cw<30000. For the Reθ=6.13x10⁵ and mass flow rate, C
w=28000, the incoming
air directly strikes on the hot disc and developed a wall-jet along the disc, finally formed the Ekman layer in the outer part of the disc space. Remaining part of the air recirculated in inward direction to the cold disc and formed the recirculating cell of the air, which occupied the entire cavity. A comparison of both models illustrated that the k-ε model predicted the extra recirculating cell of the air in outer edge of the cavity. While the Reynolds stress model predicted a large cell and shows more influence in the source region. At 66% higher Reynolds number, Reθ=1.81x10⁶ and the same mass flow rate, the computed
stream lines do not show the major change in the flow behaviour apart from the source region, which is elongated to outer region of the cavity due to buoyancy-induced effects as shown in Fig. 3(b). For 86% higher rotational Reynolds number Reθ=4.40x10⁶, the buoyancy-induced
effects are more prominent and extended the flow structure in out ward direction. The assessment of the stream lines show that the low Reynolds number second moment closure predicted the larger recirculating cell of fluid than that of the k-ε model, however, k-ε model predicted three recirculating cells of the fluid as shown in Fig. 3(c). For 7% higher mass flow rate, Cw=30000 and Reθ=1.85x10⁶, both
4.2
Computed Static Temperature
Contours
Fig. 4(a-d) presents the simulated temperature contours of two turbulent models for the range of rotational Reynolds number and mass flow rate, Reθ=6.13x10 < Reθ < 4.4x10⁶ and C
w=28000 < Cw=30000. At rotational Reynolds
number, Reθ=6.13x10⁵ and the mass flow rate, C
w=28000.
The predicted static temperature contours illustrated that due to direct impingement of the cooling air on the hot disc (downstream) formed a strong wall jet, which moves rapidly along the same disc. Due to swift movement of the fluid heat is not transferred to air properly at initial stage of the cavity. However, at higher radial location the air is recirculated from the hot disc to cold disc therefore, more
heat has been transferred from the hot disc to cold disc up to outer edge of the cavity. Consequently, the temperature of the cooling air increased to maximum level at the outer edge of the cavity, as shown in Fig 4(a). For a 66% higher rotational speed, Reθ=1.81x10⁶, the major variation in the
temperature distribution can be seen from the temperature
contours of the hot disc and cold disc. This change in temperature distribution attributes the effects of higher buoyancy induced parameter which is increased at higher speed rotational, as shown in Fig. 4(b). For a 86% rotational speed, the cell of recirculating air is distorted in the outer part of the cavity therefore, the temperature distribution in this region is enhanced as compare to previous case, as shown in Fig. 4(c).
FIG. 3. COMPARISON OF COMPUTED FLOW STRUCTURES (a) Reθ=6.13x10⁵ (b) Re
θ=1.81x10
6 (c) Re
θ=4.40x10
6 AND C
w=280000 (d) Reθ=1.85x10
Predictions of Buoyancy-induced Flow in Asymmetrical Heated Rotating Cavity System
For a 7% high mass flow rate, Cw=30000 at Reθ=1.85x10⁶,
the buoyancy-induced parameter is less influential than
the previous case. For this higher mass flow rate, a well
developed strong wall jet has been formed along the
hot disc. Therefore, recirculating cell of the fluid
contracted in size and effect on the temperature
distribution from the hot disc to cold disc, as shown in
Fig 4(d). Overall comparison shows that for higher
rotational speed the Reynolds stress model computed
a stronger temperature distribution than the k-ε model
(Fig 4(b)), which attributed that the former model is
more capable than the later model to capture the higher
operating conditions appropriately.
4.3
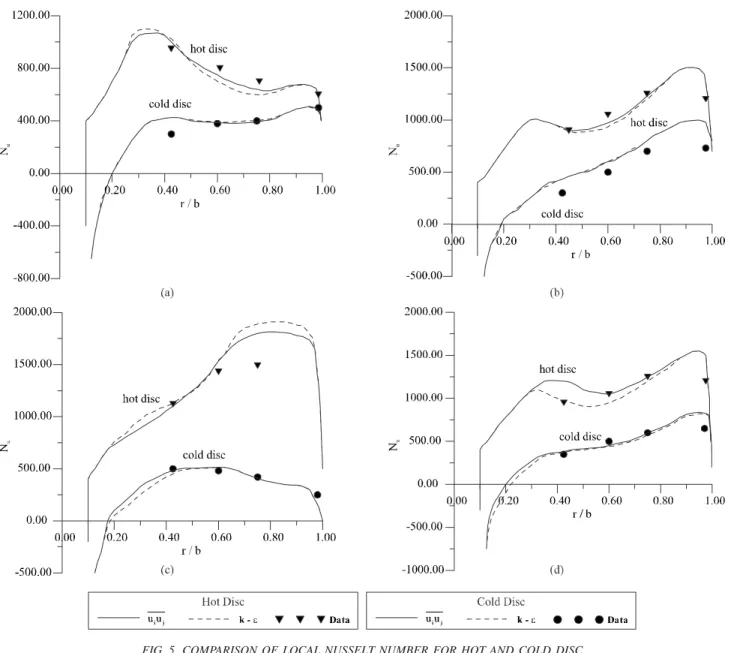
Computed Local Nusselt Number
Fig. 5(a-d) presents the comparison of computed local
Nusselt numbers (Nu) for the hot and cold discs for a
range of rotational Reynolds number 6.13x10⁵< Re
θ <
4.4x10⁶ and the mass flow rates, 28000< C
w=30000 . The
computed Nusselt numbers have been validated through
the experimental measurements of the Mark-II rotating
cavity rig at TFMRC (Memon [3]). The local Nusselt
number can be expressed as:
(
I)
I Ts T
k s rq Nu
−
= (7)
FIG. 4. COMPARISON OF COMPUTED STATIC TEMPERATURE (a) Reθ=6.13x10⁵ (b) Re
θ=1.81x10
6 (c) Re
θ=4.40x10
6 AND C
w=280000 (d) Reθ=1.85x10
Where qs and Ts are the heat fluxes and disc temperature at the disc surface respectively, and KI and TI and are the thermal conductivity and temperature of the inlet air.
The negative Nusselt numbers have been computed on the hot and cold disc at lower radial location for the rotational Reynolds number Reθ=6.13x10⁵ and mass flow
rate, Cw=28000, as shown in Fig. 5(a). This trend reveals the lower temperature gradient between the incoming air and the first measurement position (r/b=0.323) on the
upstream disc which varies from 296-302K. The temperature of the recirculating cooling air is higher than the cold disc; therefore, heat has been transferred from the recirculating air to the cold disc. Therefore, the negative Nusselt numbers have been computed at lower radial location of the cold disc. On other hand the predicted negative Nusselt numbers on the hot disc reveals that the incoming cooling air is not impinged on the downstream disc appropriately, while the temperature of the hot disc at lower radius is very low. For 66% higher rotational speed of Reθ=1.81x10⁶ at the same flow rate,
FIG. 5. COMPARISON OF LOCAL NUSSELT NUMBER FOR HOT AND COLD DISC (a) Reθ=6.13x10⁵ (b) Re
θ=1.81x10
6 (c) Re
θ=4.40x10
6 AT C
w=280000 AND (d) Reθ=1.85x10
Predictions of Buoyancy-induced Flow in Asymmetrical Heated Rotating Cavity System
the incoming cooling air has been recirculated from the hot disc to cold disc and developed Ekman layers on the discs. The recirculation of the cooling air produced the weaker eddies in earlier stage of the source region and travelled from hot disc to cold one; consequently the heat has been transferred from hot to cold disc. Continuous enhancement in the Ekman layers increases the level local Nusselt numbers on both the discs, particularly on the hot disc. However, it is slightly decreased in the centre of the hot disc (downstream disc), as shown in Fig. 5(b).
The comparison shows the same variation in the local
Nusselt numbers for both the discs. However, Reynolds
stress model shows slightly better performance than
the k-ε model in the centre of hot disc. For a 86% higher
rotational speed, Reθ=4.4x10⁶ a strong buoyancy effect
has been observed which formed a large recirculation
core of fluid and effected the entire flow structure and
developed the non-entraining Ekman layers on both
the discs. Therefore, the level of the local Nusselt
numbers have been increased on both the discs, as
shown in Fig. 5(c). This significant change in the local
Nusselt numbers reveals the effects of
buoyancy-induced parameter, which is increased on higher
rotational speed and decreased on higher mass flow
rate. Similar studies were made by Memon [3] and Owen,
et. al. [8].
In contrast, for the highest flow rate, Cw=30000 the
buoyancy-induced flow parameter is less influential than
the lower mass flow rate (Cw=28000). Result of that the
level of local Nusselt numbers have been decreased on
the hot disc and increased on the cold disc in outer part
of the cavity. This signifies that due to highest mass
flow rate a strong wall-jet of air has developed along the
hot disc which effects on the heat transfer from the hot
disc to air. Overall assessment of computed results of
both models demonstrates that the cold disc
computations show a good agreement with measurements
particularly for higher rotational speed and mass flow
rate. However, both models underestimating at the centre
of hot disc.
5.
CONCLUSIONS
Numerical predictions have been carried out through
the commercial CFD code ANSYS Fluent by invoking
two low Reynolds number turbulence models for the
range of rotational Reynolds numbers and mass flow
rates. Predicted local Nusselt numbers of both discs
show the negative values at initial stage and maximum
at the outer part of the discs. Negative values of the
local Nusselt numbers reveal the low temperature
gradient between the incoming cooling air and the
upstream disc and another possible reason is
inappropriate impingement of the incoming air on the
downstream disc. The significant effects of
buoyancy-induced flow parameter have been observed on the
computed flow structures, static temperature contours
and Nusselt numbers. For the higher rotational
Reynolds numbers the buoyancy-induced parameter is
more influential than the lower one, which is
characterised by an increase in the strength of the
recirculating vortex. Consequently more heat was
transferred from the hot disc to the cold disc. A
comparison of the two models show that for higher
rotational speed, the low Reynolds number second
moment closure computed the buoyancy-induced
effects more effectively than the k-ε model and showed
a closer agreement with the experimental measurements.
On the bases of discussion of result it is concluded
that the low Reynolds second moment closure model
can be used for the industry based complex geometries
6.
NOMENCLATURE
b outer radius of cavity
b m w
C = &/μ non-dimensional mass flow rate
G = s/b cavity gap ratio
k turbulent kinetic energy
Nu local Nusselt Number
p static pressure
P r Prandtl number
q heat flux
Reθ=Ωb2/v rotational Reynolds number
r radial coordinate
r/b non-dimensional radial co-ordinate
ri inner disc radius
S source term
s axial gap between the discs
U,V,W mean velocity components in z, r, θ
u,v,w fluctuating velocity components in z, r, θ
j iu
u Reynolds stress tensor
y+=un
τ/v wall-distance Reynolds number
z axial coordinate
z/s non-dimensional axial coordinate
ε dissipation rate of turbulent kinetic energy
µ dynamic viscosity
µT turbulent viscosity
φ generalised transport variable
Ω rotational speed of the disc
ρ density
δij Kronecker delta
ACKNOWLEDGEMENTS
The first author acknowledges Higher Education Commission, Ministry of Science & Technology, Government of Pakistan, for providing an opportunity and financial support to fulfil this work. Authors are also thankful to the Mehran University of Engineering & Technology, Jamshoro, Pakistan, for their encouragement and moral support.
REFERENCES
[1] Childs, P.R.N., Dullenkopf, K., and Bohn, D., "Internal
Air Systems Experimental Rig Best Practice", ASME
Paper GT2006-90215, 2006.
[2] Owen, J.M., and Onur, H.S., "Convective Heat Transfer
in a Rotating Cylindrical Cavity", Journal of Engineering
Power, Volume 105, pp. 265-276, 1983.
[3] Memon, M.D., "Numerical Modelling and Prediction of
Fluid Flow and Heat Transfer in Rotating Disc Geometries", Ph.D. Thesis, University of Sussex, 1995.
[4] Mirzaee, I., Gan, X., Wilson, M., and Owen, J.M., "Heat
Transfer in a Rotating Cavity With a Peripheral Inflow
and Outflow of Cooling Air", Journal of Turbomachinery,
Volume 120, pp. 818-823, 1998.
[5] Kilic, M., "Computation of Flow and Heat Transfer in a
Rotating Cavities with a Peripheral Flow of Cooling
Air", Annals of NY Academy of Science, Volume 934,
pp. 513-520, 2001.
[6] Karabay, H., Wilson, M., and Owen, J.M., "Predictions
of Effect of Swirl on Flow and Heat Transfer in a Rotating
Cavity", International Journal of Heat and Fluid Flow
Volume 22, pp. 143-155, 2001.
[7] Lock, G.D., Youyou, Y., Newton, P.J., Wilson, M., and
Owen, J.M., "Heat Transfer Measurements Using Liquid
Crystal in a Pre-Swirl Rotating-Disc System", Journal of
Turbomachinery, Volume 127, pp. 375-381, 2005.
[8] Owen, J.M., and Powell, J., "Buoyancy-Induced Flow in a Heated Rotating Cavity", Journal of Turbomachinery,
Volume 128, pp. 128-134, 2006.
[9] Owen, J.M., "Thermodynamic Analysis of
Buoyancy-Induced Flow in Rotating Cavities", Journal of
Turbomachinery, Volume 132, pp. 31001-31007, 2010.
[10] Vinod, K.B.G., Chew, J.W., and Hills, N.J., "Rotating
Flow and Heat Transfer in Cylindrical Cavities With
Radial Inflow", Journal of Engineering Gas Turbine
Predictions of Buoyancy-induced Flow in Asymmetrical Heated Rotating Cavity System
[11] Van, D.J.P., and Raithby, G.D., "Enhancement of the
SIMPLE Method for Predicting Incompressible Fluid
Flow", Numerical Heat Transfer, Volume 7,
pp. 147-163, 1984.
[12] Morse, A.P., "Application of a Low Reynolds Number
k-ε Turbulence Model to High-Speed Rotating Cavity Flows", Journal of Turbomachinery, Volume 113,
pp. 98-105, 1991.
[13] Lai, Y.G., and So, R.M.C., "On Near-Wall Turbulent
Flow Modelling", Journal of Fluid Mechanics,
Volume 221, pp. 641-673, 1990.
[14] Abbasi, A.F., Memon, M.D., and Baloch, A., "Modelling
and Predictions of Isothermal Flow Inside the
ClosedRotor-Stator Flows", Mehran University Research
Journal of Engineering & Technology, Volume 31, No.1,
pp. 83-94, Jamshoro, Pakistan, January, 2012.
[15] Memon, M.D., Memon, A.A., and Jokhio, M.H.,
"Application of the Low Reynolds Number Second
Moment Closure to the Closed Rotor-Stator Flows",
Mehran University Research Journal of Engineering &
Technology, Volume 18, No. 2, pp. 117-121, Jamshoro,