Micronesia
Andrew Gallagher*
School of Anatomical Sciences, University of the Witwatersrand, Parktown, Johannesburg, South Africa
Abstract
Background:Recent discoveries on Palau are claimed to represent the remains of small-bodied humans that may display evidence insular size reduction. This claim has yet to be statistically validated
Methodology/Principal Findings:Published postcranial specimens (n= 16) from Palau were assessed relative to recent small-bodied comparative samples. Resampling statistical approaches were employed to test specific hypotheses relating to body size in the Palau sample. Results confirm that the Palau postcranial sample is indisputably small-bodied.
Conclusions/Significance:A single, homogenous body size morph is represented in early prehistoric postcrania from Palau. Small body size in early Palauans is an ancestral characteristic and was likely not a consequence of in-situ size reduction. Specimens from Palau have little bearing upon hypothesised insular size reduction in the ancestral lineage of Homo floresiensis.
Citation:Gallagher A (2008) Size Variation in Small-Bodied Humans from Palau, Micronesia. PLoS ONE 3(12): e3939. doi:10.1371/journal.pone.0003939
Editor:Henry Harpending, University of Utah, United States of America
ReceivedJune 9, 2008;AcceptedOctober 24, 2008;PublishedDecember 17, 2008
Copyright: ß2008 Gallagher. This is an open-access article distributed under the terms of the Creative Commons Attribution License, which permits unrestricted use, distribution, and reproduction in any medium, provided the original author and source are credited.
Funding:The Natural Environment Research Council (UK), University of the Witwatersrand
Competing Interests:The author has declared that no competing interests exist.
* E-mail: [email protected]
Introduction
Body size variation in Southeast Asian terminal Pleistocene and Holocene humans is poorly understood. Present inhabitants of the SE Asian tropics display considerable body size variability [1–3]. ‘Negritos’ of the Philippines and surrounding Islands are distantly related to Polynesian peoples and approach African Pygmies in their diminutive size [1,4]. Archaeological material from Palau is pertinent to establishing a timeframe for the dispersal of small-bodied humans in Southeast Asia [5–7]. In a recent contribution, Berger et al. [8] concluded that specimens from archaeological sites in the Rock Islands display evidence of chronological size reduction. This was argued to be a function of significant ecological selection in a reproductively-isolated population [8].
Berger et al. [8] propose that postcranial elements recovered
from Ucheliungs and Omodokel caves (n= 61) sample the lowest
extremes of extant size variation inHomo sapiens(Table 1). This proposal has been the focus of contention within scientific circles [9,10]. Statistical appraisal of size variability within the skeletal sample from Palau [7,8] is imperative to understanding patterns and homogeneity of body size distribution in early prehistoric inhabitants of Micronesia and in validating any hypothesis of insular dwarfism [8].
This correspondence focuses upon two explicit hypotheses concerning body size in prehistoric humans from Palau. Does the skeletal sample from Palau [7,8] fall within observed morphological size ranges of extant small-bodied humans and is the skeletal sample homogenous or heterogenous? An explicit assessment of an associated femur and tibia from Chelechol ra Orrak [7] is pertinent. Simply stated, is there overwhelming evidence for a single, small-bodied morphotype among the earliest inhabitants of Palau?
Results
Results are consistent irrespective of whether bootstrapping or randomization is preferred [Supplementary Data 1]. African Pygmies and Southeast Asian Negritos are remarkably similar in their distal humerii but differ significantly in lower limb size profiles (Figures 1 and 2 [Tables S1 and S2]). The African Pygmy and Southeast Asian Negrito samples are significantly smaller than African and European samples [Tables S3 and S4]. Direct comparisons confirm that a majority of the Palau postcrania derive from individuals whom can be accommodated within the observed size ranges of small-bodied humans (Tables 2 and 3). Four distal humerii exceed the upper 95% CI’s for African Pygmies, but not SE Asian Negritos. Lower limb specimens are not excessively small and approximate the observed distribution of African Pygmies. Two lower limb elements; B:OR-15:18-009 [innominate] and B:OR-15:18-040 [proximal tibia] are ‘extremely small’. While the B:OR-15:18-040 proximal tibia approximates the LB1 hominin [11] there is little support for the hypothesis that these specimens exceed the lower size range in recent humans. In contrast, postcranial dimensions of the LB1 hominin cannot be sampled from recent small-bodied humans and are truly diminutive (Tables 2 and 3). Results confirm previous conclusions that the Rock Island specimens are those of small-bodied humans [8].
postcranial series is not significant and is generally consistent with that observed in small-bodied human references (Table 4). Statistical comparisons of the associated femur and tibia from Chelechol ra Orrak [7] confirms that these derive from a small-bodied individual [Figures S4 and S5]. Pairwise randomization and bootstrapped t-tests reject the hypothesis that the Chelechol ra
Orrak specimens exceed the size range of small-bodied humans. The observed homogeneity of prehistoric humans from Palau confirms the hypothesis that a single size morph is represented at c3000 BP. Early prehistoric Palauans were indisputably ‘small-bodied’.
Discussion
Ongoing investigations confirm an initial human presence on the southern Islands of the Palau archipelago by c3000 BP [5–8]. Berger et al. [8] proposed that the earliest inhabitants of the Rock Islands were small-bodied and this is confirmed by statistical analyses of available postcranial specimens. Two lower limb elements are unarguably ‘very small’ but even these small individuals do not approximate the diminutive size of the LB1 H. floresiensisholotype [11,12].
Analyses of within-group variability confirm that Palauan postcrania are neither excessively variable nor excessively small. All specimens included in this study approximate the size ranges of African Pygmies and Southeast Asian Negritos [13]. Statistical tests further confirm the remarkable homogeneity of size in prehistoric Palauans. Upper and lower limb elements from Chelechol ra Orrak are not consistently larger than corresponding specimens from the Rock Island sites [7,8]. An associated femur and tibia from Chelechol ra Orrak are within the size range of small-bodied humans. Results of this study provide no support for the hypothesis that two distinct size ‘morphs’ are represented at c3000 BP. Evidence overwhelmingly supports the conclusion that the pioneer colonists of Palau were small-bodied.
Berger et al. [8] hypothesized body size reduction among the Rock Island samples. Current contextual and chronological ambiguity at Omedokel cave compromises a hypothesis of insular dwarfism [8]. Published AMS dates are wildly disparate and contrast with the chronological controls evident at Ucheliungs [8]. Results overwhelmingly support the proposal that the earliest colonists of Palau were small-bodied and that within-situ size reduction cannot be substantiated by current evidence. Body size reduction in the ancestral population of earliest colonists of Palau is likely unconnected to the prolonged genetic isolation envisaged for the Middle Pleistocene of Flores [11,12,14–16].
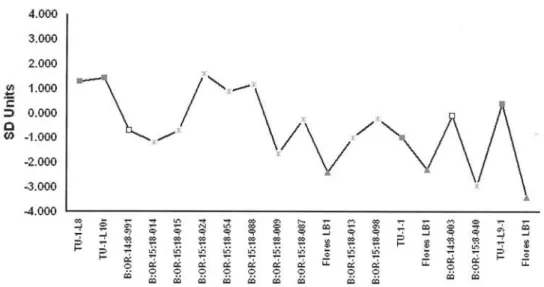
Figure 1. Specimen inventory numbers (see Table 1 for inventory) are from Nelson and Fitzgerald (2006; TU [Chelechol ra Orrak]), Berger et al. (2008; B:OR-14 [Ucheliungs], B:OR-15 [Omedokel]) and Brown et al. (2004; LB1). Chelechol ra Orrak, Grey Squares; Ucheliungs Cave, White Squares; Omedokel Cave, Grey Asterisks; Liang Bua 1, Grey Triangles.
doi:10.1371/journal.pone.0003939.g001
Table 1.Skeletal inventory from Palau used in the analysis.
Specimen Locality BIEPIC HDAB ACET FHD PTB
B:OR-14:8-991 Ucheliungs 34.90
B:OR-15:18-014 Omedokel 32.90
B:OR-15:18-015 Omedokel 34.90
B:OR-15:18-024 Omedokel 44.10
B:OR-15:18-054 Omedokel 41.20
B:OR-15:18-088 Omedokel 42.40
B:OR-15:18-009 Omedokel 39.50
B:OR-15:18-087 Omedokel 46.10
B:OR-15:18-013 Omedokel 36.10
B:OR-15:18-098 Omedokel 38.80
B:OR-14:8-003 Ucheliungs 63.10
B:OR-15:8-040 Omedokel 53.10
TU-1-L8 Chelechol ra Orrak
57.80
TU-1-L10r Chelechol ra Orrak
58.50
TU-1-1 Chelechol ra Orrak
36.10
TU-1-L9-1 Chelechol ra Orrak
64.80
Liang Bua 1 Liang Bua 36.00 31.50 51.50
Humeral bi-epicondylar breadth [BIEPIC]; Humeral distal articular breadth [HDAB]; Acetabulum diameter [ACET]; Femoral head diameter [FHD]; Proximal tibia articular breadth [PTB].
doi:10.1371/journal.pone.0003939.t001
Materials and Methods
Distal humeral, innominate, proximal femoral and proximal tibial specimens from archaeological sites dating to c3000 BP and younger (Table 1; 7, 8) and corresponding dimensions from Liang Bua 1 [11] were compared with two small-bodied reference samples. Resampling approaches were utilised [17,18]. Articular dimensions were the focus of this analysis [19–22]. African Pygmy
(n= 34) and SE Asian Negrito (n= 44) specimens are derived from several Institutions [Supplementary Data 1]. Resampling compar-isons were performed with and without replacement [17,18]. Initially, absolute deviations of individual specimens (table 1) from the arithmetic mean of the reference samples were randomization overn= 5000 iterations. These comparisons were performed using Rundom Projects 2 [23]; http://pjadw.tripod.com]. Computa-tional analyses of bootstrapped Student’s t’ in the case of a single
Figure 2. Specimen inventory numbers (see Table 1 for inventory) are from Nelson and Fitzgerald (2006; TU [Chelechol ra Orrak]), Berger et al. (2008; B:OR-14 [Ucheliungs], B:OR-15 [Omedokel]) and Brown et al. (2004; LB1). Chelechol ra Orrak, Grey Squares; Ucheliungs Cave, White Squares; Omedokel Cave, Grey Asterisks; Liang Bua 1, Grey Triangles.
doi:10.1371/journal.pone.0003939.g002
Table 2.Pairwise randomization comparisons of Palau and LB1 specimens.
Comparisons Parameter Sample A Sample B Obs Diff Rand Diff 5% CI 95% CI P-value Student Conf
African Pygmy V’s TU-1-L8 BIEPIC 50.54 57.80 7.261 3.641 0.508 6.932 0.025 Not Significant
African Pygmy V’s TU-1-L10r BIEPIC 50.54 58.50 7.961 3.754 0.532 6.956 0.026 Not Significant
African Pygmy V’s B:OR-14:8-991 HAB 36.83 34.90 1.925 2.861 0.195 6.094 0.670 Confirm
African Pygmy V’s B:OR-15:18-014 HAB 36.83 32.90 3.925 2.908 0.264 6.025 0.289 Confirm
African Pygmy V’sB:OR-15:18-015 HAB 36.83 34.90 1.925 2.875 0.195 6.094 0.672 Confirm
African Pygmy V’s B:OR-15:18-024 HAB 36.83 44.10 7.275 2.999 0.122 6.551 0.001 Confirm
African Pygmy V’s B:OR-15:18-054 HAB 36.83 41.20 4.375 2.886 0.053 2.611 0.264 Confirm
African Pygmy V’s B:OR-15:18-088 HAB 36.83 42.40 5.575 2.973 0.095 6.392 0.010 Not Significant
African Pygmy V’s B:OR-15:18-009 ACET 44.49 39.50 4.986 2.092 0.026 5.368 0.079 Confirm
African Pygmy V’s B:OR-15:18-087 ACET 44.49 46.10 1.614 2.020 0.085 5.148 0.576 Confirm
African Pygmy V’s Flores LB1 ACET 44.49 36.00 8.486 2.227 0.132 5.836 0.016 Confirm
African Pygmy V’s B:OR-15:18-013 FHD 36.65 36.10 0.547 1.936 0.104 4.913 0.817 Confirm
African Pygmy V’s B:OR-15:18-098 FHD 36.65 38.80 2.152 1.965 0.166 4.831 0.518 Confirm
African Pygmy V’s TU-1-1 FHD 36.65 36.10 0.547 1.953 0.104 4.913 0.814 Confirm
African Pygmy V’s Flores LB1 FHD 36.65 31.50 5.147 2.034 0.035 5.147 0.042 Confirm
African Pygmy V’s B:OR-14:8-003 PTB 60.09 63.10 3.012 3.693 0.523 9.665 0.568 Confirm
African Pygmy V’s B:OR-15:8-040 PTB 60.09 53.10 6.988 3.864 0.323 9.265 0.123 Confirm
African Pygmy V’s TU-1-L9-1 PTB 60.09 64.80 4.712 3.771 0.591 9.733 0.259 Confirm
African Pygmy V’s Flores LB1 PTB 60.09 51.50 8.588 3.943 0.387 9.201 0.087 Confirm
observation [24: 227–228] was computed using Resampling Stats for Excel 2003 [25].
The CV*, modified for small sample sizes [24], for available distal humerii (n= 6) can facilitate direct assessment within a single dimension. A bootstrapping approach repeatedly selected six specimens from the comparative series to calculate the CV* over 5000 iterations [26,27]. The test statistic is a ratio specifying the position of the observed CV* within a generated distribution of
CV*s of the comparative distributions (n= 5000). A modified version of the approach outlined in Green et al. [28] was used to assess variation within the postcranial series (n= 16). Geometric Means were calculated [24] for and the Grand Mean and standard deviation (SD) were used as proxies of within-sample variance. Grand Means and SD’s were bootstrapped 5000 times. Femoral and tibial lengths of the associated skeleton from Chelechol ra Orrak [7] were subjected to the test procedures as outlined previously.
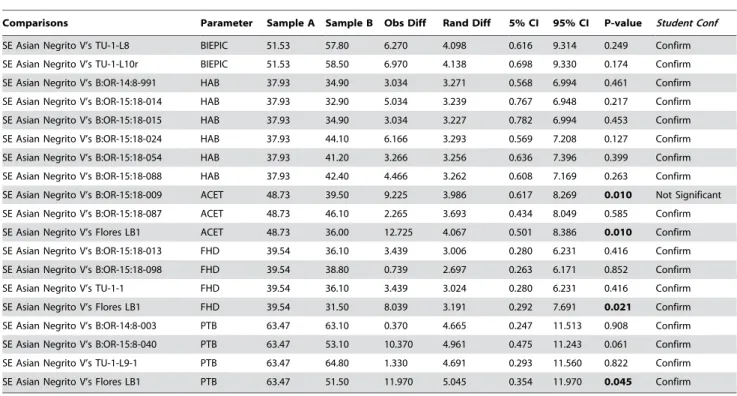
Table 3.Pairwise randomization comparisons of Palau and LB1 specimens.
Comparisons Parameter Sample A Sample B Obs Diff Rand Diff 5% CI 95% CI P-value Student Conf
SE Asian Negrito V’s TU-1-L8 BIEPIC 51.53 57.80 6.270 4.098 0.616 9.314 0.249 Confirm
SE Asian Negrito V’s TU-1-L10r BIEPIC 51.53 58.50 6.970 4.138 0.698 9.330 0.174 Confirm
SE Asian Negrito V’s B:OR-14:8-991 HAB 37.93 34.90 3.034 3.271 0.568 6.994 0.461 Confirm
SE Asian Negrito V’s B:OR-15:18-014 HAB 37.93 32.90 5.034 3.239 0.767 6.948 0.217 Confirm
SE Asian Negrito V’s B:OR-15:18-015 HAB 37.93 34.90 3.034 3.227 0.782 6.994 0.453 Confirm
SE Asian Negrito V’s B:OR-15:18-024 HAB 37.93 44.10 6.166 3.293 0.569 7.208 0.127 Confirm
SE Asian Negrito V’s B:OR-15:18-054 HAB 37.93 41.20 3.266 3.256 0.636 7.396 0.399 Confirm
SE Asian Negrito V’s B:OR-15:18-088 HAB 37.93 42.40 4.466 3.262 0.608 7.169 0.263 Confirm
SE Asian Negrito V’s B:OR-15:18-009 ACET 48.73 39.50 9.225 3.986 0.617 8.269 0.010 Not Significant
SE Asian Negrito V’s B:OR-15:18-087 ACET 48.73 46.10 2.265 3.693 0.434 8.049 0.585 Confirm
SE Asian Negrito V’s Flores LB1 ACET 48.73 36.00 12.725 4.067 0.501 8.386 0.010 Confirm
SE Asian Negrito V’s B:OR-15:18-013 FHD 39.54 36.10 3.439 3.006 0.280 6.231 0.416 Confirm
SE Asian Negrito V’s B:OR-15:18-098 FHD 39.54 38.80 0.739 2.697 0.263 6.171 0.852 Confirm
SE Asian Negrito V’s TU-1-1 FHD 39.54 36.10 3.439 3.024 0.280 6.231 0.416 Confirm
SE Asian Negrito V’s Flores LB1 FHD 39.54 31.50 8.039 3.191 0.292 7.691 0.021 Confirm
SE Asian Negrito V’s B:OR-14:8-003 PTB 63.47 63.10 0.370 4.665 0.247 11.513 0.908 Confirm
SE Asian Negrito V’s B:OR-15:8-040 PTB 63.47 53.10 10.370 4.961 0.475 11.243 0.061 Confirm
SE Asian Negrito V’s TU-1-L9-1 PTB 63.47 64.80 1.330 4.691 0.293 11.560 0.822 Confirm
SE Asian Negrito V’s Flores LB1 PTB 63.47 51.50 11.970 5.045 0.354 11.970 0.045 Confirm
doi:10.1371/journal.pone.0003939.t003
Table 4.Resampling models for Palau specimens.
Palau V’s African Pygmies
Comparison CV* Grand Means
St Dev
(Geo Means) OMD Femur Lth
Student’s t
(Femur Lth) OMD Tibia Lth
Student’s t (Tibia Lth)
Palau 12.786 47.21 11.10 392.00 318.00
African Pygmies 9.208 45.45 9.91 370.82 318.60
Obs Diff/Students t 1.760 21.180 0.954 0.600 20.027
,Obs Palau 4658 4860 4287 3410 2353 2033 2435
Significance 0.9316 0.9720 0.8574 0.6821 0.4707 0.4067 0.4871
Palau V’s SE Asian Negritos
Comparison CV* Grand Means
St Dev
(Geo Means) OMD Femur Lth
Student’s t
(Femur Lth) OMD Tibia Lth
Student’s t (Tibia Lth)
Palau 12.786 47.21 11.10 392.00 318.00
SE Asian Negritos 10.746 46.76 10.34 396.91 337.10
Obs Diff/Students t 0.450 4.991 20.199 19.105 20.865
,Obs Palau 3785 1701 3272 837 2588 2933 2647
Significance 0.7570 0.3403 0.6545 0.1676 0.5177 0.5867 0.5295
doi:10.1371/journal.pone.0003939.t004
Supporting Information
Table S1 Pooled-Sex descriptive statistics for the African Pygmy and Southeast Asian Negrito samples
Found at: doi:10.1371/journal.pone.0003939.s001 (0.04 MB RTF)
Table S2 Randomization comparisons of the small-bodied comparatives.
Found at: doi:10.1371/journal.pone.0003939.s002 (0.03 MB RTF)
Table S3 Randomization comparisons of the small-bodied comparatives.
Found at: doi:10.1371/journal.pone.0003939.s003 (0.04 MB RTF)
Table S4 Randomization comparisons of the small-bodied comparatives.
Found at: doi:10.1371/journal.pone.0003939.s004 (0.04 MB RTF)
Figure S1
Found at: doi:10.1371/journal.pone.0003939.s005 (3.68 MB TIF)
Figure S2
Found at: doi:10.1371/journal.pone.0003939.s006 (4.13 MB TIF)
Figure S3
Found at: doi:10.1371/journal.pone.0003939.s007 (4.10 MB TIF)
Figure S4
Found at: doi:10.1371/journal.pone.0003939.s008 (3.35 MB TIF)
Figure S5
Found at: doi:10.1371/journal.pone.0003939.s009 (3.88 MB TIF)
Acknowledgments
I would like to thank the curators of the various Institutions [Supplemen-tary Data 1] whom facilitated access to the comparative specimens in their care. Anthony Kegley, the late Charles Lockwood, John Hawks and an anonymous reviewer made critical and comments which greatly improved the submitted manuscript.
Author Contributions
Conceived and designed the experiments: AG. Performed the experiments: AG. Analyzed the data: AG. Wrote the paper: AG.
References
1. Martin R, Saller K (1957–1959) Lehrbuch der Anthropologie III Bands. Stuttgart: Gustav Fischer.
2. Eveleth PB, Tanner JM (1976) Worldwide Variation in Human Growth, 1sted. Cambridge: Cambridge University Press.
3. Eveleth PB, Tanner JM (1990) Worldwide Variation in Human Growth, 2nd ed. Cambridge: Cambridge University Press.
4. Bean RB (1923) Human Types. Quart Rev Biol 1: 360–392.
5. Liston J (2005) An assessment of radiocarbon dates from Palau, western Micronesia. Radiocarbon 43: 295–345.
6. Fitzpatrick SM, Dickinson WR, Clark G (2003) Ceramic petrography and cultural interaction in Palau, Micronesia. J Arch Sci 30: 1175–1184. 7. Nelson GC, Fitzpatrick SM (2006) Preliminary investigations of the Chelechol ra
Orrak cemetery, Republic of Palau: I, skeletal biology and palaeopathology. Anthropol Sci 114: 1–12.
8. Berger LR, Churchill SE, De Klerk B, Quinn RL (2008) Small-bodied humans from Palau, Micronesia. PLoS One 3: 1–11.
9. Dalton R (2008a) Pacific ‘dwarf’ bones cause controversy. Nature 452: 133. 10. Dalton R (2008a) Bones, Isles and Videotape. Nature 452: 806–808. 11. Brown P, Sutikna T, Morwood MJ, Soejono RP, Jatmiko, et al. (2004) A new
small bodied hominin drom the Late Pleistocene of Flores, Indonesia. Nature 431: 1055–1061.
12. Morwood MJ, Brown P, Jatmiko, Sutikna T, Wahyu Saptomo E, et al. (2005) Further evidence for small-bodied hominins from the Late Pleistocene of Flores, Indonesia. Nature 437: 1012–1017.
13. Shea BT, Bailey RC (1996) Allometry and adaptation of body proportions and stature in African Pygmies. Am J Phys Anthropol 100: 311–340.
14. Brown P, Morwood MJ (2004) Comments on Henneberg and Thorne. Before Farming 2004/4: 6.
15. Morwood MJ, O’Sullivan PB, Aziz F, Raza A (1998) Fission-track ages of stone tools and fossils on the east Indonesian Island of Flores. Nature 392: 173–176. 16. Morwood MJ, Soejono RP, Roberts RG, Sutikna T, Turney CSM, et al. (2004) Archaeology and age of a new hominin from Flores in eastern Indonesia. Nature 431: 1087–1091.
17. Manly BFJ (1997) Randomization, Bootstrap and Monte Carlo Methods in Biology. 2ndEd. London: Chapman & Hall.
18. Good P (2000) Permutation Tests. A practical guide to resampling methods for testing hypotheses, 2nd
Ed. New York: Springer Verlag.
19. Ruff CB (2002) Long bone articular and diaphyseal structure in Old World Monkeys and Apes. I: Locomotor effects. Am J Phys Anthropol 119: 305–342. 20. Ruff CB (2003) Long bone articular and diaphyseal structure in Old World Monkeys and Apes. II: Estimation of body mass. Am J Phys Anthropol 120: 16–37.
Figure 3. Bootstrapped Grand Means (n = 5000) for the SE Asian Negritos.
21. Ruff CB, Scott WW, Yiu AY-C (1991) Articular and diaphyseal remodeling of the proximal femur with changes in body mass in adults. Am J Phys Anthropol. pp 397–413.
22. Pearson OM, Lieberman DE (2004) The aging of Wolff’s Law: Ontogeny and mechanical responses to loading in cortical bone. Ybk Phys Anthropol 47: 63–99.
23. Jadwiszczak P (2003) Rundom Projects 2. (http://pjadw.tripod.com). 24. Sokal RR, Rohlf FJ (1995) Biometry: The principles and practice of statistics in
biological research, 3rded. New York: WH Freeman & Co.
25. Blank S (2008) Resampling Stats for Excel 2003.
26. Lockwood CA, Richmond BG, Jungers WL, Kimbel WH (1996) Randomization procedures and sexual dimorphism inAustralopithecus afarensis. J hum Evol 31: 537–548.
27. Schrein CM (2006) Metric variation and sexual dimorphism in the dentition of
Ouranopithecus macedoniensis. J hum Evol 50: 460–468.
28. Green DJ, Gordon AD, Richmond BG (2007) Limb-size proportions in
![Figure 1. Specimen inventory numbers (see Table 1 for inventory) are from Nelson and Fitzgerald (2006; TU [Chelechol ra Orrak]), Berger et al](https://thumb-eu.123doks.com/thumbv2/123dok_br/17289099.247913/2.918.93.447.120.536/figure-specimen-inventory-numbers-inventory-nelson-fitzgerald-chelechol.webp)