SRef-ID: 1680-7359/adgeo/2005-2-151 European Geosciences Union
© 2005 Author(s). This work is licensed under a Creative Commons License.
Geosciences
Sampling errors in rainfall measurements by weather radar
F. Piccolo1and G. B. Chirico2
1Institute of Atmospheric Sciences and Climate, CNR, Rome, Italy
2Department of Agricultural Engineering, University of Neaples Federico II, Italy
Received: 13 December 2004 – Revised: 15 April 2005 – Accepted: 18 April 2005 – Published: 13 May 2005
Abstract. Radar rainfall data are affected by several types of error. Beside the error in the measurement of the rain-fall reflectivity and its transformation into rainrain-fall intensity, random errors can be generated by the temporal spacing of the radar scans. The aim of this work is to analize the sen-sitivity of the estimated rainfall maps to the radar sampling interval, i.e. the time interval between two consecutive radar scans. This analysis has been performed employing data col-lected with a polarimetric C-band radar in Rome, Italy. The radar data consist of reflectivity maps with a sampling in-terval of 1 min and a spatial resolution of 300 m, covering an area of 1296 km2. The transformation of the reflectivity maps in rainfall fields has been validated against rainfall data collected by a network of 14 raingauges distributed across the study area. Accumulated rainfall maps have been calcu-lated for different spatial resolutions (from 300 m to 2400 m) and different sampling intervals (from 1 min to 16 min). The observed differences between the estimated rainfall maps are significant, showing that the sampling interval can be an im-portant source of error in radar rainfall measurements.
1 Introduction
The meteorological radar is a very powerful and useful tool for hydrological applications, since it can provide estimates of rainfall fields with a high spatial and temporal resolution over large areas. After the NEXRAD weather radar network has been established in USA (Ogden and Julien, 1994), other countries have been investing significant resources for creat-ing a weather radar network at national scale. Soon a large amount of radar rainfall data will be available for hydrologi-cal applications.
The weather radar emits electromagnetic pulsed radiation and it measures the backscattered echoes coming from the hydrometeors included in an elementary volume. The size Correspondence to:F. Piccolo
of this volume depends on the distance from the radar and it covers an area varying from a few hundred squared me-ters up to a few squared kilometres. The rainfall rate is es-timated from the received echoes. A single radar is able to scan an area of hundreds of squared kilometres in a few sec-onds (Sauvageot, 1992).
However, the estimation of the rainfall from radar mea-surements is affected by different sources of errors (Za-wadzki, 1984; Austin, 1987), which have to be well consid-ered and quantified for a proper interpretation of the collected data. Radar errors can be grouped in three classes (Jordan, 2000).
The first class concerns with all those errors which can be removed by simply adjusting the radar reflectivity maps. This is the case of the errors due to ground clutters, anoma-lous propagation and beam blocking.
The second class concerns with all those systematic er-rors in the transformation of the radar reflectivity maps in rainfall maps, due for example to wrong radar calibration or contaminations in the reflectivity measurements induced by ice in the atmosphere. This kind of errors can be removed by improving the algorithms employed for transforming the reflectivity data and validating the results against raingauge data collected over long periods of time.
The third class concerns with random errors. This kind of errors can be generated, for example, by rainfall gradients within the sampling volume, a variability in the distribution of the hydrometeors within the elementary volume and sam-pling errors associated with the temporal spacing of the radar scans. The aim of this study is to evaluate the significance of the sampling error.
152 F. Piccolo and G. B. Chirico: Sampling errors in rainfall measurements
Fig. 1.Accumulated rainfall map of the storm event of the 6 August 2004. The coastline, the Tevere river and the Great Highway Belt of Rome are depicted. The red asterisk marks the radar position. The square highlights the area selected for this study.
In the case of a raingauge network, the observation of the precipitation field is characterised by a very small support (equal to the size of raingauge) and by a large spacing, equal to the distance between the raingauges. For this reason, rain-gauge data need to be interpolated in order to obtain contin-uous precipitation fields. On the other hand, the raingauge observations are continuous in time (null spacing in time) and are characterized by a very small temporal support (the automatic raingauges are able to provide rainfall data with a temporal resolutions of a few tens of seconds).
On the contrary, radar observations are characterized by a good spatial resolution (spacing and support in the radar measurements are equal to the target volume), but they are not continuous in time, since they are characterised by a temporal spacing which can be of several minutes. National radar networks, such as NEXRAD, are generally operated in order to provide volume scans with an interval of 5–10 min and a spatial resolution of 1 km. For this reason, consecu-tive radar rainfields need to be interpolated in time in order to derive continuous precipitation fields. Usually this tempo-ral interpolation is performed by assuming that the precipita-tion field is staprecipita-tionary within the sampling interval. However, this assumption can generate significant errors in the esti-mated precipitation fields, which can be interpreted as tem-poral sampling errors.
While the errors in the estimation of the instantaneous precipitation field have been extensively studied in literature (Zawadzki, 1984; Austin, 1987; Chandrasekar and Bringi, 1988; Gorgucci et al., 1996; Sharif et al., 2002; Krajewski and Smith, 2002), the errors due to the temporal sampling of the radar scans have been barely studied (Fabry et al., 1994). The aim of this work is to illustrate the effect of the tem-poral spacing between the radar scans, using as case study
Fig. 2. Mean areal pluviographs with a temporal resolution of 15 min, estimated respectively with the radar data (top panel) and the raingauge data (bottom panel).
the data collected during a summer storm monitored with a C-band radar in Rome.
2 Experimental data
The experimental data employed in this work have been col-lected with a C-band polarimetric radar, the POLAR 55C, located at the Institute of Atmospheric Science and Climate of National Research Council of Italy, 20 km far from centre of Rome. The radar has been specifically designed to obtain the polarimetric observables at a high quality level. The an-tenna consists of a 5 m off-set paraboloid, the azimuth beam width is 0.92 degree, without radome.
For this specific study, the radar has been operated in order to get reflectivity maps with the highest possible temporal and spatial resolution. The pulse repetition frequency has been set at 1200 Hz, producing the maximum unambiguous range at the distance of 120 km. The pulse duration has been set at 0.5µs, the shortest possible, in order to get the highest possible spatial resolution, equal to 75 m in range. Radar scans have been performed at a single elevation angle (1.7 degree), such as a complete PPI could be acquired in just one minute.
The reflectivity data have been corrected for ground clut-ter contamination by a cascade of two filclut-ters (Giuli et al., 1991). The first filter has been derived by comparing reflec-tivity maps collected respectively during rainy and no-rainy periods. The second filter has been derived by analysing the standard deviation of the differential reflectivity. Then rain-fall maps have been calculated by transforming the reflectiv-ity maps with the classical equation:
Fig. 3. Accumulated rainfall observed at the raingauge of Rome Collegio Romano (continuous line) and mean accumulated rainfall observed over a squared area of 4 km2 centred on the raingauge (dashed line).
whereR is the rain in mm/h andZ is the reflectivity factor (mm6/m3). The parametersa andb have been set respec-tively to 0.1407 and 0.5413, based on an optimization algo-rithm specifically developed for C-band radars (Gorgucci et al., 1998). The derived rainfall maps have been validated against rainfall data measured by 14 automatic raingauges distributed across the area, with a temporal resolution of 15 min.
After a long monitoring period, an interesting data set has been collected on the 6 August 2004, during an intense con-vective storm of three hours. The storm is characterised by high spatial and temporal variability. Figure 1 shows the accumulated rainfall map estimated with the POLAR 55C. Figure 2 compares the areal pluviographs estimated respec-tively with the raingauge network and the radar. The average rainfall volume is about 6 mm, with local peaks higher than 30 mm. In some points, the storm released the entire rainfall volume in half an hour (Fig. 3).
A squared area with side 36 km long, where rainfall data is available with an average spatial resolution of 300 m, has been selected for this study. This area includes the entire urban area of Rome (Fig. 1).
The analysis performed on the selected dataset is illus-trated in the following section.
3 Experimental data analysis
The selected dataset has been transformed into a series 170 squared grids of 120×120 pixels, representing on a Cartesian system the instantaneous precipitation fields with a spatial resolution of 300 m and a temporal interval of one minute.
Fig. 4.Effect of the spatial aggregation on the accumulated rainfall maps.
These grids have been sampled in time and aggregated in space in order to evaluate the sensitivity of the estimated ac-cumulated rainfall maps to the sampling temporal interval, for different spatial resolutions. The accumulated rainfall maps have been calculated by assuming the rainfall fields sta-tionary within the sampling interval.
Rainfall grids have been sampled with 7 different sampling intervals,1t, ranging from 2 to 16 min. This set of sampling intervals covers the range of sampling intervals usually em-ployed by operational radars. The sampled rainfall grids have been scaled by a factor, such as the total rainfall volume cal-culated across the entire selected area does not change with the sampling interval. The application of this scale factor is equivalent to adjusting the parametera of Eq. (1) after em-ploying an optimization algorithm (Collier, 1996).
The rainfall grids have been also aggregated at three dif-ferent spatial scales, respectively 600 m, 1200 m and 2400 m, which are close to the typical spatial resolutions of opera-tional radars. The effect of the spatial aggregation on the accumulated rainfall map is illustrated in Fig. 4.
The accumulated rainfall maps obtained for different sam-pling intervals have been compared to those obtained with a sampling interval of 1 min at different spatial scales of aggre-gation. The differences have been evaluated by the Normal-ized Standard Error (NSE), defined as:
N SE (1s, 1t )= 1¯
P v u u u t
N1S
P
i=1
P1t 1s,i−P1s,i∗ 2
N1s
154 F. Piccolo and G. B. Chirico: Sampling errors in rainfall measurements
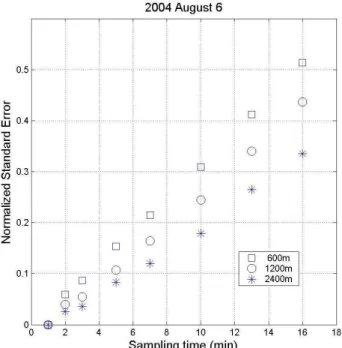
Fig. 5. Sensitivity of the Normalized Standard Error (NSE) to the radar sampling interval for different spatial aggregation scales.
is total rainfall volume computed overi-th pixel of side1s and with a sampling interval equal to1t,P∗
1s,iis the rainfall volume computed over the samei-th pixel but with a sam-pling interval of 1 min,P¯is the average rainfall volume com-puted across the entire selected area.
Figure 5 shows the calculated NSE values plotted versus the sampling interval for different spatial scales of aggrega-tion. The NSE values obviously increase as the sampling interval increases, while they decrease as the scale of spatial aggregation increases. In particular for a sampling interval of 5 min, the NSE values range from 10% to 15%, while for a sampling interval of 10 min the NSE values range from 20% to 30%. These error values are of the same order of mag-nitude of those generally ascribed to other sources of errors, such as systematic errors in the transformation of the radar reflectivity maps in rainfall maps (Brandes et al., 2002).
4 Conclusions
This study illustrated the effect of the temporal spacing of the radar scans on the estimated rainfall maps. The analysis was performed on C-band radar data collected with high spatial and temporal resolution during a summer storm in Rome. The specific aim of this work was to quantify the error that can be committed in the estimation of the accu-mulated rainfall map when the rainfall dynamics between two consecutive radar scans is not taken into account. The results show that the error in the estimated accumulated rainfall map can be significant even for sampling interval of 5–10 min, which are the sampling intervals usually employed in an operational context. Even though the results
herein presented are based on data of a single storm event, this study highlights that the effect of the temporal spacing of the radar scans is not negligible, especially when radar data are employed to assess the rainfall volume over small catchments or for distributed model applications (Anagnos-tou et al., 2004; Dabbert et al., 2000). In order to reduce the effect of the temporal sampling, appropriate radar scan strategies should be designed. As an alternative, methods for effective temporal interpolation of consecutive reflectivity maps should be developed and applied.
Edited by: L. Ferraris
Reviewed by: anonymous referees
References
Anagnostou, E. N., Anagnostou, M. N., Krajewski, W. F., Kruger, A., and Miriovsky, B. J.: High-resolution rainfall estimation from X-Band polarimetric radar measurements, J. of Hydrom-eteorology, 5, 111–128, 2004.
Austin, P. M.: Relation between measured radar reflectivity and sur-face rainfall, Mon. Wea. Rev., 115, 1053–1070, 1987.
Bl¨oschl, G. and Sivapalan, M.: Scale issues in hydrological mod-elling – a review, Hydrological Processes, 9, 251–290, 1995. Brandes, E. A., Zhang, G., and Vivekanandan, J.: Experiments in
rainfall estimation with a polarimetric radar in a subtropical en-vironment, J. Appl. Meteor.,41, 674–685, 2002.
Chandrasekar, V. and Bringi, V. N.: Error structure of multiparame-ter radar and surface measurements of rainfall. Part I: Differential reflectivity, J. Atmos. Oceanic. Technol., 5, 783–802, 1988. Collier, C. G.: Applications of weather radar systems: a guide to
uses of radar data in meteorology and hydrology, Wiley, Chich-ester, 390 pp., 1996.
Dabbert, W., Hale, J., Krajewski, W. F., Crook, A., and Mueller, C.: Forecast issues in the urban zone: Report of the 10th prospectus development team of the U.S. Weather Research Program, Bull. Amer. Meteor. Soc., 81, 2047–2064, 2000.
Fabry, F., Bellon, M., Duncan R., and Austin G.: High resolution rainfall measurements by radar for very small basins: the sam-pling problem re-examined, J. Hydrol., 116, 415–428, 1994. Giuli, D., Gherardinelli, M., Freni, A., Seliga, T. A., and Aydin, K.:
Rainfall versus clutter discrimination by means of dual linear po-larization measurements, J. Atmos. Oceanic Tech., 8, 777–789, 1991.
Gorgucci, E., Scarchilli, G., and Chandrasekar, V.: Error structure of radar rainfall measurement at C-band requencies with dual-polarization algorithm for attenuation correction, J. Geophys. Res., 101, 26 461–26 471, 1996.
Gorgucci, E., Scarchilli, G., and Chandrasekar, V.: Comparison of radar rainfall estimates and raingage measurements over the Cen-tral Apennines, Il Nuovo Cimento, 21C3, 265–279, 1998. Jordan, P. W.: Effect on flood modelling of rainfall variability and
radar rainfall measurement error, Ph.D. dissertation, Department of Civil Engineering, Monash University, Clayton, Victoria, Aus-tralia, 2000.
Krajewski, W. F. and Smith, J. A.: Radar hydrology: rainfall esti-mation, J. Adv. Water Res., 25, 1387–1394, 2002.
Sauvageot, H.: Radar Meteorology, Boston, MA, Artech House, 1992.
Sharif, H. O., Ogden, F. L., Krajewski, W. F., and Xue, M.: Numeri-cal simulations of radar-rainfall error propagation, Water Resour. Res., 38, 8, 15-1-15-14, 2002.