...
•
•
FUNDAÇÃO
GETUUO VARGAS
Lセ@
FGV
EPGE
Lセ@
F UNO A
ç
Ão
GETULIO VARGAS
.aRE
Instituto Brasileiro de Economia
.
セ[セセ[Gエ@
Seminários de Política
e」ッョュエヲヲゥjセセ@
セNjI@
-r::i '
Social EPGE/IBRE
"<
セQセ|@
セセ@
Falta de qualidade da educação
brasileira: Qual a magnitude do
problema?
CRESO FRANCO
(Departamento de Educação da PUC/RJ)
Data: 09/10/2006 (Segunda-feira)
Horário: 17h
Local:
Praia de Botafogo, 190 - 11
0andar
Auditório nO 2
Coordenação:
Prof. Pedra Cavalcanti Ferreira
ferreira@fgv.br
Praf. Marcelo Côrtes Néri
mcneri@fgv.br
•
•
•
•
NATIONAL EOUCATIONAL POLICIES ANO THEIR CONSEQUENCES FOR QUALITY ANO EQUITy1
Creso Franco
PontificaI Catholic University of Rio de Janeiro (Brazil)
Valerie E. Lee
University of Michigan (USA)
Natalia Satyro
PontificaI Catholic University of Rio de Janeiro (Brazil)
July, 2006
National Educational Policies and Their
Consequences for Quality and Equity
Abstract
In this paper we investigate how several national educational policies and practices influence both students' average reading achievement and the social distributioll of achievement within schools and countries.
Data come fJ:om the 2000/2001 administration of PISA (programme for International Student Assessment) by the Organization for Economic
Cooperation and Developrnent (OECD). They include observations from 212,880 lS-year-old students attending 8,038 secondary schools, which are located in 39 countries. We analyze these data with three-level Hierarchical Linear Models (HLM), with students nested in schools, which are nested within countries. Results focus on the role played by three country-level
educational policies: (1) retention/repetition; (2) the mix of students in schools based on socioeconomic status (school social mix); and vocational education. We explore how these policies influence the social distribution of achievemer.t between schools within countries. Implications of these findings are discussed.
•
•
•
..
OI
Introduction
Enduring questions of educational policy receive systematic attention from sociological researchers across national boundaries from time to time. The composition of schools based on their students' socioeconomic background
-- what might be called "social mix" -- is one of these enduring issues. This issue has been discussed at least since the publication of classic work of Wilson (1959), who explored how the socioeconomic composition of high schools influenced the college aspirations of low-SES students. A major focus of the Coleman report (Coleman et alo 1966) was racial desegregation and social mix in the form of school racial composition.
Although several sociological studies have emphasized the importance of promoting social mix within schools (Boyle 1966; Rutter et alo 1979), there is an enormous challenge in implementing social integration policies that promote both quality and equity in education. In several cases, social mix in the O.S. pursued on the basis of bussing policies proved problematic, as deprived neighborhoods become even more deprived. In these cases, policies advocating school social mix are challenged because they often come in direct conflict with school racial composition that results from extreme residential segregation. Middle-class families who are opposed to increasing social mix in their children's schools often "vote with their feet" by fleeing to wealthier neighborhoods. This results in formerly socially mixed communities and their schools becoming poorer and less integrated. This trend applies as much to O.S. areas as to the poor suburban bedroom communities in Latin America.
Another recurring issue on the international educational agenda relates to policies that focus on low-achieving students. Despite the existence of a substantial body of research documenting problems related to grade repetition or retention (e.g., Jackson 1975; Shepard and Smith 1990; Gomes-Neto and Hanushek 1994), policies that decry retention and advocate social promotion are not trouble-free. Some policy reversals about retention and social promotion are now occurring (Gomes-Neto and Hanushek 1994; Roderick, Bryk, Jacob, Easton, and Allensworth 1999; Nagoaka and Roderick 2004) .
National Educational Policies, Quality and Equity
European cO'lntries vocational secondary education continues to be widespread, and it is even being re-enforced (Shavit and Muller 1998).
These three recurring educational issues - school social mix,
retention, and vocational education -- pose challenges not only to schools
and local educational authorities but also to education policies across national borders. Due to differences in national cultures about the purpose of educatioll and young people's transitions from school to work, pOlicies related to vocational education in secondary schools vary widely across national boundaries. In regard to repetition and social mix, there is considerable international consensus among researchers that schools and countries should limit the policy of, requiring low-achieving students to repeat grades and should organize education toward more social mix in
schools. Despite such consensus among researchers and policymakers at higher leveIs, there is an enormous challenge at the local leveI to implement both promotion-ba,sed educational policies -- as an alternative to repetition-based
policies and to increase the social mix in the composition of schools in the face of extreme residential economic segregation. Such challenges are particularly daunting when considered within the context of an increasingly economically inequitable world. Consequently, there is wide variation in the extent to which individual countries are succeeding in confronting these important issues.
Variation in how countries enact and implement policies about school social mix, grade repetition, and vocational education is likely to influence both the quality and the equity of education outcomes in them. In this study we make use of recent and high-quality cross-national educational data to address these issues. We explore the extent to which country-level policies related to retention, school social mix, and high-school vocational education influence how adolescents fare academically. We investigate the effects of these policies on two outcomes: (1) students' average reading achievement
[quality) and (2) the social distribution of achievement across schools [equality) in several countries. In the next section we discuss national policies about grade repetition, school social mix, and vocational education, to provide a background for our own exploration of the effects of national
policies on the quality and equity of education.
Theoretical Background
Centralized and Non-Centralized Education Systems
There is wide variation in the extent to which education is regulated by national laws and standards. Though some countries have laws concerning
2
..
•
•
..
such educational issues as curriculum content, funding of education, teachers' qualification and salaries, and criteria for students' grade promotion, in other countries decisions about these policies are made by state or local authorities. Even if school systems are centralized, educational policies and practices conform to the values, beliefs, and constraints that shape each society. As a consequence, national features of educational systems are evident both in countries where education is
centralized and in those where education policy is more subject to local controlo An example involves policies about grade retention (often called repetition). In Latin American and African countries, retention is used as a filter for selection, so that only a, fraction of each age cohort actually enters or graduates from secondary education. Retention rates are moderate in developed countries such as the U.S. In other developed countries, such as Great Britain and Japan, grades are almost entirely organized by age, and retention is quite rare.
We investigate the extent to which we are able to explain between-country differences in both average achievement (we call this quality) and in the social distribution of achievement (equity) as functions of several national policies related to education. Although there is extant research on the effects the three policies we focus on - school social mix, retention, and vocational education - within countries or within smaller contexts, we locate no cross-national research that focuses on the consequences of such policies. Our brief review of literature on these policies is meant to set the stage for our consideration of the impact of these policies on
educational outcomes in the cross-national contexto School Social Mix
The variation in a school's enrollment related to the socioeconomic status (SES) of its students is what we call school social mix or "SES mix." Research about the effect of school social mix on student achievement builds on earlier research about the effect of social mix on aspirations for
education beyond high school (Wilson 1959; Boyle 1966) and by findings about how racially integrated schools influence minority students' achievement
(Coleman et alo 1966). Coleman and colleagues argued that the effect of racial integration is asyrnrnetric, in that effects on minorities were much stronger than on non-minority students. However, this issue was not a major facto r of the Coleman reporto
National Educational Policies, Quality and Equity 4
reported stronger positive effects on lower-SES students of attending schools with socially heterogeneous populations (i.e., with high social mix), with few effects - either positive or negative - on middle-class students (Summers and Wolf 1977; Henderson, Mieszkowski, and Sauvageau 1978; Lauder and Hughes 1990). On the other hand, Willms (1986) found that the positive effect of school social integration on lower-SES students was counterbalanced by negative effect on higher-SES students. Along the same line, in their review of the literature Lee, Bryk, and Smith (1993) pointed out that the effect of school social mix on school average achievement and on teachers'
self-efficacy was relatively modest.1
In sum, Gセィ・イ・。ウ@ the available literature is unambiguous in emphasizing that lower-SBS students benefit from attending schools with high social mix, the literature is inconsistent about whether school social mix has a
generally positive effect as emphasized by the asymmetric argument -- or
whether schol)l social mix is a zero-sum policy. As designed, our research may not resolve ':his controversy about how school policies and practices are linked to learning. However, we contribute to the discussion outlined above by exploring to the extent to which school social mix may explain between-country differences in average achievement and its social distribution.
Retention or Repetition
Policies related to repeating grades vary widely around the world. An overview of the national statistics related to retention reveals three basic national ー。エセ・イョウZ@ (1) countries in which grade repetition is nonexistent or negligible; (2) countries in which the rate of repetition is medium and a matter of se::ious concern for educational policy; and (3) countries in which retention rates are so high that, in practice, retention works to determine who will and will not have the opportunity to complete secondary education and potentially attend a university.
Although retention rates and concerns about retention at the national policy leveI differs considerably among nations, the findings from research about how retention influences students who experience it is consistent. The findings falI into three categories. First, retention is unequally distributed within the student population, with the least advantaged students more likely t:o be retained (Jackson 1975; Alexander, Entwistle, and Dauber 1994). Second, retention increases the probability of a student dropping out of school (Grissom and Shepard 1989; Roderick 1994; Allenworth 2004). Third, retention ヲ。セャウ@ to solve most learning problems of retained students
(Alexander ・セZ@ aI. 1994; Roderick et aI. 1999; Roderick and Nagaoka 2004; Shepard and Smith 1990).
...
•
•
Despite near unanimity about the negative consequences of retention, its alternative -- social promotion -- has been criticized for stimulating
an non-rigorous path through the educational system for students (Gomes-Neto and Hanushek 1994). Reducing social promotion has been shown to improve the achievement of promoted students (Roderick et aI. 1999). For retained students, there are a few findings indicating some learning benefits for students repeating a grade (Alexander et aI. 1994; Gomes-Neto and Hanushek 1994). However, the vast majority of the research on this topic concludes that retention typically increases the achievement gap between retained and non-retained students, when compared with the alternative policy of not retaining students (Holmes and m。エィ・セウ@ 1984; Roderick and Nagaoka 2004;
Shepard and Smith 1990). No studies focus on alternative educational
experiences for students who repeat a grade, perhaps because such experience are very unusual.
Given the generally nega tive effects of retention on achievement, it is surprising that the policy is still so common -- particularly in
developing nations. Considering the consistency of research findings, and given that we make use of a dataset where the sample is based on age (15 years old -- see data description below), we hypothesize a substantial
negative effect of policies that induce high retention rate on national averages of achievement .
Vocational Education
Among sociologists of education, there is consistent evidence that curriculum differentiation, in general, and vocational education as a particular form of curriculum differentiation, is associated with an
inequitable distribution of achievement (Gamoran 1987; Jones et aI. 1986; Lee and Bryk 1988; Natriello et aI. 1989). Despite this evidence, Levesque and colleagues (2000) make a convincing argument that many of the research
findings about the negative effect of vocational curriculum participation are a result of selectivity bias. That is, lower-achieving students are often encouraged into vocational education (or opt it themselves), and they are likely to choose to engage in less rigorous coursework than their higher-achieving peers, thereby compounding their academic disadvantage and widening the achievement gap. Access to longitudinal data would be important to
evaluate the alternative hypothesis advanced by Levesque et aI. (2000).
National Educational Policies, Quality and Equity 6
promoted inequality in course taking. These practices by students promoted lower leveis of learning for students who enrolled in less demanding courses, including those associated with vocational education. Their results led them to advocate less curriculum differentiation, especially eliminating
undemanding courses in secondary school.
What do these findings about curriculum differentiation imply for international research? A direct implication of research results about curriculum differentiation of within-country research (mostly in the U.S.) exploring the effects of vocational education on achievement suggests that we should expect that a national emphasis on vocational programs in secondary schools might lead to a less ・アオゥエ。「セ・@ social distribution of achievement. Another implication is that a national emphasis on vocational education might influence countries' average achievement.
Research Using PISA
There is a growing body of research using data from PISA. The large majority of studies focus on topics that are quite different from the one we pursue in this study. For instance, there are studies on comparative
effectiveness of private and public schools (Vanderberghe andRobin
2004,Corten and Dronkers 2006), on gender differences (Van Langen, Bosker and Dekkers 2006), on family background and school factors (Marks, Cresswell and Ainley 2006, Thorpe 2006, Fertig and Wright 2005, Lee, Franco and Albernaz 2005, Nash 2003) on the effect of socioeconomic background on achievement
(Willms 2006, Marks 2006, Gorard and Smith 2004, and Nash 2003). Virtually ali these studies used multilevel methods. The vast majority of PISA studies conducted 。セ。ャケウゥウ@ separated by countries, as we have done in another study
(reference to be entered later). We located only one study (Corten and Dronkers 20C6) that combined PISA countries in a single analysis, as we have done in this study. We also located one study (Van Langen, Bosker and Dekkers 2006) that Lsed additional country information - participation of women in college in the areas of science, technology, engineering and mathematics - in order to investigate whether moderation of gender gap between schools and across countries promotes greater enrollment of women in science-related tertiary education. Our study makes use of the multilevel approach that guided most PISA studies. It also shares two features presented by the two conducted the joint analysis for several countries and the use of additional country levei data. In our study the aim is to investigate the effects of three national educational policies on student academic outcomes, as specified below.
•
Research Questions
Question 1: Policy and quality. Are national educational policies associated with school sociaIs mix, grade repetition, and vocational
education linked with educational quality, defined by 15-year-old students' achievement in the domain of literacy? If so, are the effects of these policies positively or negatively associated with quality?
Question 2: Policy and equity. Are countries' educational policies concerned with school social mix, repetition, and vocational education also associated with educational equity, defined by the social distribution of achievement by students' SES both within and between schools? If so, are the effects of these policies to increase or decrease social equity in
educational outcomes?
Method
Data
We draw data for this study from a current and ambitious cross-national educational collection effort sponsored by the Organizational for Educational Cooperation and Development (OECD), the programme for International Student Assessment (PISA) (OECD 2002). The 2000/2001 PISA data collection was
intended to be the first of many such efforts. PISA 2000/2001 is a cross-sectional study that included 43 countries; the majority (28) were members of OECD, but PISA also included several (15) non-member countries. This first ambitious international effort focused on students' achievement in reading, with smaller assessments in mathematics and science. Subsequent PISA studies focus more on these other disciplines. Besides achievement scores, PISA also included survey information about students, their families, and schools. Students and school principaIs were surveyed, but teachers were noto
The PISA sampling strategy centered on students of a particular age: 15 years. Approximately thirty 15-year-old students were sampled from a
stratified national sample of secondary schools in each country, regardless of their grade. The data we use, which comprise close to the full PISA sample, include survey information and test scores from 212,880 15-year-old students, who attended 8,038 secondary schools which were located in 39 OECD and non-OECD countries. Although our data about students and schools come directly from PISA, we drew country-level data from UNESCO and World Bank sources.
National Educational Policies, Quality and Equity 8
Bulgaria, and Lietchtenstein was because they lacked the country-level data we needed. We excluded Albania for statistical reasons: we first estimated our multilevel models including Albania and verified that the data from Albania vio:.ated some assumptions of model estimation; Albania was clearly an outlier. After we dropped Albania and re-estimated our models, statistical information revealed compliance to the assumptions of model estimation. The exclusion of Albania changed point estimations only slightly without any major change in hypothesis tests concerning variance. For the remaining 39 countries, Gur analysis of residuaIs indicated that our analytic models complied well with the assumptions of the modelo
Measures
Our dependent variable is the reading achievement of 15-year-old students attending schools in the 39 PISA-participant countries. The PISA readinç: test measured "the ability to understand, use, and reflect on written texts in order to achieve one's goals, to develop one's knowledge and potential, &nd to participate effective1y in society" (OECD, 2001:21). Using student performance on items on the reading test, the PISA team used Item Response Theory (IRT) to develop several estimations of IRT-based measures of reading achievement (OECD 2001). In this study we make use of what is called the "Warm-estimated" IRT score as our dependent variable. We chose this particular score because it is based on students' performance on the reading items, and has not been conditioned on students' background. Readers wishing more informaction about the psychometric properties of the several proficiency measures available in PISA are referred to the PISA technical manual (OECD 2001) .
The independent variables considered in this study are measured at three leveIs: students, schools, and countries. Student-level measures include the PISA-constructed SES composite, based on students' reports of parents'
education, parents' occupational staius, and the availability in their
households of resources related to wealth and to education.2 The only
school-leveI variable we use is school average SES, which we created by aggregating the student SES to the school leveI. We included three country-level
variables: country average of schools' social mix, emphasis on vocational education, and a set of two dummy variables based on the proportion of students that repeated grades in each country.3 We also included a country leveI control variable: the national average educational expenditure per student. We drew our information on repetition, vocational education and expenditure per student from World Bank and UNESCO databases. We provide some
.
.
•
.:
•
•
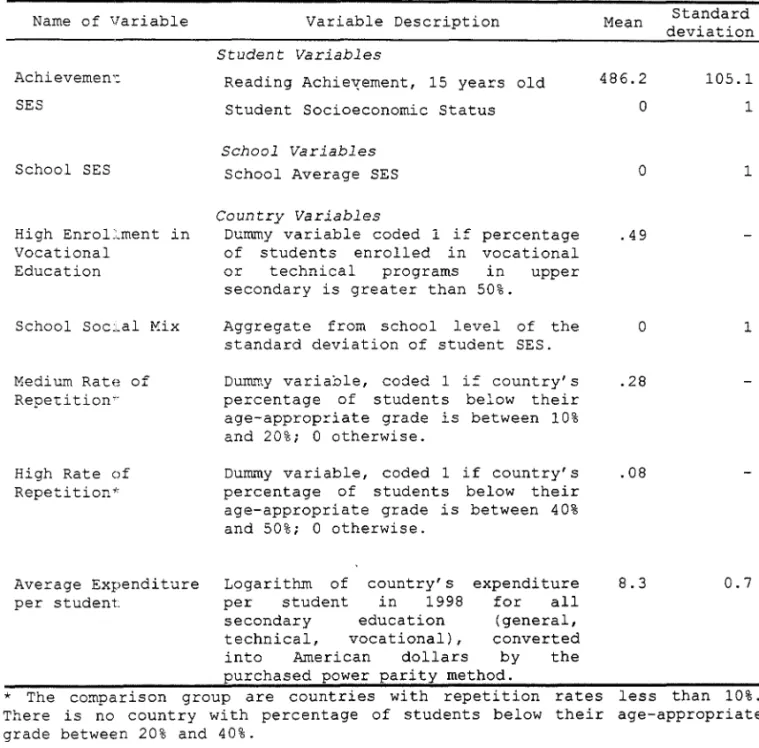
basic information about measures we use to describe students, schools, and countries in Table 1 .
Insert Tab1e 1 about here
We left dependent variable, reading achievement, in its usual PISA metrics. This variable has a mean [M] 500 and standard deviation [SD] 100 among the 28 OECD countries. However, in our sample of 39 countries, the actual mean is slightly lower (486) and the SD slightly higher (105). We standardized our measures of student SES, school SES, and school social mix for our sample (M=O, SD=l). Our country levei measure of school social mix was obtained by averaging for each country the SD of SES in each school. The full description of the other variables used in the analysis is presented in Table L
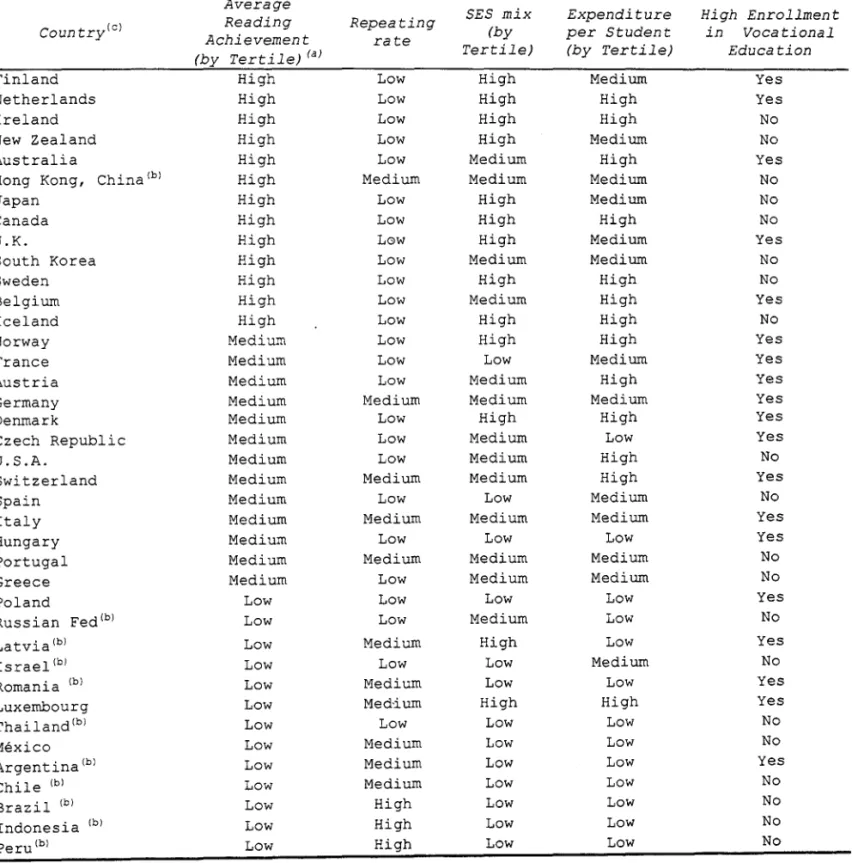
In Table 2 we provide some descriptive information about the 39 countries included in the analysis. For making reading of this table easier, we present in this table information on continuous measured variables into thirds, and list the countries included in our ana1ysis in order of their average achievement. Readers can note that the countries from which the authors of this paper come are not near the topo U.S. 15-year-olds scored near the middle in PISA, and Brazilian 15-year-olds near the bottom. The latter is particularly noteworthy, in that a large percentage of Brazilian students have left school by age 15, so the Brazilian sample is somewhat select. Order of countries' scores is not directly related to its levei of economic
development.
Insert Table 2 about here
Although the PISA countries with'high repetition rates (between 40 and 50 percent) are ali at the bottom of the achievement distribution (Brazil, Indonesia, Peru), the distinction between low (below 10 percent) and medium
(10-20 percent) repetition rates seem unrelated to the achievement ranking. Expenditure per student is closely associated with achievement rankings, with a few exceptions. Countries' emphasis on vocational education is not at ali associated with achievement rankings, at least not in the order one would expect based on research about the effects of vocational education on achievement.
Analytical Approach
National Educational Policies, Quality and Equity 10
in turn nested within countries. Thus, our analytical approach uses
Hierarchical Linear Model (HLM -- Raudenbush and Bryk 2002). Qur interest in
the quality of education across countries led us to model school average achievement, which we controlled by school average SES. Qur interest in equity led L.S to model both the school-Ievel SES/achievement slope (within-school equity) and the country-Ievel average SES/achievement slope (between-school within-country equity).
As suggested by Raudenbush and Bryk (2002), we adopted a bottom-to-top modeling strategy. We started by fitting a fully unconditional model, in order to partition the variance of the outcome into its three components: (1) within schoels, (2) between schools within countries, and (3) between
countries. Next, we fitted a random coefficient model, including only
students' SES at LeveI 1. As both the Level-1 intercept and the students' SES slope varied between schools within countries, it was reasonable to control the intercept for school average SES. Moreover, the specification of a model with a control for school average SES was important, as it allowed us to investigate the extent to which school SES/achievement slopes would be influenced by the country-wide pOlicies considered in this study.
This model specification process also guided the formulation of our final model in ッセイ@ bottom-to-top modeling strategy. Here, the three Level-2
coefficients (school average achievement, student leveI SES/achievement slope, and the school average SES/achievement slope) are alI random variables at leveI 3 (oetween countries). These are the random variables, which are modeled as a function of variables that express national educational
policies, na)nely, repetition, school social mix, and vocational education. As students' 。」セゥ・カ・ュ・ョエ@ is strongly influenced by the expenditures that each
country can afford to spend in education, we controlled our analysis by the average ・クー・セ、ゥエオイ・@ per student in secondary education. We tested alI
country-leveL variables on the three' level-3 outcomes. However, although we retained alI variables in intercept model, we retained only the cross-Ievel interaction:erms that were statistically significant in the models of the two random slopes.
Results
LeveI: HLM modelo Results for our fully unconditional HLM model indicate that 50.7 pe.ccent of the total variance in achievement lies at LeveI 1
(between students within schools), 27.7 percent is at LeveI 2 (between schools キゥエィセョ@ countries), and 21.6 percent is at LeveI 3 (between
countries). \fJe next estimated a level-1 random coefficient model by adding
'.
:
•
•
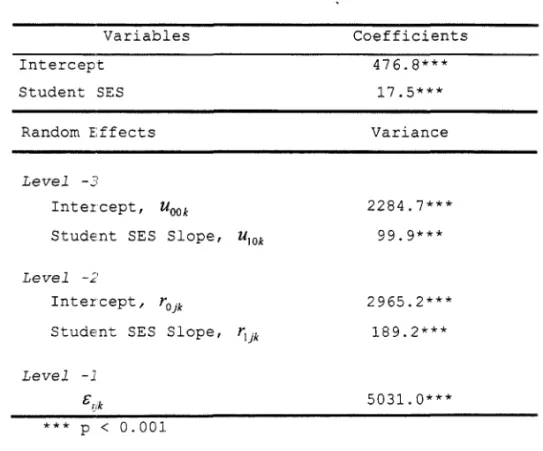
student SES. Table 3 presents these results, which indicate that across schools, average achievement controlled for student SES is 476.8. Average achievement varies between schools within countries and between countries
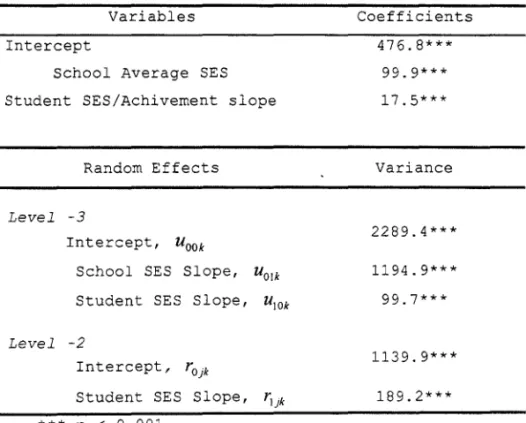
(both at p<.OOl). Table 3 also indicates the average within-school effect of students SES on achievement (17.5 points for a 1 SD change in SES). This effect also varies between schools within countries and between countries (both p<.OOl). In the level-2 HLM model we included a control for school average SES. These results are presented in Table 4.
Insert Table 3 and 4 about here
LeveI 2 HLM modelo In Table 4 the Level-1 intercept is modeled as
function of school average SES. The results presented in Table 4 are well in line to the ones already commented in the context of presentation of leveI 1 modelo In addition to these results, Table 4 indicates that an increase of one SD in school average SES is associated to an average increase of 99.9 in
school average reading achievement. The strength of the association vary between countries (P<O.OOl).
Final 3-level HLM modelo The results of our final HLM model, shown in Table 5, represent the major focus of this study and address our two research questions. The three coefficients that vary randomly between countries
--school average achievement, the within---school SES/achievement slope, and the school average SES/achievement slope -- are our level-3 outcomes. It is here
that we consider the effects of country-level educational policies on quality (higher achievement) and equity (lower effect of student SES and school
average SES on achievement). As Level-1 and Level-2 coefficients remained stable across the sequence of models just described, in Table 5 we simplify results by presenting only the results from our final Level-3 HLM model.4
Insert Table 5 about here
Results focused on quality. Based on the research about grade repetition,
National Educational Policies, Quality and Equity 12
homogeneous (an increase of 17.1 points for every 1 SD of schoo1 social mix, p<.OOl). In countries that emphasize vocational education, meaning that their secondary schools were differentiated rather than that alI schools emphasized a general cCJffiprehensive curriculum focused on academic concerns, the
coefficient for vocational education on average achievement is not statistically significant(although the point estimate is negative, - 3.8 points). These results were obtained in models where we controlled for countries' average expenditure per student (a 16.3 point increase for every point in this logarithmic scale). Supporting results reported in the
literature, we found negative effects for high and medium rate of repetition (compared to low rates). Our results for school social mix and for vocational education policy were not consistent with most findings on these policies. However, we should emphasize that our findings were obtained in the context of cross-national research, while the effect of social mix and of vocational policies are frequently investigated in the context of specific countries or regions.
Results focused on equity. We approached the issue of equity in the
social distribution of achievement by considering both the main effects of our key variables and their cross-level interactions. In the first place, we turn to the student SES/achievement slope. We had already mentioned the positive effect of school social mix on school average achievement (gamma coefficient of 17.1 points). However, the gamma coefficient estimating the effect of school social mix on the student SES/achievement slope is positive
(2.5 points, p<.05), slightly increasing the effect of students' SES on achievement. In short, higher school social mix increases quality (higher school average achievement) but also increases within-school inequality
(higher effect of students' SES on achievement). In order to make the
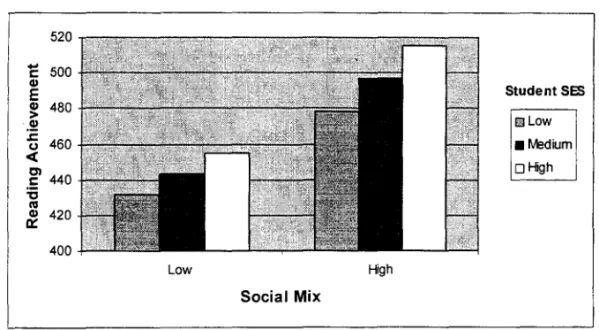
interpretation of these results more meaningful, we must consider the effect of school social mix simultaneously bn average achievement and on student SES/achievement slopes. This can be visualized in Figure 1 which illustrates three important features of the model presented in Table 5:
- School social mix is linked with higher quality (i.e., higher average achievement is associated with more social heterogeneity in schools); - School social mix is negatively linked to within-school equity (the higher
the school social mix, the greater the achievement gap between lower SES students 。セ、@ higher SES students in the same school); and
- The positive overall effect of school social mix, expressed by higher levels of'l.chievement for countries with more social heterogeneity in their
'.
:
•
•
schools, regardless of the leveI of SES of the student within his or her school.5
Insert Figure 1 about here
On the one hand, the pro-quality effect of school social mix is evident. On the other hand, we need to consider the interpretation of both the
regressive effect of school social mix for within-school equity and the overall positive effect of school social heterogeneity. Low social mix means considerable social stratification of schools by SES. In an extremely low social mix school, however, the concept of within-school equity is
meaningless. At the opposite extreme, high school social mix means that schools are challenged to deal with a diverse social composition, which is usually accompanied by considerable academic diversity.
In order to understand the effect of school social mix in this complex situation, we illustrate in Figure 1 the joint effect of school social mix on both average achievement and student SES/achievement slope. The graph
emphasizes the positive overall effect of school social mixo We created Figure 1 by choosing arbitrary values for low/high school social mix and low/medium/high SES, but the trends would be independent of the values chosen for Figure 1. Our argument relies on a two-part computation of the overall effect of school social mix: its main effect on school average achievement and its interaction effect on the student SES/achievement slope. When the pro-quality effect is greater than the regressive effect related to an
increase in the SES/achievement slope, we argue that the overall effect would be positive for most students. Here, the pro-quality effect on the school average (17.1 points) is much greater than the regressive effect related to the increase of the student SES/achievement slope (2.5 points). Thus we conclude that, on average, a country'with policy leading to high social mix induces benefits for students.6
We turn now to interpreting the effect of our key country-level policy variables on the school average SES/achievement slope. We estimated a
positive effect for emphasis on vocational education (gamma = 25.2, p<.OOl). This means that in countries that emphasize vocational education, the
relationship between school average SES and achievement is stronger than in countries where most students are enrolled in secondary schools that
National Educational Policies, Quality and Equity 14
way vocatioJal emphasis influences achievement is to be linked with to greater bet''''leen-school inequality in the social distribution of achievement. Figure 2 illustrates this feature.7
Insert Figure 2 about here
Keeping in mind the non-significance of our vocational education policy on average achievement, Figure 2 illustrates the socially stratifying effect of vocational education on students' achievement in reading. Holding alI other variables constant, the achievement gap between low-SES schools and medium-SES schools is greater in countries that emphasize vocational
education HセN・NL@ counties in which some high schools offer only vocational education). The effect of emphasis on vocational education is limited to its increase in inequality in the distribution of reading achievement. Although in countries that emphasizes vocational education the mean achievement is unaffected, achievement at these countries is more stratified by students' SES.
Expenditures on education. Table 5 also shows how country-average
average educ:ational expenditures are linked with achievement. Although we believe it セ⦅ウ@ important to control for expenditures, we do not consider this as an import:ant policy variable; thus we do not emphasize these results. It seems reasonable that the most important factor determining the amount of resources that countries invest in secondary education is countries' wealth, despite the fact that countries' investments in education may vary with the proportion of their Gross Domestic Product (GDP) invested in education. It is not reasonable to assume that this effort can actually be as elastic as is the variance of our variable that captures the log of the U.S. dollars per student invested by each country in secondary education.
Our findings here indicate: (a) that expenditure is important for average achievement (gamma coefficient of 16.3, p<.OOl); (b) that higher expenditures are associated with inequality (i.e., a higher school average SES/achievement slope), suggcesting that schools enrolling high-SES students are more likely to receive even more resources than schools with low-SES students when more resources are available; and (c) that expenditures are also associated with higher student SES/achievement slope, suggesting that unless resources come to schools based on specific polices that target within-school equity, more resources ir,crease within-school as well as between-school inequalities.
•
effect of resources on achievement, in the same way we discussed the overall effect of school social mixo In order to compute overall effects, we would need to add the effect of educational expenditure on average achievement to its effect on both school average SES/achievement slope and student
SES/achievement slope. This computation indicates that 96.3 percent of students would benefit from increasing average expending per student.8 That
is, the effects on quality trump those on inequality. On the other hand, the fact that increased expenditures may lead to inequality in the social
distribution of achievement within countries is something that educational authorities need both to recognize and to learn how to deal with.
Explaining variance. Although explaining variance is far from the major
goal of this analysis, it is useful to see how country-level policies concerning repetition, school social mix, and vocational emphasis, and educational expenditures explain the between-country variance in achievement
(adjusted for student and school social differences). Compared to our reference model in Table 4, the between-country Level-3 HLM model presented in Table 5 explained 83 percent of the variance between countries in average reading achievement, 30 percent of the variance in the school average
SES/achievement slope, and 44 percent of the variance of student
SES/achievement slope. Considering the modest number of policy-related issues we considered in these models, we suggest that their success in explaining differences between countries is impressive.
Conclusions
The average reading achievement of 15-year-01d students participating in PISA 2000 varied widely between the 39 countries we considered. For almost alI of the OECD member countries participating in PISA, the range of country average achievement was within .5 SD of OECD mean. This represents a
considerable variation, considering that country average is itself an
aggregate measure of student and school measures. However, variation was even greater for countries that were not OECD members. For most non-OECD countries and also Mexico (which is an OECD member), country average achievement was a full SD (100 points) below the OECD mean of 500. We also found that social background -- considered for both individual students and schools -- was very strongly associated with reading achievement within and between schools.
In this study, we explored some country-wide educational policies to explain these differences. In combination, these policies -- on school social
National Educational Policies, Quality and Equity 16
countries' per-student expenditures on education, together explained a substantial proportion (over 80 percent) of the systematic variation in reading 。」ィセ・カ・ュ・ョエ@ between countries. We considered country average achievement as a measure of educational quality, as this achievement has been adjusted for student background. Because quality sometimes comes at the cost of educational equity, we also considered direct measures of educational equity, focusing on both the relationship between students' SES and achieverlent wi thin schools and the relationship between school average SES and school average achievement within countries. In this regard, policies that are simultaneously related to quality (i.e., to higher average
achievement) and to equality (i.e., to lower relationships between SES and achievement either within or between' schools) we regard as "good policies."
Our findings suggest that national policies on school social mix and on grade retention are associated with educational quality across countries. Countries wr:.ose schools enroll a more heterogeneous population of students
(i.e., with more school social mix) achieve higher quality (i.e., where average achievement is higher). However, in countries whose schools exhibit more social mix achievement is distributed less equitably. As argued earlier, when these results are considered simultaneously, findings about quality related to school social mix are considerably stronger than those about inequality. Our findings lead us to conclude that increasing school social mix is a goc>d policy. Because school enrollment is generally tied to residential location, and because residential location is often highly
stratified economically, policy makers might not see increasing school social mix as a distinct social policy. We disagree. Which schools are attended by which studerts is an issue within the purview of policy. We urge that educational policymakers consider seriously reducing the social stratification of school enrollment.
Our findings about retention are'perhaps not surprising, given that the large ーイ・ーッセ、・イ。ョ」・@ of research on retention or repetition demonstrates that
this policy is ineffective or actually damaging. Our evidence on repletion provides additional cross-national support for previous findings. Compared to countries where repetition rate is low, countries with medium repetition rates, and especially those with high repetition rates, are consistently lower in terms of the quality of education.
We shall now turn to the issue of vocational education. A glance at Table 2 will remind readers that the vocational emphasis countries are mostly developed, including many high-achieving European countries (e.g., Finland, Belgium, uNセNL@ Switzerland, Germany), some Asian countries (Hong Kong,
Australia), some Eastern European countries (Hungary, Czech Republic, Poland), and at least one Latin American country (Argentina). That is, vocational emphasis does not seem to be tied to economic development. Our findings about the policy of vocational education in secondary schools suggest that this is unrelated to quality but rather strongly related to equity -- especially to our equity measure at the school level (the average
SES/achievement slope). Our analyses suggest that if countries emphasize vocational education between schools, a more inequitable distribution of achievement by SES results. Although this is not surprising, given that enrollment in vocational education has been shown to be tied to students' social background, we suggest that counties need to pay attention to equity as well as quality. And the evidence here is clear: vocational emphasis leads to social inequality in the distribution of achievement.
Although our focus has not been on how per-pupil expenditures on education influence quality and equality in educational outcomes, we feel obliged to report that although expenditure are surely positively related to quality (unsurprising), increasing expenditures seems to lead to inequality both within and between schools. This is likely to derive from two sources. Although within a particular country, there is a logic that would suggest that expenditures should be unequally distributed - with schools that need the most resources receiving them -- the evidence is that the opposite
happens. Between-school inequality in the distribution of achievement by social background is increased, as it would seem that more expenditures actually go to schools that probably need them the least.
We also have evidence that national expenditures increase inequality within schools. This suggests that, even within school, higher SES students may benefit more than lower SES students from the available resources of schools. In this context, promoting equality within schools involves
awareness and commitment from teachers, in order to assist those students who most need school resources to make a profitable use of them. Our findings about expenditures lead us to at least one conclusion. Schools and countries should pay close attention to how resources are distributed and not just to the total resources devoted to education. We draw another broader conclusion from this piece of research: Educational policymakers should pay as much attention to equity as to quality. Truly good education and good educational policies must focus on both of these aspects of the distribution of
educational outcomes.
National Educational Policies, Quality and Equity 18
social mix, and to social stratification in education by means of vocational education. Our results about vocational emphasis reveal that although its effect on quality is neutral, its effect on the equitable distribution of achievement between schools within countries is regressive. This finding is particularly important within the context of the emphasis within the PISA data collection on assessing of learning skills for life. The PISA framework for assessment relies on the basis that reading competencies are essential not only in comprehensive academic education but also for meeting the
increasing demands of a changing work environment. In this context, countries emphasizing vocational secondary education will have to cope with the
•
Technical. Notes
1. It is important to understand that school social mix and school average SES are intertwined: a school with high SES mix, by definition, cannot be have a very low or very high average SES. This leads to an important conclusion: Very low-SES or very high-SES schools are schools, by
definition, with low SES mixo It is reasonable that schools with both low SES mix and low average SES are very different from schools with low SES mix and high average SES. In order to accommodate this situation,
researchers would need to include interaction terms for SES mix and average SES, a practice that we did not observe in the literature on this topic. 2. See OECD (2001) for a full description of this item.
3. In fact, our dummy variables are based on the proportion of students with age-grade gap. As the main reason for the age-grade gap is repeating, we take these variables as proxy of repeating. However, we know that entering into school late is also a facto r that has some impact in age-grade gap in some countries.
4. In our final 3-level HLM model displayed in Table 5 we did not include school social mix at level-2. However, we investigate an alternative model where at level-2 we included 2 dummy coded variables describing school with high and medium social mix, both compared to low social mix schools.
Results suggested that school average achievement was lower in school where social mix was high (versus low), but medium leveI social mix was unrelated to average achievement. Because the level-3 results displayed in Table 5 were unchanged, we decided to present results from the more parsimonious model shown in Table 5.
5. For graphing, we assumed that low and high SES mix correspond to the 10th and 90th percentiles. Analogously, we assumed that low, medium, and high SES within schools corresponds to the 10th, 50th, and 90th percentiles.
6. Holding the value of alI model constant, the effect adding the main effect of involving social mix:
other variables included in the hierarchical of social mix on achievement can be written by social mix to the cross-level interaction term
This can be re-wri tten as: social_mixk (Yo03 + Y I02 SES ijk ) .
If social mix assumes a positive value, the effect on achievement will be positive whenever the expression in parenthesis is positive. Given that both
Y
003 andYI
02 are positive, the effect will be positive for alIstudents whose SES value is posi ti ve and for alI students below average SES provided that SESijk > - (Y003 / YI02). Applying the values fitted for
the mentioned coefficients and considering the measures of SES available in the dataset, we verified that high school social mix is positive for every student.
National Educational Policies, Quality and Equity 20
8. Holding ェセィ・@ value of all other variables included in the HLM model constant .. the effect of average expenditure per student on achievement can be computed by adding the main effect of expenditure to the cross-level ゥョセ・イ。」エゥッョ@ term for expenditure:
Which may be re-written as:
References
Alexander, K., Entwisle, D.R., and Dauber, S.L. 1994. On the success of failure: a reassessment of retention in the primary years. New York. Cambridge University Press. 1994.
Allenworth, E. 2004. Ending social promotion in Chicago: Dropouts rates in Chicago after the implementation of the eighth-grade gate.
Chicago:, Consortium of Chicago School Research.
Boyle, R.P. 1966. The effects of high school on students aspirations. American Journal of Sociology, 21:628-39.
Coleman, J.S., Campbell, E., Hobson, C., McPartland, J., Mood, A., Weinfeld, F. and York, R. 1966. Equality of educational opportunity. Washington: U.S. Government Printing Office.
Corten, R. and Dronkers, J. (2006). School achievement of pupils from the lower strata in public, private government-dependent and private government-independent schools: A cross-national test of the Coleman-Hoffer thesis 1.Educational Research & Evaluation, セHRIZ@ 179-208. Fertig, M. and Wright, R.E. (2005). School quality, educational attainment
and aggregation bias. Economics Letters, セHQIZ@ 109-114.
Gamoran, A. 1987. The stratification of high school learning opportunities. Sociology of Education, 60:135-155.
Gomes-Neto, J.B. and Hanushek, repetition: Evidence from Change, il(l) :117- 49.
E.A. 1994. Causes and consequences of grade Brazil. Economic Development and Cultural
Gorard, S and Smith, E (2004) An international comparison of equity in education systems. Comparative Education,iQ(l), 15-28.
Grissom, J.B. and Shepard, L.A. 1989. Repeating and dropping out of school. In L.A. Shepard and M.L. Smith (Eds.). Flunking grades: research and policies on retention. London: Falmer Press.
Henderson, V., Mieszkowski, P. and Sauvageau, Y. 1978. Peer group effects and educational production functions. Journal of Public Economics, 10:97-106.
Holmes, C.T. and Mathews, K.M. 1984. The effects of non-promotion on elementary and junior high school pupils: A meta-analysis. Review of Educational Research, 2!(2) :225-236.
Jackson, G.B. 1975. The research evidence of the effects of grade retention. Review of Educational Research, セZVQSMSUN@
Jones, L.V., Davenport, E.C., Bryson, A., Bekhuis, T., and Zwick, R. 1986. Mathematics and science test scores as related to courses taken in high school and other factors. Journal of Educational Measurement, セZQYWM 208.
National Educational Policies, Quality and Equity 22
37-60.
Lee, V.E. and Bryk, A.S. 1988. Curriculum tracking as mediating the social distribution of high school achievement. Sociology of Education, §l:78-94.
Lee, V.E., A.S. Bryk, and J.B. Smith 1993. The organization of effective high schools. In L. Darling-Hammond (Ed.). Review of Research in Education. 12.:171-268. Washington, DC: American Educational Research Association.
Lee, V.E., Surkam, D.T., Chow-Hoy, tセL@ Smerdon, B.A. and Geverdt, D. 1988.
High school curriculum structure: Effects on coursetaking and
achievement in mathematics for high school graduates. An examination of data from the National Education Longitudinal Study of 1988.
Washington DC: National Center for Education Statistics, Working Paper No. 98-09.
Levesque, K., Lauen, D., Teitelbaum, P., Alt, M. and Librera, S. 2000. Vocational education in the United States: Toward the year 2000. Washington DC: National Center for Education Statistics. Working Paper No 2000-029.
Marks, G.N. (2006). Are between- and within-school differences in student performance largely due to socio-economic background? Evidence from thirty countries. Educational Research, セHQIZ@ 21-40.
Marks, G.N., Cresswell, J. and Ainley, J. (2006). Explaining socioeconomic inequalities in student achievement: The role of home and school factors. Educational Research & Evaluation, セHRIZ@ 105-128.
Nash, R (2003a). Inequality/difference in education: is a real explanation of primary and secondary effects possible? British Journal of Sociology,
2i(4): 433-451.
Nash, R (2003b). Is the school composition effect real? A discussion with evidence from the UK PISA data. School Effectiveness and School Improvement, 14(4): 441-457.
Natriello, G. et aI. 1989. On the right track? Curriculum and academic achievement. Sociology of Education, セHRI@ :109-18.
OECD 2002. Learning and skills for life: First results of PISA 2000. Paris: Author.
Raudenbush, S. and Bryk, A.S. 2002. Hierarchical linear models (2nd Ed.). Newbury Park: Sage.
Roderick, M. 1994. Retention and school grade drop out: Investigating the association. American Educational Research Journal, 1l(4): 729-59.
Roderick, M., Bryk, A.S., Jacob, B., Easton, J.Q., Allenworth, E. 1999. Ending social promotion in Chicago: Results from the first two years. Chicago: Consortium of Chicago School Research. Roderick, M., Nagaoka, J.B. 2004. Ending social promotion in Chicago: The
..
:
Rutter, M., Maughan, B., Mortimore, P. and Ouston, J. 1979. Fifteen thousand hours. London: Open Books .
Shavit, Y. and Mu1ler, M. (Ed.) 1998. From school to work: A comparative study of educational qualifications and occupational destinations. Oxford University Press, London.
Summer, A.A. and Wolfe, B.L. 1977. Do schools make a difference? American Economic Review, 67:639-52.
Thorpe, G. (2006). Multilevel analysis of PISA 2000 reading results for the United Kingdom using pupil scale variables. School Effectiveness and School Improvement,
l2
(1): 33-62.Van Langen, A., Bosker, R. and Dekkers, H. (2006). Exploring cross-national differences in gender gaps in education. Educational Research & Evaluation, セHRIL@ 155-177.
Vandenberghe, V and Robin, S (2004). Evaluating the effectiveness of private education across countries: a comparison of methods. Labour Economics,
1:1.
(4): 487-506.Willms, D. 1986. Social class segregation and its relationships to pupils' examination results in Scotland. American
Sociological Review, 2!:224-41.
Willms, Douglas (2006). Variation in socioeconomic gradients among cantons in French- and Italian-speaking Switzerland: Findings from the OECD PISA. Educational Research & Evaluation, セHRIZ@ 129-154.
National Educational Policies, Quality and Equity 24
Table 1: Descriptive Statistics for All Variables
Name of Variable
Achi evemen ': SES
School SES
High Enrol:ment in Vocational
Education
School sッ」セ。ャ@ Mix
Medium Rate of
Repetition+-High Rate of Repetition+
Average Expenditure per student:
Variable Description
Student Variables
Reading a」ィゥ・セ・ュ・ョエL@ 15 years old
Student Socioeconomic Status
School Variables
School Average SES
Country Variables
Dummy variable coded 1 if percentage of students enrolled in vocational or technical programs in upper secondary is greater than 50%.
Aggregate from school leveI of the standard deviation of student SES. Dummy variable, coded 1 if country's percentage of students below their age-appropriate grade is between 10% and 20%; O otherwise.
Dummy variable, coded 1 if country's percentage of students below their age-appropriate grade is between 40% and 50%; O otherwise.
Logarithm of country's expenditure per student in 1998 for all secondary education (general, technical, vocational), converted into American do1lars by the purchased power parity method.
Mean
486.2 O
O
.49
O
.28
.08
8.3
Standard deviation
105.1
1
1
1
0.7
•
:
Table 2: Thirty-nine PISA Countries Included in Our Analysis and Their Ranking on key variables
Country(C)
Finland Netherlands Ireland New Zealand Australia
Hong Kong, China (bJ
Japan Cana da U.K.
South Korea Sweden Belgium Iceland Norway France Austria Germany Denmark
Czech Republic U.S.A. Switzerland Spain rtaly Hungary Portugal Greece Poland
Russian Fed (bJ
Latvia (bJ
Israel (bJ
Romania (bJ
Luxembourg Thailand (bJ
México Argentina (bJ
Chile (bJ
Brazil (bJ
Indonesia (bJ
Peru (bJ
Average Reading Achievement (by Tertile) la)
High High High High High High High High High High High High High Medium Medium Medium Medium Medium Medium Medium Medium Medium Medium Medium Medium Medium Low Low Low Low Low Low Low Low Low Low Low Low Low Repeating rate Low Low Low Low Low Medium Low Low Low Low Low Low Low Low Low Low Medium Low Low Low Medium Low Medium Low Medium Low Low Low Medium Low Medium Med-ium Low Medium Medium Medium High High High
SES mix (by Tertile) High High High High Medium Medium High High High Medium High Medium High High Low Medium Medium High Medium Medium Medium Low Medium Low Medium Medium Low Medium High Low Low High Low Low Low Low Low Low Low
Expendi t ure per Student (by Tertile)
Medium High High Medium High Medium Medium High Medium Medium High High High High Medium High Medium High Low High High Medium Medium Low Medium Medium Low Low Low Medium Low High Low Low Low Low Low Low Low
High Enrollment in Voca tional
Education Yes Yes No No Yes No No No Yes No No Yes No Yes Yes Yes Yes Yes Yes No Yes No Yes Yes No No Yes No Yes No Yes Yes No No Yes No No No No
(a) Countries are listed in order of their average scores on the PISA reading achievement.
(b) Non-OECD countries included in PISA study.
National Educational Policies, Quality and Equity 26
Table 3: The Within-School (Level-l) Model
Variables Intercept
Student SES
Random Effects
Level -セゥ@
Intercept, UOOk
Student SES Slope,
u
JOkLevel -::
Intercept,
r
OjkStudent SES Slope, セヲエ@
*** p < 0.001
Coefficients 476.8***
17.5***
Variance
2284.7*** 99.9***
2965.2*** 189.2***
5031.0***
•
•
:
Table 4: The Between School (Level-2) Model
Variab1es Intercept
Schoo1 Average SES Student SES/Achivement slope
Random Effects
LeveI -3
Intercept, UOOk
Schoo1 SES Slope, U 01k Student SES Slope, U 10k
LeveI -2
Intercept, rOjk
Student SES Slope, r1jk
*** p < 0.001
Coefficients 476.8***
99.9*** 17.5***
Variance
2289.4***
1194.9*** 99.7***
1139.9***
National Educational Policies, Quality and Equity 28
Table 5: The Between-Countries (Level-3) Model
Variab1es
Average Achievement
Intercept
Y
OO')Average Expendi ture per student
Y
OOIHigh Enro11ment in Vocationa1 Education
Y
002Schoo1 Socié1 SES Mix Yo03
Medium Rate of Repetition Y0 04 High Rate of Repeti tion
Y
005Stuaent SES/Achievement Slope
Intercept YIOC.
Average Expendi ture per student
Y
IOISES mix
Y
I02School Average SES/Achievement slope
Intercept
Y
OIC'Average Expenditure per StudentYol1
High Enro11ment in Vocationa1 Education
Y
Ol2Random Effects
Intercept, U OOk
Schoo1 Averó.ge SES/Achievement Slope, U Olk Student SESIAchievement Slope, UIOk
*** p < 0.001; * P < 0.05
Coefficients
476.8*** 16.3*** -3.8
17.1*** -26.3*** -81.5***
17.5*** 6.6*** 2.5*
100.1*** 12.9* 25.2***
Variance
397.3*** 836.4*** 55.9***
•
•
•
:
•
!
Figure 1: The Net Effect of school social Mix in countries on Student Reading Achievement
520
....
t: 500GI
E
GI 480
> .!!!
.r:. 460
() cC
セ@ 440
:s
raGI 420
Q:
400
Low High
Social Mix
Student SES
National Educational Policies, Quality and Equity 30
Figure 2: The Net Effect of Countries' Emphasis on Vocational Education on
Reading Achievement
600
-
570c:
CI) 540
E
CI) 510
>
Nセ@ 480
.:::
C)
セ@ 450
Cl
.: 420 KMMNLNセセ@
"C
セ@ 390
o:::
360330
Low « 0.50) High (> 0.50)
Enrollment in Vocational Secondary
School Average SES
ILlLow • Medium DHigh
"
,
•
,
:
Quality and Equality in Brazilian Secondary Schools:
A
Multilevel Cross-National School Effects Study
Valerie E. Lee University of Michigan, USA
velee@umich.edu
Creso Franco
PontificaI Catholic University of Rio de Janeiro, Brazil creso@edu.puc-rio.br
Angela Albemaz
Brazilian National Bank for Economic and Social Development angela@bndes.gov.br
Second Revision August 30, 2006
FUNDAÇÃO GETULIO VARGAS
BIBLIOTECA
ER DEVOLVIDO À BIBLIOTECA
ESTE VOLUME NA dァPMセmsa@ DATA MARCADA
,
, ' Mャャuyセ@