ACPD
10, 19939–19980, 2010Measurements of black carbon light
absorption enhancement
T. W. Chan et al.
Title Page
Abstract Introduction
Conclusions References
Tables Figures
◭ ◮
◭ ◮
Back Close
Full Screen / Esc
Printer-friendly Version Interactive Discussion
Discussion
P
a
per
|
Dis
cussion
P
a
per
|
Discussion
P
a
per
|
Discussio
n
P
a
per
|
Atmos. Chem. Phys. Discuss., 10, 19939–19980, 2010 www.atmos-chem-phys-discuss.net/10/19939/2010/ doi:10.5194/acpd-10-19939-2010
© Author(s) 2010. CC Attribution 3.0 License.
Atmospheric Chemistry and Physics Discussions
This discussion paper is/has been under review for the journal Atmospheric Chemistry and Physics (ACP). Please refer to the corresponding final paper in ACP if available.
Time-resolved measurements of black
carbon light absorption enhancement in
urban and near-urban locations of
Southern Ontario, Canada
T. W. Chan1, J. R. Brook2, G. J. Smallwood3, and G. Lu2
1
ASTB/STB Environment Canada, 335 River Road South, Ottawa, Ontario, K1V 0H3, Canada
2
ASTB/STB Environment Canada, 4905 Dufferin Street, Toronto, Ontario, M3H 5T4, Canada
3
National Research Council Canada, 1200 Montreal Road, Ottawa, Ontario, K1A 0R6, Canada
Received: 13 August 2010 – Accepted: 16 August 2010 – Published: 24 August 2010 Correspondence to: T. W. Chan ([email protected])
ACPD
10, 19939–19980, 2010Measurements of black carbon light
absorption enhancement
T. W. Chan et al.
Title Page
Abstract Introduction
Conclusions References
Tables Figures
◭ ◮
◭ ◮
Back Close
Full Screen / Esc
Printer-friendly Version Interactive Discussion
Discussion
P
a
per
|
Dis
cussion
P
a
per
|
Discussion
P
a
per
|
Discussio
n
P
a
per
|
Abstract
In this study a photoacoustic spectrometer (PA), a laser-induced incandescence in-strument system (LII) and an aerosol mass spectrometer were operated in parallel for in situ measurements of black carbon (BC) light absorption enhancement. Results of a thermodenuder experiment using ambient particles in Toronto are presented first to 5
show that LII measurements of BC are not influenced by particle coating while the PA response is enhanced and also that the nature of this enhancement is influenced by particle morphology. Comparisons of ambient PA and LII measurements at four diff er-ent locations (suburban Toronto; a street canyon with heavy diesel bus traffic in Ottawa; adjacent to a commuter highway in Ottawa and; regional background air in and around 10
Windsor, Ontario), show that the different meteorological conditions and atmospheric processes result in different particle light absorption enhancement and hence the spe-cific attenuation coefficient (SAC). Depending upon location of measurement and the BC spherule diameter (primary particle size – PPS) measurement from the LII, the SAC varies from 2.6±0.04 to 22.5±0.7 m2g−1. Observations from this study also show the 15
active surface area of the BC aggregate, inferred from PPS, is an important parameter for inferring the degree of particle collapse of a BC particle. The predictability of the overall BC light absorption enhancement in the atmosphere depends not only on the coating mass but also on the source of the BC and on our ability to predict or measure the change in particle morphology as particles evolve.
20
1 Introduction
Black carbon (BC) particles are released into the atmosphere from incomplete com-bustion of fossil and biofuels, and biomass burning (Horvath, 1993). Based on different definitions and methods of detection, BC is sometimes referred to as “refractory car-bon” or “elemental carcar-bon”, representing the solid carbon fraction in the particles with 25
ACPD
10, 19939–19980, 2010Measurements of black carbon light
absorption enhancement
T. W. Chan et al.
Title Page
Abstract Introduction
Conclusions References
Tables Figures
◭ ◮
◭ ◮
Back Close
Full Screen / Esc
Printer-friendly Version Interactive Discussion
Discussion
P
a
per
|
Dis
cussion
P
a
per
|
Discussion
P
a
per
|
Discussio
n
P
a
per
|
(Huntzicker et al., 1982; Turpin et al., 1990; Chow et al., 2001). When BC is measured based on light absorption spectroscopy techniques, such as an Aethalometer or a par-ticle soot absorption photometer (PSAP), it is usually referred to as “light absorbing carbon” (Bond and Bergstrom, 2006; Bond et al., 1999). In some cases, BC is also commonly interchanged with other terms such as “soot” or “carbon black”, while the 5
true definition of BC is still subject to debate (Bond and Bergstrom, 2006). Regard-less of the definition, combustion generated BC particles are not emitted as pure BC. Recent research of vehicular emission shows that the emitted particles often contain a mixture of substances, such as black carbon, volatile organic compounds, unburned fuel, unburned oil, sulphate, and metal ash (Burtscher, 2005; Kittelson, 1998; Park 10
et al., 2003). In this work, BC particle is defined as the solid fraction of the combustion generated particle that absorbs a significant amount of radiation from a laser beam.
Atmospheric BC particles are an important global warming agent with radiative forc-ing similar in magnitude to carbon dioxide (Bond and Sun, 2005). BC alters the radia-tion budget of the Earth by absorbing incoming radiaradia-tion from space or radiaradia-tion emit-15
ted from the Earth’s surface and then re-emitting it locally as heat energy thus warming the atmosphere. To accurately estimate and forecast the global warming effect due to BC knowledge on the light absorption properties of BC and an understanding how condensable materials that typically coat BC can affect the particle light absorption and thermal emission is required.
20
The effect on light absorption by atmospheric BC particles due to the presence of non-absorbing materials is complicated. A general increase in particle light absorption is observed with increased quantities of coating materials on the BC particles but the amount of absorption enhancement depends on factors such as refractive index of the coating materials, the size and location of the BC core, and also the wavelength of the 25
ACPD
10, 19939–19980, 2010Measurements of black carbon light
absorption enhancement
T. W. Chan et al.
Title Page
Abstract Introduction
Conclusions References
Tables Figures
◭ ◮
◭ ◮
Back Close
Full Screen / Esc
Printer-friendly Version Interactive Discussion
Discussion
P
a
per
|
Dis
cussion
P
a
per
|
Discussion
P
a
per
|
Discussio
n
P
a
per
|
et al., 1991; Liousse et al., 1993) due to natural atmospheric processing, such as cloud processing and/or condensation of organic and inorganic materials onto BC particles (Ramachandran and Reist, 1995; Huang et al., 1994; Hallett et al., 1989; Johnson et al., 2005). The collapse of the BC structure was believed to be one explanation for the decreased particle light absorption observed at some ambient measurement 5
locations (Lewis et al., 2009; Liousse et al., 1993; Liu et al., 2008; Chan et al., 2010). Although the BC morphology and coating issues may appear as independent phenom-ena, they are closely linked with respect to atmospheric BC particles.
A few studies were conducted in the past using laboratory generated BC particles coated with various materials in an attempt to understand the BC coating issue. Xue 10
et al. (2009) coated BC particles generated from propane combustion with glutaric acid and succinic acid and then exposed the coated particles to a range of relative humidities. Using a differential mobility analyzer-aerosol particle mass analyzer (DMA-APM) system to measure the morphology of the BC particles, Xue et al. observed that the enhancement in the optical properties of BC due to coating material depended 15
strongly on the ability of the coating to alter the morphology of the BC particles. Gangl et al. (2008) generated BC particles by spark discharge and coated the particles with the non-absorbing carnauba wax. An increase in absorption of up to a factor of 1.8 was observed. Coating graphite particles with oleic acid and glycerol, Shiraiwa et al. (2010) observed an enhancement in light absorption of 1.3 to 2 depending on the amount of 20
coating present.
Although laboratory studies are useful, the challenge is to translate the results to the behaviour of BC when it is present and processed in the atmosphere. For this reason, some past studies have attempted to tackle the BC coating and morphology issue using ambient aerosols. The advantage of these kinds of studies is that the coat-25
ACPD
10, 19939–19980, 2010Measurements of black carbon light
absorption enhancement
T. W. Chan et al.
Title Page
Abstract Introduction
Conclusions References
Tables Figures
◭ ◮
◭ ◮
Back Close
Full Screen / Esc
Printer-friendly Version Interactive Discussion
Discussion
P
a
per
|
Dis
cussion
P
a
per
|
Discussion
P
a
per
|
Discussio
n
P
a
per
|
a thermodenuder to remove the particle coating on ambient particles that had diff er-ent histories based on back trajectories analysis and then estimated their BC mass absorption cross-section (MAC). The MAC results for particles with and without the coating removed were not statistically different due to the large variations of the am-bient measurements. Also, the authors suggested that the amam-bient particles present 5
during the study were too large or heavily coated such that the amount of coating re-moved in the thermodenuder was insufficient for producing a measurable decrease in the absorption enhancement. Chan et al. (2010) observed that the specific attenuation coefficient (SAC) of ambient BC particles at a rural site was independent or decreasing with increasing particle coating mass or relative oxygenated organic mass. They sug-10
gested that the structural collapse of BC particles over time was one of the factors that led to a decrease in particle light absorption. The inconsistent observations between the laboratory and field measurements suggest that the atmospheric processing of BC particles and its relation to the light absorption is not well known.
With the objective to improve the understanding of the effect of coatings and mor-15
phology on fine BC particles, this study was conducted with ambient particles, using relatively fast time response instruments, a thermodenuder, and strategically selected measurement locations before, during and after an intensive field study, referred to as “The Border Air Quality and Meteorology Study” (BAQS-Met; Levy et al., 2010), which occurred in Southern Ontario, Canada, in the summer of 2007. There are two major 20
components in this work. The first component is a thermodenuder experiment con-ducted at one location in the north part of the city of Toronto after the main BAQS-Met period. This was undertaken to characterize how two instruments, namely a Droplet Measurement Technologies (DMT) photoacoustic spectrometer (PA) and a high sen-sitivity laser-induced incandescence (LII) instrument, respond to ambient BC particles 25
with different amounts of total particle coating mass, as measured by an Aerodyne quadrupole Aerosol Mass Spectrometer (AMS).
ACPD
10, 19939–19980, 2010Measurements of black carbon light
absorption enhancement
T. W. Chan et al.
Title Page
Abstract Introduction
Conclusions References
Tables Figures
◭ ◮
◭ ◮
Back Close
Full Screen / Esc
Printer-friendly Version Interactive Discussion
Discussion
P
a
per
|
Dis
cussion
P
a
per
|
Discussion
P
a
per
|
Discussio
n
P
a
per
|
minutes bypassing the thermodenuder. It was hypothesized that this unique combi-nation of instrumentation would offer a valuable opportunity for studying BC particles. This is because of the different BC measurement principles for LII and PA. The former was expected to be less affected by coatings, thus only responding to BC by detecting the thermal emission produced by super-heated refractory fine carbon particles (e.g., 5
Snelling et al., 2005; Moteki and Kondo, 2007). The light absorption (Babs) measure-ments by PA were, however, observed to be sensitive to coatings (e.g., Knox et al., 2009). This is likely due to the lensing effect of the coatings and the lower laser power involved in producing the signal detected in the PA, which is derived from pressure waves produced by thermal heating of the boundary layer surrounding the particles. 10
A possible secondary source of the pressure waves in the PA could arise from evap-oration of coating materials on the particles. However, previous studies, which have mainly focused on the impact of water evaporation on the photoacoustic signal found that in most atmospheric applications the impact is generally small (Raspet et al., 2003; Raspet et al., 1999). Furthermore, Murphy (2009) found that any impact is reduced as 15
the thickness of the organic coating increases. Thus, the coating evaporation impact was not investigated in this study and is assumed not to be the major factor affecting the variations in light absorption measured from the PA as a function of coating. While the lensing effect may increase the total absorption in LII measurements, the technique of Snelling et al. (2005) will automatically compensate for this, resulting in an unaffected 20
measurement of BC volume and mass.
In the second component of our experiment, the instruments were deployed to con-trasting locations to measure the ambient BC particles without thermaldenuder alter-ations. These measurements were undertaken to determine if it is possible to observe in situ urban to regional scale variations in the coating effect on BC light absorption 25
ACPD
10, 19939–19980, 2010Measurements of black carbon light
absorption enhancement
T. W. Chan et al.
Title Page
Abstract Introduction
Conclusions References
Tables Figures
◭ ◮
◭ ◮
Back Close
Full Screen / Esc
Printer-friendly Version Interactive Discussion
Discussion
P
a
per
|
Dis
cussion
P
a
per
|
Discussion
P
a
per
|
Discussio
n
P
a
per
|
measurements were collected just before the main BAQS-Met study period in an ur-ban street canyon with heavy diesel bus traffic and at a location adjacent to a highway, both of which were in Ottawa, Ontario. During BAQS-Met the mobile lab was deployed to an urban site in West Windsor, Ontario, and to rural locations in Southwestern On-tario. Through these strategic deployments our objective was to quantify the range of 5
variability in the coating enhancement in BC light absorption in urban and near-urban situations and to test the hypothesis that atmospheric changes in particle morphology are an important additional factor to alter the BC light absorption enhancement caused by particle coating, particularly for fresh BC particles.
2 Sampling and instrumentation
10
2.1 Thermodenuder experiment
From 15–21 August 2007, ambient measurements were taken simultaneously by the three instruments at a suburban/commercial location located about 17 km north of downtown Toronto, Ontario. The main source of anthropogenic emissions in this area is from vehicles along a busy four lane road 150 m west of the measurement site. Dur-15
ing morning and evening, rush hour traffic along this road is often “stop and go”, but is dominated by gasoline vehicles, while during the day heavy and light duty diesel trucks also use this road frequently.
The instruments were housed inside a mobile laboratory, also known as the Cana-dian Regional and Urban Investigation System for Environment Research (CRUISER), 20
which was connected to an external source of power. Ambient air was drawn into CRUISER and to the entrance of an automated sampling system at 16.7 L min−1 through a 3.18 cm OD stainless steel sampling tube of 1.88 m in length. Inside CRUISER this tube is surrounded by a 15.24 cm PVC pipe containing an external sheath air flow drawn from outside, which serves to keep the sample air containing 25
ACPD
10, 19939–19980, 2010Measurements of black carbon light
absorption enhancement
T. W. Chan et al.
Title Page
Abstract Introduction
Conclusions References
Tables Figures
◭ ◮
◭ ◮
Back Close
Full Screen / Esc
Printer-friendly Version Interactive Discussion
Discussion
P
a
per
|
Dis
cussion
P
a
per
|
Discussion
P
a
per
|
Discussio
n
P
a
per
|
and evaporation in winter. This inlet, which is 3.6 m above ground (extending out of the roof of CRUISER) was equipped with a 2.5 micron sharp cut cyclone.
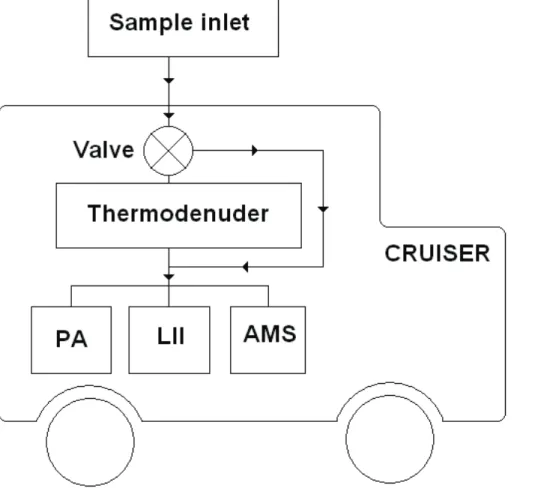
The automatic sampling system (Fig. 1) draws air from the base of the inlet system. Every five minutes the solenoid value changed position allowing the ambient sample to either pass through or bypass the thermodenuder (Dekati model ELA-111). When 5
the ambient particles passed through the thermodenuder (∼300◦C), a large fraction of the non-refractory components in the particles were evaporated and removed. The denuded or non-denuded samples were then drawn into the PA (1.0 L min−1; 2 m of
0.64 cm O.D. mixed stainless steel and silicon conductive tubing) and LII (8.0 L min−1; 4 m of 0.64 cm O.D. silicon conductive tubing) for measuring light absorption and in-10
ferred BC mass concentration and the AMS (83 cm3min−1; 0.5 m of 0.64 cm O.D.
sil-icon conductive tubing) for measuring the mass concentrations of the non-refractory components in the ambient particles including sulphate, nitrate, organic matter, and ammonium.
2.2 Ottawa highway and urban street canyon
15
The Ottawa measurements consist of a small data set that was acquired with CRUISER running on generator power at two different locations in Ottawa: 1) an area located near a local highway (near the intersection between HWY 417 and HWY 174) with sampling during the afternoon rush hour period and 2) a location in the Ottawa downtown area that is surrounded by tall buildings (Albert Street and Elgin Street) with sampling during 20
the morning rush hour period when there is constant diesel bus traffic bringing com-muters into the downtown core. The two locations were chosen to study how the PA and LII BC signals and their ratios change with different amounts of particle coating mass with the emitted particles having limited and some degree of atmospheric pro-cessing, at the street canyon and highway locations, respectively. No thermodenuder 25
ACPD
10, 19939–19980, 2010Measurements of black carbon light
absorption enhancement
T. W. Chan et al.
Title Page
Abstract Introduction
Conclusions References
Tables Figures
◭ ◮
◭ ◮
Back Close
Full Screen / Esc
Printer-friendly Version Interactive Discussion
Discussion
P
a
per
|
Dis
cussion
P
a
per
|
Discussion
P
a
per
|
Discussio
n
P
a
per
|
2.3 BAQS-Met field study
The BAQS-Met field study was part of the second component of this study, during which CRUISER was deployed to various locations inside and outside the city of Wind-sor. There are no major emission sources near the sampling locations. However, there were transported emissions from the Detroit-Windsor area and other regional emission 5
sources to the sampling locations. When it was inside the city, CRUISER was parked the West Windsor Water Pollution Control Plant for several days for continuous mea-surements at which time it was connected to an external source of power. From time to time, CRUISER, running on generator power, was driven to different locations out-side, but within approximately 50 km of the Detroit-Windsor area. CRUISER stopped 10
for periods ranging from about 15 min to 1 h at locations expected to be experiencing different air masses affected by local lake-induced circulation patterns, which could po-tentially alter the extent of air mass processing within relatively short distances. During the BAQS-Met field study, the PA and LII were used to provide particle light absorption coefficient and inferred BC mass measurements while the AMS was used to measure 15
the non-refractory component in the particles at the same time. The thermodenuder was not used during the BAQS-Met study as the goal was to observe changes in the light absorption properties induced by local to regional scale atmospheric processes.
2.4 Black carbon measurement
In this study, a Droplet Measurement Technology photoacoustic spectrometer (PA) and 20
a high sensitivity laser-induced incandescence (LII), developed by the National Re-search Council Canada (NRC), were used for measuring BC in the ambient particles. The PA and LII are both in situ instruments capable of measuring BC in the particle directly from the airstream. PA does not measure BC mass directly but measures the particle light absorption coefficient (Babs), which is proportional to the BC mass in the 25
ACPD
10, 19939–19980, 2010Measurements of black carbon light
absorption enhancement
T. W. Chan et al.
Title Page
Abstract Introduction
Conclusions References
Tables Figures
◭ ◮
◭ ◮
Back Close
Full Screen / Esc
Printer-friendly Version Interactive Discussion
Discussion
P
a
per
|
Dis
cussion
P
a
per
|
Discussion
P
a
per
|
Discussio
n
P
a
per
|
2.4.1 Photoacoustic spectrometer (PA)
In the PA, the laser beam (2 W, 781 nm) is modulated at a rate of 1500 Hz as it passes through the particle stream inside the PA resonator. This causes the surrounding air to expand and contract at the modulated frequency. The pressure disturbance (i.e., acoustic signal) is amplified within the photoacoustic resonator and then measured by 5
a microphone. The acoustic signal is proportional to the black carbon mass concentra-tion and reported as absorpconcentra-tion coefficient (Arnott et al., 1999; Faxvog and Roessler, 1982; Lack et al., 2006). Dividing the absorption coefficient by the specific attenuation coefficient (SAC) gives an estimate of the BC mass concentration. The laser light scat-tered by the particles that are present inside the resonator is detected and measured 10
by a photo multiplier tube (PMT) which is mounted on the middle sideway of the res-onator. The signal is processed and reported as the particle light scattering coefficient (Bscat).
2.4.2 Laser-induced incandescence instrument (LII)
In the case for the LII, BC is heated by a high energy short pulse laser (200 mJ/pulse, 15
7 ns FWHM duration, 1064 nm wavelength). The laser energy is absorbed by the BC component in the particles causing a rapid increase in temperature. During the heat-ing process, temperature of the BC component in the particle approaches ∼4000 K, just below the sublimation temperature for BC. At these temperatures the particles incandesce (as a form of near-blackbody emission) with sufficient intensity to be de-20
tected. At the end of the laser pulse, heating ends and the BC particles cool rapidly, over a period of approximately one microsecond, at which point the incandescence signal is no longer detectable. The energy loss to the surrounding air is proportional to the active surface area of the BC particles. The NRC system is a high sensitivity variant of the auto-compensating LII (AC-LII) which employs two color pyrometry (at 25
ACPD
10, 19939–19980, 2010Measurements of black carbon light
absorption enhancement
T. W. Chan et al.
Title Page
Abstract Introduction
Conclusions References
Tables Figures
◭ ◮
◭ ◮
Back Close
Full Screen / Esc
Printer-friendly Version Interactive Discussion
Discussion
P
a
per
|
Dis
cussion
P
a
per
|
Discussion
P
a
per
|
Discussio
n
P
a
per
|
losses to the surrounding air, the BC concentration as well as the spherule diameter (primary particle size – PPS) can be determined, respectively (Mewes and Seitzman, 1997; Snelling et al., 1998, 2000, 2005; Wainner and Seitzman, 1999; Bryce et al., 2000; Schulz et al., 2006). The high sensitivity LII instrument has a BC measurement limit of 15 ng m−3 (Smallwood, 2009). The BC concentration is reported as a volume 5
fraction (BC volume to air volume in the sample or soot volume fraction – SVF) and can be converted to a mass concentration through multiplying by the BC material den-sity, 1.9±0.1 g cm−3 (Smallwood, 2009). Although the NRC AC-LII acquires data at a rate of 20-Hz, both the PA and LII were operated at 1-min time resolution during all measurements used in this study.
10
2.5 Aerosol mass spectrometer
During this study, the non-refractory components in the aerosol were measured by an Aerodyne quadruple Aerosol Mass Spectrometer (AMS). Inside the AMS, particles are drawn from ambient condition through an aerodynamic lens to focus into a narrow beam, accelerated to specific aerodynamic velocities that are related to the vacuum 15
aerodynamic diameters of the particles. The particles impact on a resistively heated surface where all volatile and semi-volatile components are vaporized. Ionized by elec-tron impact, fragments are then detected by a quadrupole mass spectrometer at about 10−7Torr (Jayne et al., 2000; Jimenez et al., 2003; Allan et al., 2003). During this study, the AMS was operated in the mass and time of flight modes providing average 20
mass concentrations of the organics, sulphate, nitrate, and ammonium in the particles. The time resolution used for the AMS during the thermodenuder experiment was 1 min. For the Ottawa field measurements the time resolution was 5 min. For the BAQS-Met measurements, the time resolution was 2 and 5 min when measurements were taken at various locations away from the city and 10 or 15 min when CRUISER was parked 25
ACPD
10, 19939–19980, 2010Measurements of black carbon light
absorption enhancement
T. W. Chan et al.
Title Page
Abstract Introduction
Conclusions References
Tables Figures
◭ ◮
◭ ◮
Back Close
Full Screen / Esc
Printer-friendly Version Interactive Discussion
Discussion
P
a
per
|
Dis
cussion
P
a
per
|
Discussion
P
a
per
|
Discussio
n
P
a
per
|
3 Data interpretation
3.1 Signal enhancement due to particle coating
The objective of the thermodenuder experiment was to determine the extent to which particle coatings influence the signals from the PA and LII instruments. The thermode-nuder effectively removes semivolatile coatings thus maximizing the potential to detect 5
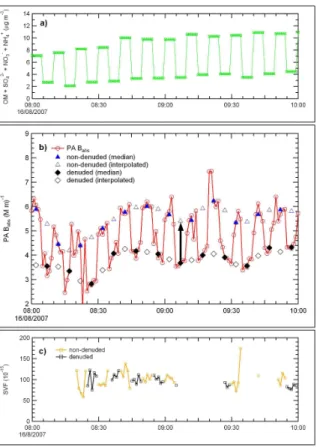
and characterize the signal changes. The determination of the signal enhancement is illustrated in Fig. 2. Figure 2a shows a time series subset of the total particle coat-ing mass, defined as the sum of organics matter, sulphate, nitrate, and ammonium mass concentration measured from the AMS. Every five minutes, particles passed through the thermodenuder causing a substantial decrease in particle coating mass in 10
the range of 4–8 µg m−3(60–70%). In Fig. 2b, the red circle trace shows theBabs mea-sured by the PA during the same time period as in Fig. 2a. The example demonstrates that there is a change in the PA instrument response, interpreted as a change in the
Babs, when the thermodenuder removed mass (i.e., coating material) from the parti-cles. In contrast, the SVF measured by the LII during the same period of time (Fig. 2c) 15
shows no distinct changes between the denuded (black squares) and non-denuded (orange circles) conditions.
In addition, due to continual changes in the ambient conditions (e.g., heterogeneity in the aerosol due to different parcels of air being measured minute by minute) there are additional variations inBabs beyond those imparted by the switching between denuded 20
and non-denuded conditions. Thus, to calculate a representative signal enhancement (i.e.,∆Babs), the median value during each five minute cycle was determined for the non-denuded and denuded (blue solid triangles and black solid diamonds in Fig. 2b) conditions, respectively. A cubic spline fit was then applied to these data points to es-timateBabs during the intervals when the sample was following the alternate flow path 25
ACPD
10, 19939–19980, 2010Measurements of black carbon light
absorption enhancement
T. W. Chan et al.
Title Page
Abstract Introduction
Conclusions References
Tables Figures
◭ ◮
◭ ◮
Back Close
Full Screen / Esc
Printer-friendly Version Interactive Discussion
Discussion
P
a
per
|
Dis
cussion
P
a
per
|
Discussion
P
a
per
|
Discussio
n
P
a
per
|
by the black arrow) is assumed to be the best estimate of the signal enhancement dur-ing each time period. The signal enhancement determined from this method is built on three main assumptions: 1) the signal enhancement depends linearly on the total amount of the particle coating mass on the BC, 2) all subcomponents in the coating mass that are detected by the AMS and removed in the denuder (e.g., organics, sul-5
phate, nitrate, etc.) contribute equally to the signal enhancement, and 3) particle loss due to diffusion and thermophoresis inside the thermodenuder are insignificant.
The choice of using the median value was made to minimize the impact caused by occasional fluctuations in the time-dependent data (as seen in Fig. 2b). Analyses (not included here) show that the value ofBabs estimated based on meanBabs are on 10
average 2% larger in magnitude than that determined using the median Babs due to random fluctuations. In comparison, the coating enhancement∆Babs estimated using the averageBabsis 15% smaller than that obtained using the medianBabs.
The same analysis is also performed on the measurement signals from LII (i.e., SVF) to yield∆SVF. As shown in Fig. 2c, the ∆SVF for the LII is significantly smaller than 15
∆Babsfrom the PA and in many cases a∆SVF is not observable. Discussion regarding the comparison in signal enhancements for the PA and LII is given in Sect. 4.2.1.
3.2 Total signal enhancement in an aerosol
In Sect. 3.1,∆Babs is determined by the difference inBabs between the non-denuded and denuded conditions. This value will be the true coating enhancement provided that 20
the thermodenuder removes the particle coating mass completely. Figure 3 shows the time series of the measured particle coating mass (black circles) for the non-denuded condition as determined by the AMS based on two assumptions. First, this measured mass is primarily contributed by the coating on a BC particle. Second, any liquid parti-cles that are also sampled have the same average composition as the coating materials 25
ACPD
10, 19939–19980, 2010Measurements of black carbon light
absorption enhancement
T. W. Chan et al.
Title Page
Abstract Introduction
Conclusions References
Tables Figures
◭ ◮
◭ ◮
Back Close
Full Screen / Esc
Printer-friendly Version Interactive Discussion
Discussion
P
a
per
|
Dis
cussion
P
a
per
|
Discussion
P
a
per
|
Discussio
n
P
a
per
|
each time the particle passes through the denuder; this is presented by the red trace in Fig. 3. During the course of the experiment, the thermodenuder removed close to or higher than 80% of the particle coating mass, but this varied among the 5 min sam-ples due to variations in nature of the ambient particles. As the particle coating mass was not completely removed, the coating enhancement determined from Sect. 3.1 is 5
only the apparent enhancement induced by the denuder removal. Thus, each 5 min measurement needs to be adjusted or normalized to the full effect of the coating be-fore comparing across all data points in order to undercover more subtle reasons for changes in the magnitude of the coating enhancement. Based on our assumptions (Sect. 3.1), we can state that,
10
∆Babs ∆Mcoating=
δBabs
δMcoating (1)
where∆Babs is the total signal enhancement caused by the total amount of particle coating mass ∆Mcoating and δBabs is a finite change in signal enhancement caused by a finite amount of particle coating massδcoating (i.e., the apparent changes mea-sured by the thermodenuder experiment). Rearranging Eq. (1) gives the total signal 15
enhancement in a particle as,
∆Babs= ∆Mcoating× δBabs
δMcoating=Mbypass×
Bnon-denuded−Bdenuded
Mnon-denuded−Mdenuded (2)
whereMnon-denuded and Mdenuded are the particle coating mass measured during the non-denuded and denuded conditions, respectively. Bnon-denuded and Bdenuded are the PA signal measured during the non-denuded and denuded conditions, respectively. 20
This technique is equally valid to other quantities, such as dry SVF.
ACPD
10, 19939–19980, 2010Measurements of black carbon light
absorption enhancement
T. W. Chan et al.
Title Page
Abstract Introduction
Conclusions References
Tables Figures
◭ ◮
◭ ◮
Back Close
Full Screen / Esc
Printer-friendly Version Interactive Discussion
Discussion
P
a
per
|
Dis
cussion
P
a
per
|
Discussion
P
a
per
|
Discussio
n
P
a
per
|
Sect. 4.3.2). This implies that the normalized PA:LII ratios discussed in Sect. 4 of this work represent an upper limit of the particle light absorption enhancement.
4 Results and discussion
4.1 Air quality comparison among different sites
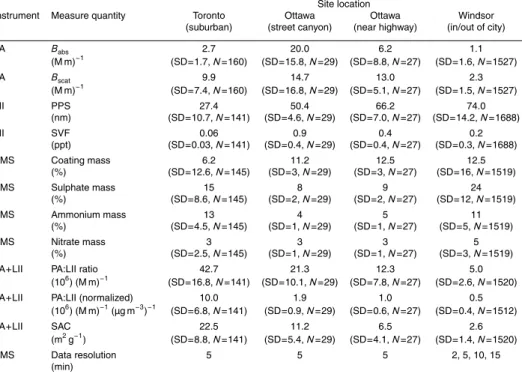
Table 1 summarizes the common parameters measured at the various sampling loca-5
tions; these include the particle light absorption (Babs) and scattering (Bscat) coefficients measured from the PA, the primary particle size (PPS) and soot volume fraction (SVF) determined from the LII, and the particle coating mass estimated from the AMS. Also included are the average breakdown percentages for the four major particle compo-sitions (organics, sulphate, ammonium, and nitrate) for the different data sets. A pa-10
rameter defined as the ratio of the particle light absorption to the soot volume fraction (PA:LII ratio) that is used as a surrogate to describe theBabs signal enhancement (see Sect. 4.3) is included. The same quantity that is normalized by the total particle coat-ing mass is also included. Table 1 also includes the calculated specific attenuation coefficient (SAC; calculated by Eq. (3) in Sect. 4.5) for various sites. All values in bold 15
represent the mean value. Standard deviation and the total number of valid data points are given in brackets. Finally, the data resolution indicates the AMS resolution which the PA and LII data were averaged to.
The highest BC concentrations, as inferred fromBabsand SVF were observed in the Ottawa street canyon. The location with the next highest levels was by the highway in 20
Ottawa. Interestingly,Babs was higher at the Toronto suburban site compared to the Windsor area, while the opposite pattern was observed for SVF. This may be related to the smaller PPS of the BC particles at Toronto, as will be discussed below. The light scattering and signal enhancement generally, but not always followed the same site to site pattern as the particle coating mass. The most obvious case is theBscatvalues for 25
ACPD
10, 19939–19980, 2010Measurements of black carbon light
absorption enhancement
T. W. Chan et al.
Title Page
Abstract Introduction
Conclusions References
Tables Figures
◭ ◮
◭ ◮
Back Close
Full Screen / Esc
Printer-friendly Version Interactive Discussion
Discussion
P
a
per
|
Dis
cussion
P
a
per
|
Discussion
P
a
per
|
Discussio
n
P
a
per
|
present on the particles. The particles observed at Windsor are aged and more likely approached a spherical-like structure. Since we do not have evidence to show that the measurements at Windsor were erroneous, we speculate that theBscat obtained from other sites may have been enhanced due to the non-spherical nature of the particles. As will be discussed in the next few sections, the particle morphology plays an equal 5
or potentially more important role in these cases in affecting the signal enhancement. As expected, the measurement locations and time periods included in this study experienced different meteorological conditions and atmospheric processes. This is reflected by the coating mass as well as the percentage of sulphate to the coating mass. The particles observed at Toronto are believed to be the least aged based on 10
the observed PPS values and the least amount of coating mass. Over time, more organic material and sulphate are condensed on the particles causing the relative or-ganic matter mass percentage to increase, followed by a slower increase in sulphate to total coating mass. Therefore, for the measurement periods reported here, the parti-cles observed at and around Windsor, which has the highest sulphate mass percentage 15
compared to other sites as well as the largest amount of coating materials, are believed to be the most aged.
4.2 Thermodenuder experiment
4.2.1 Signal enhancements due to particle coating mass
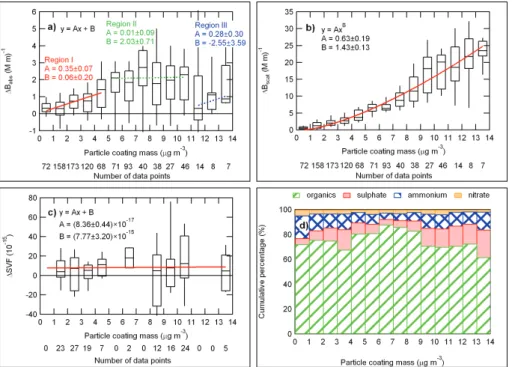
Figure 4a shows the variations in the total signal enhancement in particle light absorp-20
tion (∆Babs) measured by the PA as a function of the particle coating mass. The∆Babs
has been corrected using Eq. (2) to represent enhancement due to the total amount of the coating mass present on a particle. Each individual box represents the 25th, 50th, and 75th percentiles of the measurement values while the 10th and 90th percentiles are represented by the bottom and top whiskers, respectively. The total number of data 25
ACPD
10, 19939–19980, 2010Measurements of black carbon light
absorption enhancement
T. W. Chan et al.
Title Page
Abstract Introduction
Conclusions References
Tables Figures
◭ ◮
◭ ◮
Back Close
Full Screen / Esc
Printer-friendly Version Interactive Discussion
Discussion
P
a
per
|
Dis
cussion
P
a
per
|
Discussion
P
a
per
|
Discussio
n
P
a
per
|
and the magnitude of the enhancement is considerably larger when the particle coating mass is large.
During periods when particles contain a small amount of coating materials theBabs
for denuded and non-denuded conditions are similar in magnitude (small ∆Babs val-ues). In such situations fluctuations in BC concentration among 5 min periods be-5
comes the main source of variation in∆Babs and can cause occasional negative en-hancements. Region I in Fig. 4a, for particle coating masses of 0–5 µg m−3, where
∆Babs increases with increasing coating mass, can be fitted adequately by a linear re-gression line which gives a slope of 0.35±0.07 (M m)−1(µg m−3)−1. One of the more striking patterns in the figure is that the signal enhancement does not increase through 10
the entire range of particle coating mass, but appears to plateau before dropping to lower values. Within the plateau region (i.e., region II, for particle coating masses of 5–11 µg m−3), particle coating on average consisted of 70–88% organic matter, while sulphate, ammonium, and nitrate contributed 4–15%, 5–12%, and 2–4%, re-spectively (Fig. 4d). These results show that when the coating has accumulated to 15
certain mass range, about 5 to 11 µg m−3 in this case, the absorption enhancement becomes relatively steady despite the change in coating quantity or composition. Ap-plying a linear regression fit to the∆Babs over this region gives a regression slope of 0.01±0.09 (M m)−1(µg m−3)−1, implying that the absorption enhancement remains con-stant during this stage. The plateau region suggests that when the particle coating has 20
grown to considerable size the relationship between the coating enhancement and the amount of coating mass becomes weak. As a result, much larger increases in particle coating mass are required to cause further increases in absorption, as predicted by Bond et al. (2006).
In areas where fresh emissions are contributing to the BC continual accumulation 25
nat-ACPD
10, 19939–19980, 2010Measurements of black carbon light
absorption enhancement
T. W. Chan et al.
Title Page
Abstract Introduction
Conclusions References
Tables Figures
◭ ◮
◭ ◮
Back Close
Full Screen / Esc
Printer-friendly Version Interactive Discussion
Discussion
P
a
per
|
Dis
cussion
P
a
per
|
Discussion
P
a
per
|
Discussio
n
P
a
per
|
ural atmospheric processes BC aggregates collapse, leading to an abrupt change in apparent BC absorption, as observed in Fig. 4a. Indeed previous field and labora-tory observations have shown that condensed water (Ramachandran and Reist, 1995; Huang et al., 1994), sulfuric acid (Pagels et al., 2009), and other organic materials (Slowik et al., 2007b) can all lead to collapse of BC aggregate. However, the amount 5
of coating mass required to induce this change was not reported. Results from this study suggest that a lower limit estimate of this threshold at suburban Toronto is about 10 µg m−3. However, the exact value may vary depending on the BC source and on a variety of atmospheric processes, although further research is needed to understand these factors and the time scales involved.
10
The small ∆Babs values at a high particle coating mass indicate that there is no absorption enhancement for the denuded and non-denuded samples. Interestingly, this result is consistent with the observations from Knox et al. (2009) who observed no statistical differences in absorption enhancement for particles present in aged air masses with and without the coating removed.
15
Figure 4b shows the variations of the signal enhancement in particle light scattering (∆Bscat) measured by the PA as a function of the particle coating mass. Unlike∆Babs,
∆Bscatincreases throughout the full range of particle coating mass and also increases more rapidly. The ∆Bscat measurements on Fig. 4b can be fitted well with a power function; this indicates that the light scattering, as might be expected, is influenced 20
more-dramatically by the amount of particle coating materials.
In comparison to the PA observations, regardless of the amount of coating mass on the particles, there is no signal enhancement in the SVF (∆SVF) measured by the LII (Fig. 4c). Applying a linear regression fit to the measurements in Fig. 4c gives a slope of (8.36±0.44)×10−17(µg m−3)−1. Applying the material BC density of 1.9 g cm−3 to 25
ACPD
10, 19939–19980, 2010Measurements of black carbon light
absorption enhancement
T. W. Chan et al.
Title Page
Abstract Introduction
Conclusions References
Tables Figures
◭ ◮
◭ ◮
Back Close
Full Screen / Esc
Printer-friendly Version Interactive Discussion
Discussion
P
a
per
|
Dis
cussion
P
a
per
|
Discussion
P
a
per
|
Discussio
n
P
a
per
|
on the regression analysis, the estimated detection limit is 14.76±6.08 ng m−3. This is consistent with the 15 ng m−3measurement limit for the high sensitivity LII (Smallwood, 2009).
Returning to the PA∆Babs measurements in regions I and III, the best fit slopes are 0.35 (M m)−1(µg m−3)−1 and 0.28 (M m)−1(µg m−3)−1, respectively. Applying the ob-5
servable range of SAC values from this study (2.6 to 22.5 m2g−1
based on Eq. (3); Table 1) to these regression slopes gives a range for the apparent BC mass concentra-tion of from 0.01±0.01 µg m−3to 0.13±0.03 µg m−3per every 1 µg m−3of coating mass present on a particle, respectively.
The contrasting results between the coating impact on PA and LII determination of 10
BC mass, which were expected, are related to substantial differences in the measure-ment principles between the PA and LII. In the case of LII, the absorbed laser energy is sufficient to heat the BC to temperatures that will evaporate any volatile or non-refractory substances on the particle, eliminating their role in the transfer of the laser energy to the BC in the particle and hence in the absolute measurement of BC. Sec-15
ondly, the AC-LII approach (Snelling, 2005) compensates for any reduction in particle temperature due to the evaporation of volatiles. Thus, as hypothesized, the amount of particle coating does not influence the LII measurements of SVF. This result is con-sistent with observations from other studies using laser-induced incandescence based instruments such as the Single Particle Soot Photometer (e.g., Slowik et al., 2007a). 20
In the case of the PA, much less, if any evaporation occurs due to the lower energy of the laser, which has limited impact on particle temperature. Consequently, the pres-ence of particle coating contributes to a lensing effect by concentrating the PA laser energy into the BC core thus enhancing absorption, similar to what is predicted to occur when atmospheric particles interact with the sun’s energy (Bond et al., 2006). 25
ACPD
10, 19939–19980, 2010Measurements of black carbon light
absorption enhancement
T. W. Chan et al.
Title Page
Abstract Introduction
Conclusions References
Tables Figures
◭ ◮
◭ ◮
Back Close
Full Screen / Esc
Printer-friendly Version Interactive Discussion
Discussion
P
a
per
|
Dis
cussion
P
a
per
|
Discussion
P
a
per
|
Discussio
n
P
a
per
|
relationship between BC amount and light absorption for freshly emitted BC particles. 4.3 Factors affecting particle light absorption
4.3.1 BC particle morphology and spherule diameter
BC particles are formed during combustion at temperatures between about 1000 and 2800 K, at pressure of 50 to 100 atm inside both gasoline and diesel powered engines, 5
but primarily from the latter (Heywood, 1988). The BC formation and oxidation pro-cesses are completed before the exhaust exits the combustion engine. The BC forma-tion process can be summarized by a series of steps with an initial nucleaforma-tion process to produce the BC precursors, followed by a vapour to particle surface growth process to form the BC spherules up to about 10 to 20 nm, and then by the agglomeration pro-10
cess, which leads to the formation of the chainlike or aggregate structures (Amann and Siegla, 1982; Heywood, 1988). Diesel particulate matter collected at a conventional di-lution tunnel may also contain 10–30% unburned hydrocarbons by mass (Amann and Siegla, 1982).
Particle morphology is known to play a role in affecting particle light absorption (Fuller 15
et al., 1999) and this effect was investigated in this study through the use of the primary particle size (PPS) measured by the LII. Theoretically, the PPS refers to the diameter of the individual spherule that makes up BC particle chains or aggregates. In the LII the PPS is estimated or inferred by measuring the rate of heat loss of the particle to the surrounding air and then comparing this to calculations for estimating the available 20
active surface area per unit volume air for heat transfer; this can then be related to the size of the spherules assuming the spherules within an aggregate are in point contact with each other. Observations show that freshly emitted BC particles measured from diesel exhaust usually have low PPS values ranging from 10 nm to about 30 nm (Smallwood, 2009). Over time, emitted particles undergo atmospheric processes and 25
ACPD
10, 19939–19980, 2010Measurements of black carbon light
absorption enhancement
T. W. Chan et al.
Title Page
Abstract Introduction
Conclusions References
Tables Figures
◭ ◮
◭ ◮
Back Close
Full Screen / Esc
Printer-friendly Version Interactive Discussion
Discussion
P
a
per
|
Dis
cussion
P
a
per
|
Discussion
P
a
per
|
Discussio
n
P
a
per
|
evaporate from the BC particles (e.g., Ramachandran and Reist, 1995; Huang et al., 1994; Hallett et al., 1989). During such processes, the different amounts and types of materials present on the BC aggregate may induce a change in surface tension of the BC particle causing the structure to collapse. As the BC aggregate collapses, some of the surface area becomes shielded and is not available for heat transfer and this leads 5
to an increased PPS value as inferred from LII (Smallwood, 2009).
Given that the PPS determined from LII is also a measure of the particle collapse, in this study an increasing trend of the PPS value is also assumed to be a surrogate for particle collapse. However, due to the complexity of the aggregate structure, the degree of collapse may not be a continuous variable but a categorical variable with 10
complex behaviour. Nonetheless, this assumption is expected to be reasonable for combustion generated BC particles (e.g., diesel aggregates), particularly during the earlier part of their life in the atmosphere when they start as more branched structures allowing LII to detect the actual and smaller PPS. Conversely, in situations when the original aggregate is less branched or partially collapsed, it is likely that PPS will be 15
less variable over time and the lower and upper limit of the PPS will appear to be more constrained. It is worth noting that the PPS value inferred from LII does not directly measure the structure of the BC particles. It is possible for particles to have different structures but still be made up by spherules with the same diameter, which may or may not impact the PPS inferred by LII. Other combinations of true spherule 20
size and structure could also have similar PPS values. The uncertainty imparted by this variability likely results in it being more difficult to infer physical patterns when comparing PPS among widely separated time periods or measurement locations.
4.3.2 Measuring the light absorption enhancement
As the SVF from the LII measurement is independent of the particle coating mass while 25
ACPD
10, 19939–19980, 2010Measurements of black carbon light
absorption enhancement
T. W. Chan et al.
Title Page
Abstract Introduction
Conclusions References
Tables Figures
◭ ◮
◭ ◮
Back Close
Full Screen / Esc
Printer-friendly Version Interactive Discussion
Discussion
P
a
per
|
Dis
cussion
P
a
per
|
Discussion
P
a
per
|
Discussio
n
P
a
per
|
a given time interval can be determined without needing to perturb conditions through use of a thermodenuder, which will give more representative measurements of the im-pact of coating on light absorption. Furthermore, since these measurements can be taken with 1 min time resolution and both are responding to the variation in the sig-nal that is caused by real variation in the ambient BC concentrations, it is possible to 5
quickly compare different atmospheric particles types or air masses in terms of how the coating enhancement varies.
For ambient measurements, the light absorption enhancement observed from the PA:LII ratio consists of enhancements impacted by particle morphology, amount of coating materials and possibly by BC mass concentration. To properly compare the 10
measurements, the PA:LII ratio proposed above is normalized by the particle coat-ing mass estimated from the AMS. The normalized PA:LII ratio can be viewed as the light absorption enhancement per unit mass concentration of coating materials as it removes the additional enhancement caused by varying amount of the coating mass on the particles. This allows various measurements obtained at different times and 15
locations to be combined to study the morphology enhancement of BC nanoparticles.
4.4 Signal enhancement from ambient measurements
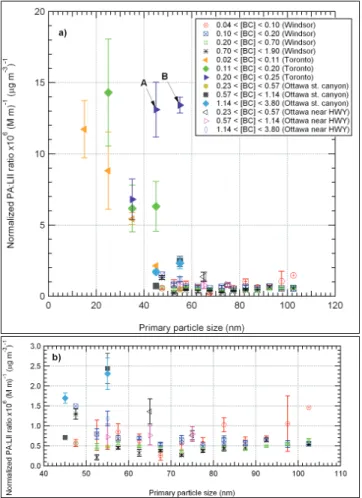
Figure 5a shows the normalized PA:LII ratio as a function of PPS measured at Toronto, Ottawa (street canyon and near highway), and Windsor. The corresponding measure-ments are summarized in Table S1, S2, S3, and S4 in the Supplement, respectively. 20
Measurements from all field studies are first separated according to different ranges of BC mass concentration (calculated from the SVF as it is independent of the coating mass). The data are then grouped according to the various ranges of PPS. As the normalized PA:LII ratio has removed the enhancement caused by various amount of coating mass, data in Fig. 5 represent the best estimate of the enhancement caused 25
ACPD
10, 19939–19980, 2010Measurements of black carbon light
absorption enhancement
T. W. Chan et al.
Title Page
Abstract Introduction
Conclusions References
Tables Figures
◭ ◮
◭ ◮
Back Close
Full Screen / Esc
Printer-friendly Version Interactive Discussion
Discussion
P
a
per
|
Dis
cussion
P
a
per
|
Discussion
P
a
per
|
Discussio
n
P
a
per
|
normalized PA:LII ratio decreases with increasing PPS up to about 70 nm and then increases gradually for larger PPS values.
The Toronto measurements exhibit the highest enhancement compared to other data sets. The BC particles observed in Toronto also had the smallest PPS values suggest-ing that most of these particles are freshly emitted and are likely to be in an aggregate 5
form. There are two points, labelled as A and B in Fig. 5a, that are outliers in the decreasing trend in normalized PA:LII ratio with increasing PPS (below 70 nm). The average particle composition for most measurement points in Fig. 5 are close to the grand average values. However, for points A and B, the organics to sulphate ratios are 7 and 15, respectively, which are higher than the average ratio of 5 using the grand 10
average composition values. Also, point A and B represent an average value of eight and three 5-min continuous measurements, respectively. In comparison, these are relatively short periods compared to other data points in the Toronto data set. For ex-ample, data points with BC mass concentration between 0.02 to 0.11 µg m−3
(orange triangle) with PPS less than 30 nm are averages of 43 and 30 data points, respectively. 15
Data points with BC mass concentration between 0.11 and 0.20 µg m−3 (green dia-mond) are averages of 10 to 19 data points. Therefore, these might imply that points A and B represent a brief moment with a different air mass containing BC particles with a different structure than most that were observed in Toronto. As a result, points A and B seem to have a different trend compared to the rest of the measurements. 20
Excluding points A and B, the Toronto data exhibit a decreasing trend towards larger PPS values with a reasonable continuity with the Windsor and Ottawa measurements. If the inferred primary spherule diameter from the LII (i.e., PPS) can be used to infer the degree of particle collapse, particles with very small PPS correspond to highly branched, with complex structure, fresh BC aggregates. As the BC aggregate is more 25
ACPD
10, 19939–19980, 2010Measurements of black carbon light
absorption enhancement
T. W. Chan et al.
Title Page
Abstract Introduction
Conclusions References
Tables Figures
◭ ◮
◭ ◮
Back Close
Full Screen / Esc
Printer-friendly Version Interactive Discussion
Discussion
P
a
per
|
Dis
cussion
P
a
per
|
Discussion
P
a
per
|
Discussio
n
P
a
per
|
(elongated vs. branched) of fresh BC aggregates due to the wide range of engine and operating conditions within the vehicle fleets on the roads in or upwind of the areas of our measurements.
During the BAQS-Met field study, CRUISER was parked inside the city of Windsor for several days of near-continuous measurements and then deployed to several locations 5
away from the city for short term measurements. The small set of measurements that were taken outside of the city of Windsor are not statistically different from those taken within the city and therefore the two sets of measurements are combined and presented together in this section. Data obtained at and around Windsor show the lowest enhancement among all other data sets. The enhancement values for various 10
BC mass concentrations are similar and the trend in the normalized PA:LII ratio across the entire range of PPS values is gradual. The ratio decreases with increasing value of PPS to about 70 nm and then gradually increases for larger PPS. The data suggest that most of the BC particles observed in the Windsor area were not fresh and were likely already collapsed to a large extent. However, further compacting of the BC structure 15
and accumulation of condensable materials onto the particle led to a continued and observable increase in the PPS and a slow increase in Babs enhancement per unit coating mass, respectively.
When sampling in the Ottawa street canyon, the tall buildings helped confine the vehicle emissions (especially from the diesel buses). This is reflected by the higher BC 20
concentrations (Table 1). In contrast, sampling near the Ottawa highway in the after-noon (more vertical mixing) and with no large barriers to particle transport in and out of the area enhanced dilution of the BC particles leading to lower ambient BC concentra-tions (Table 1). When compared to the Toronto and Windsor data sets, the BC particles observed in Ottawa had intermediate PPS values ranging from about 40 nm to 80 nm, 25
ACPD
10, 19939–19980, 2010Measurements of black carbon light
absorption enhancement
T. W. Chan et al.
Title Page
Abstract Introduction
Conclusions References
Tables Figures
◭ ◮
◭ ◮
Back Close
Full Screen / Esc
Printer-friendly Version Interactive Discussion
Discussion
P
a
per
|
Dis
cussion
P
a
per
|
Discussion
P
a
per
|
Discussio
n
P
a
per
|
near highway measurements. This is likely due to the fact that the street canyon mea-surements were strongly impacted by diesel powered buses while the near highway site was dominated by gasoline powered vehicles. We speculate that the diesel BC par-ticles observed in the street canyon (particularly at high BC concentrations) were still in a more open aggregate form while the gasoline BC particles were more collapsed 5
(see Section 4.5); this leads to a relatively higherBabs enhancement in the diesel BC particle dominated street canyon data set.
4.5 Variations of the SAC with particle morphology
In situations when the light absorption from a BC particle is enhanced due to factors such as coating a higher value would be inferred for the SAC. Conversely, if a known 10
amount of BC mass ages and relative quantities of other light absorbing species (e.g., brown carbon) increase, then itsBabs will be larger for the same amount of BC mass without coating, but less than the situation when the coating is composed of pure light scattering (non-absorbing) materials (Lack and Cappa, 2010). Under these circum-stances the SAC derived from a more aged sample would be smaller.
15
The concurrent PA and LII measurements in this study were sampling the same air and thus equating their two definitions of BC mass concentration yields the SAC:
SAC(m2g−1)
= Babs
SVF×ρsoot
(3)
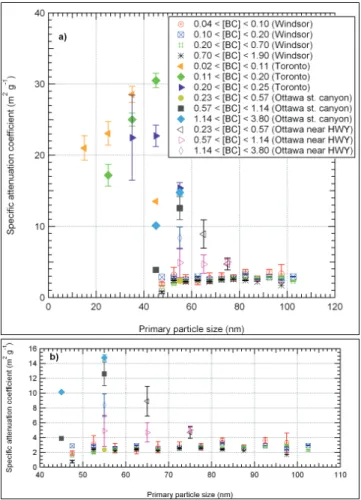
Figure 6a shows the variation in the calculated SAC for all data. These results are also summarized in Tables S5 to S8 in the Supplement. As in Fig. 5, the data in 20
Fig. 6 are first separated according to different BC mass concentration ranges and then grouped according to different PPS ranges. The grand average value of the SAC at the Toronto location, the Ottawa street canyon, the Ottawa near highway, and in and around Windsor are 22.5±0.7 m2g−1, 11.2±1.0 m2g−1, 6.5±0.8 m2g−1, and 2.6±0.04 m2g−1, respectively (Table 1). These results are generally within the range of values reported 25
ACPD
10, 19939–19980, 2010Measurements of black carbon light
absorption enhancement
T. W. Chan et al.
Title Page
Abstract Introduction
Conclusions References
Tables Figures
◭ ◮
◭ ◮
Back Close
Full Screen / Esc
Printer-friendly Version Interactive Discussion
Discussion
P
a
per
|
Dis
cussion
P
a
per
|
Discussion
P
a
per
|
Discussio
n
P
a
per
|
Schauer, 2007; Chan et al., 2010), providing some confidence in the use of SVF from the LII for estimating the BC mass concentration.
Generally, the SAC values in Fig. 6a can be divided into three main sections. For particles with PPS<40 nm the SAC values are large, in the range of 20–30 m2g−1; this is similar to measurements that were obtained in Congo, Ivory Coast (20 m2g−1; 5
Liousse et al., 1993) and the winter and summer measurements at Alert, Canada (19– 28 m2g−1; Sharma et al., 2002). In Fig. 6a, when PPS>70 nm the SAC values are small, in the range of 2–4 m2g−1. These value are consistent with US urban sum-mertime measurements at the University of Rochester (2.7 m2g−1) and in downtown Philadelphia (3.3 m2g−1; Jeong et al., 2004), with late spring measurements at the ru-10
ral site of Egbert in Central Ontario, Canada (3.8 m2g−1
; Chan et al., 2010), and with measurements at the remote site of Mace Head Ireland (5 m2g−1; Liousse et al., 1993). In between 40 nm and 70 nm the SAC values are highly variable covering the range of values seen for the small and large PPS values, especially for PPS from 40–50 nm. Possible reasons for this behaviour are discussed in the following paragraphs.
15
When the PPS is less than 40 nm the BC particles are fresh and in chainlike or aggregate forms. Both of these morphologies tend to cause a larger particleBabsvalue for a given BC mass and lead to a larger SAC, as shown in Fig. 6. Most of the Toronto data are in this section of the plot, with the largest SAC values despite relatively low BC concentrations. This is because although the BC mass is low theBabsis relatively 20
large due to the enhancement caused by the complex morphology associated with fresh emissions which more efficiently absorbs light and is more-impacted by coatings. When the PPS is larger than 70 nm BC particles are aged, regardless of the source, and therefore the BC particles tend to be fully collapsed and more spherical in shape. Consequently, theBabs enhancement is smaller and the resulting SAC values are the 25
ACPD
10, 19939–19980, 2010Measurements of black carbon light
absorption enhancement
T. W. Chan et al.
Title Page
Abstract Introduction
Conclusions References
Tables Figures
◭ ◮
◭ ◮
Back Close
Full Screen / Esc
Printer-friendly Version Interactive Discussion
Discussion
P
a
per
|
Dis
cussion
P
a
per
|
Discussion
P
a
per
|
Discussio
n
P
a
per
|
The wide range of observed SAC values in the middle section of Fig. 6a indicates that when the PPS is between 40 and 70 nm the situation is more complicated. We hypothesize that the cause of this observation is that unlike when PPS is <40 nm or
>70 nm there are large differences in the origin and history of the particles associated with a 40–70 nm PPS. This leads to a range of SAC values among the measurements 5
shown in Fig. 6a. For example, fresh diesel emissions could produce particles with a variety of PPS values within the 40–70 nm range depending upon the processes involved. The smaller end of this range would reflect particles consisting of chainlike aggregates with a minimal amount of collapse, which likely represents the typical situa-tion with relatively large SAC values. In contrast, larger PPS values could arise in fresh 10
diesel emissions during situations with frequent acceleration. In a situation like the Ot-tawa street canyon, where all the buses were constantly accelerating after stopping to let offpassengers or near the Toronto site, where “stop and go” traffic is common, large numbers of BC particles would be generated within a short period of time and within a small area. This high number density would result in a greater potential for coagula-15
tion to form slightly collapsed and larger aggregates (i.e., increases the PPS value). In the street canyon or during rush hour there is also the potential for particles to remain nearby for longer periods so that less fresh diesel particles are observed to occur rela-tively close to the traffic. Due to natural processes (i.e., aging) the aggregates of these particles would also tend to be partially collapsed. Thus, in the vicinity of diesel traffic 20
there can be a range of PPS values. At the same time the amount of coating can vary, although diesel BC particles tend to contain less coating material due to the relatively lean running conditions (Heywood, 1988). Thus, the resulting SAC values would be relatively small such as the Toronto points in Fig. 6 with SAC values around 15 m2g−1 or the even smaller SAC values for some of the points shown for the street canyon. 25