ESDD
3, 801–825, 2012Deglacial ocean circulation
G. Lohmann et al.
Title Page
Abstract Introduction
Conclusions References
Tables Figures
◭ ◮
◭ ◮
Back Close
Full Screen / Esc
Printer-friendly Version Interactive Discussion
Discussion
P
a
per
|
Dis
cussion
P
a
per
|
Discussion
P
a
per
|
Discussio
n
P
a
per
|
Earth Syst. Dynam. Discuss., 3, 801–825, 2012 www.earth-syst-dynam-discuss.net/3/801/2012/ doi:10.5194/esdd-3-801-2012
© Author(s) 2012. CC Attribution 3.0 License.
Earth System Dynamics Discussions
This discussion paper is/has been under review for the journal Earth System Dynamics (ESD). Please refer to the corresponding final paper in ESD if available.
Minor e
ff
ect of meltwater on the ocean
circulation during deglaciation
G. Lohmann1,2, K. Grosfeld1, M. Butzin1,2, P. Huybrechts3, and C. Zweck4
1
Alfred Wegener Institute for Polar and Marine Research, Bremerhaven, Germany 2
Center for Marine Environmental Sciences, University of Bremen, Bremen, Germany 3
Earth System Sciences & Departement Geografie, Vrije Universiteit Brussel, Brussel, Belgium
4
Department of Hydrology and Water Resources, University of Arizona, Tucson, Arizona, USA Received: 27 July 2012 – Accepted: 5 August 2012 – Published: 16 August 2012
Correspondence to: G. Lohmann ([email protected])
ESDD
3, 801–825, 2012Deglacial ocean circulation
G. Lohmann et al.
Title Page
Abstract Introduction
Conclusions References
Tables Figures
◭ ◮
◭ ◮
Back Close
Full Screen / Esc
Printer-friendly Version Interactive Discussion
Discussion
P
a
per
|
Dis
cussion
P
a
per
|
Discussion
P
a
per
|
Discussio
n
P
a
per
|
Abstract
Decaying Northern Hemisphere ice sheets during deglaciation affect the high lati-tude hydrological balance in the North Atlantic and therefore the ocean circulation after the Last Glacial Maximum. Surprisingly, geological data suggest that meltwater fluxes of about 14–20 m sea-level equivalent flushed into the North Atlantic without
5
significantly influencing the Atlantic meridional overturning circulation. Using a three-dimensional ocean circulation model coupled to an energy balance model of the at-mosphere, we investigate the response of the ocean circulation to spatio-temporal variable deglacial freshwater discharges. Freshwater inputs are simulated by a three-dimensional thermo-mechanical ice sheet model of the Northern Hemisphere. In our
10
experiments, we find a strong sensitivity of the ocean circulation when the deglacial meltwater is injected into the surface layers yielding a quasi shut-down. On the other hand, the parameterization of huge sub-glacial outbursts as so-called hyperpycnal flows are mimicked through bottom injections in ocean models leading to a reduced sensitivity of the overturning circulation against freshwater perturbations and providing
15
a consistent representation of the deglacial climate evolution.
1 Introduction
During the last deglaciation about 20 ka to 10 ka BP (ka BP=thousand years before present), huge amounts of glacial meltwater, emanating from the huge continental ice sheets over the Northern Hemisphere entered the North Atlantic. Associated
reduc-20
tions in North Atlantic Deep Water (NADW) formation and corresponding reduction of the meridional heat transport could, consequently, have influenced the deglacial cli-mate. Reconstructions of global sea level indicate marked changes by abrupt fluctu-ations within several hundred years, raising the sea level on the order of 14 to 20 m (Clark et al., 1996) during the Bølling/Allerød warm interval. The most prominent event
25
ESDD
3, 801–825, 2012Deglacial ocean circulation
G. Lohmann et al.
Title Page
Abstract Introduction
Conclusions References
Tables Figures
◭ ◮
◭ ◮
Back Close
Full Screen / Esc
Printer-friendly Version Interactive Discussion
Discussion
P
a
per
|
Dis
cussion
P
a
per
|
Discussion
P
a
per
|
Discussio
n
P
a
per
|
1989) with up to 0.5 Sv (1 Sv=106m3s−1) (Clark et al., 2002a) entering the North
At-lantic for about 500 yr.
However, NADW formation was not affected seriously (McManus et al., 2004), and the next major cooling phase occured more than 1000 yr later at the onset of the Younger Dryas between about 12.9 ka BP and 11.5 ka BP (Clark et al., 2002b). At the
5
end of the Younger Dryas the North Atlantic realm experienced again rapid warming that ended up in Holocene climate conditions.
In the discussion of probable causes, the melting of continental ice sheets is the obvious source of the sea-level changes. It has not been answered yet in detail which glacial ice sheets contributed to the MWP-1a event, the Antarctic Ice Sheet or/and
10
the Laurentide/Fennoscandian Ice Sheets. There are several publications arguing for both sources with different amounts of contributions (e.g. Peltier, 2004; Flower et al., 2004; Clark et al., 2002a; Weaver et al., 2003; Bassett et al., 2005; Stanford et al., 2006; Carlson, 2009; Otto-Bliesner and Brady, 2010; Gregoire et al., 2012). Here, we assess the effect of freshwater discharge originating from the Laurentide Ice Sheet on
15
the ocean circulation.
If one assumes a Northern Hemisphere source for MWP-1a, a flushing into the North Atlantic can shut down the Atlantic meridional overturning circulation (AMOC) in model simulations (e.g. Stocker et al., 1992; Manabe and Stouffer, 1997), which is however not supported by proxy data (e.g. Sarnthein et al., 1994; McManus et al., 2004; Stanford
20
et al., 2006).
In a study for the climate change during the last deglaciation, Knorr and Lohmann (2007) illustrated that the onset of a strong AMOC is inevitable, and that only the tim-ing of AMOC resumption is triggered by melttim-ing water, indicattim-ing that the freshwater flux plays only a secondary role for the termination of ice sheets. On the contrary, a
25
ESDD
3, 801–825, 2012Deglacial ocean circulation
G. Lohmann et al.
Title Page
Abstract Introduction
Conclusions References
Tables Figures
◭ ◮
◭ ◮
Back Close
Full Screen / Esc
Printer-friendly Version Interactive Discussion
Discussion
P
a
per
|
Dis
cussion
P
a
per
|
Discussion
P
a
per
|
Discussio
n
P
a
per
|
ice sheets: Why should the ocean get to a stronger mode during the Bølling/Allerød al-though massive meltwater fluxes entered the Atlantic Ocean?
One explanation could be a freshwater storage on land, e.g. Lake Agassiz. Such a lake could conceivably contain the equivalent of as much as 1–2 m of sea-level rise and have retarded the sea-level rise after MWP-1a. Alternatively, Antartic Ice Sheet growth
5
during the same period could have masked part of the sea-level rise after MWP-1a caused by the high Northern Hemisphere freshwater fluxes and lagged sea-level con-tribution (Huybrechts, 2002). Another type of explanation is related to the sensitivity to freshwater perturbations (e.g. Stanford et al., 2006). Modelling efforts with a simplified geometry of the Atlantic Ocean suggest that the sensitivity of the ocean circulation
10
to surface freshening can be overestimated when neglecting the overflow contribution (Lohmann, 1998), and that a most likely northern source of deep water formation can stabilize the system during the Bølling/Allerød (Lohmann and Schulz, 2000). Evidence from Aharon (2003, 2006) and Piper et al. (2007) suggests that a huge sub-glacial, sediment-laden outburst flood through the Mississippi, the Hudson River, or the Gulf of
15
St. Lawrence, could have sneaked into the deep ocean. Due to its increased density, these so-called hyperpycnal flows propagate along the sea floor as bottom plumes and do not act like surface freshwater pulses (Tarasov and Peltier, 2006). Hence, MWP-1a discharges in terms of hyperpycnal flows, as indicated by paleoclimate records, offer a compelling explanation for the regular NADW ventilation rate instead of AMOC
weak-20
ening (Aharon, 2006).
Roche et al. (2007a) demonstrated in a climate model under glacial background con-ditions that freshwater, when injected into the deep ocean, is less efficient in slowing down the meridional overturning circulation than under surface forcing. It strongly de-pends on the location and, hence, on the stratification of the water column where the
25
ESDD
3, 801–825, 2012Deglacial ocean circulation
G. Lohmann et al.
Title Page
Abstract Introduction
Conclusions References
Tables Figures
◭ ◮
◭ ◮
Back Close
Full Screen / Esc
Printer-friendly Version Interactive Discussion
Discussion
P
a
per
|
Dis
cussion
P
a
per
|
Discussion
P
a
per
|
Discussio
n
P
a
per
|
Here, we follow the approach of Roche et al. (2007a), but induce the deglacial melt-water along the coast line of Northern Hemisphere ice sheets into the ocean in order to investigate the response of the AMOC. The freshwater fluxes are calculated from a 3-dimensional thermo-mechanically coupled ice sheet model reconstructing the Qua-ternary ice sheet during the last glacial cycle. Surface runoff is routed for given ice
5
sheet orography and released along the coast line into the ocean which is modelled with an ocean general circulation model and is forced with different glacial background climate conditions in a transient simulation. Analyses of the ocean feedback provide insights into the sensitivity of the ocean circulation on the deglacial freshwater dis-charges. The paper is organized as follows: the model and experimental design is
in-10
troduced in Sect. 2. Results from different model experiments are presented in Sect. 3 and discussed in Sect. 4 where also conclusions are drawn.
2 The model and experimental design
The ocean model is an improved version of the Hamburg Large Scale Geostrophic (LSG) ocean circulation model by Meier-Reimer et al. (1993). The modified version
15
includes a less-diffusive third-order advection scheme for temperature and salinity (Prange et al., 2003). Tracer diffusivities are explicitly prescribed. Horizontal diff usiv-ities vary from 107cm2s−1at the surface to 5
×106cm2s−1at the bottom; in the
verti-cal from 0.3 cm2s−1 to 2.6 cm2s−1, respectively. Adjustment of the mixing coe
fficients is found from calibration simulations of the present steady state, considering transient
20
anthropogenic radiocarbon values of∆14C and CO2for the period 1765–1995 (Butzin
et al., 2005).
The resolution in the horizontal scale is 3.5◦
×3.5◦ and there are 22 levels in the
vertical. We apply a surface heat flux formulation based on an atmospheric energy balance model with diffusive lateral heat transports (Rahmstorf and Willebrand, 1995;
25
ESDD
3, 801–825, 2012Deglacial ocean circulation
G. Lohmann et al.
Title Page
Abstract Introduction
Conclusions References
Tables Figures
◭ ◮
◭ ◮
Back Close
Full Screen / Esc
Printer-friendly Version Interactive Discussion
Discussion
P
a
per
|
Dis
cussion
P
a
per
|
Discussion
P
a
per
|
Discussio
n
P
a
per
|
our ocean model. Details of the model and previous freshwater hosing experiments are discussed in Prange et al. (2002) and Butzin et al. (2005, 2012).
In order to mimic deglacial climate variations, we instantaneously changed the cli-mate background conditions during the deglacial period from relative cold to warm and back to cold conditions. In our model runs, these climate states mimic the stadial (ST)
5
and interstadial (IS) climate conditions as provided by the different background con-ditions. We largely follow the deglacial chronology after McManus et al. (2004) which described the onset of the Bølling/Allerød warm period at 14.6 ka BP, an interruption of the warm period during the Younger Dryas beginning at 12.7 ka BP, and a backward-switch to warm conditions at 11.4 ka BP.
10
The ST and IS background climate conditions are simulated in the ocean model fol-lowing the procedure by Butzin et al. (2005). The background conditions are based on atmospheric general circulation model simulations (Roeckner et al., 1992; Lohmann and Lorenz, 2000) providing wind stress, background surface air temperature and freshwater fluxes. The glacial sea surface temperature (SST) forcing for the
atmo-15
spheric circulation model originates from two alternative data sets. For one set of experiments mimicking ST we utilize the CLIMAP (1981) reconstruction with an ad-ditional cooling of 3◦C in the tropics between 30◦N and 30◦S (Lohmann and Lorenz,
2000). For the other set of experiments mimicking IS, the GLAMAP reconstruction (see Sarnthein et al., 2003 and references therein) is employed in the globally extended
20
version of Paul and Sch ¨afer-Neth (2003). These SST patterns display higher values in the North Atlantic, the sea ice cover in the North Atlantic is significantly reduced with ice-free Nordic Seas during summer and a winter sea ice margin similar to the CLIMAP summer sea ice boundary. For a detailed comparison with geological data, we refer to Butzin et al. (2005) and Hesse et al. (2011).
25
ESDD
3, 801–825, 2012Deglacial ocean circulation
G. Lohmann et al.
Title Page
Abstract Introduction
Conclusions References
Tables Figures
◭ ◮
◭ ◮
Back Close
Full Screen / Esc
Printer-friendly Version Interactive Discussion
Discussion
P
a
per
|
Dis
cussion
P
a
per
|
Discussion
P
a
per
|
Discussio
n
P
a
per
|
resolution with 17 vertical levels (Huybrechts and T’siobbel, 1997). The main inputs of the model are bed topography, sea level temperature and precipitation as climate forcing components. The time dependent climate forcing is built around two general circulation model (GCM) time slices, from an Last Glacial Maximum and a present day simulation.
5
In addition to the atmospheric freshwater forcing, modelled meltwater fluxes by ice-berg calving and surface runofffrom the ice sheet model are taken to force the ocean model. The data sets are provided in a 100-yr sequence and are added to the sur-face fields of precipitation minus evaporation (P −E). The surface routing drains the
freshwater into the ocean along the coast lines.
10
The concept of hyperpycnal flows (e.g. Tarasov and Peltier, 2006; Aharon, 2006) indicates that huge meltwater pulses can be worked up by the North Atlantic if they are taken as sediment laden bottom plumes that sneak along the ocean bottom to the deep sea. Due to the coarse resolution of our ocean model and the lack of a two component sediment-water consideration for the equation of state, we mimic the
15
process of hyperpycnal flows in that we introduce the freshwater input directly into the model bottom layers.
3 Results
3.1 The background climate conditions
The two glacial background climates for stadial and interstadial conditions yield different
20
overturning rates in the North Atlantic for their quasi steady state after about 20 000 yr of integration (Fig. 1). The experiment forced with the coldest boundary conditions ST (Fig. 1a) yields 7 Sv, about 60 % reduction of the North Atlantic maximum overturning strength compared to PD conditions (not shown, see for details Butzin et al., 2005 and Hesse et al., 2011). Due to the extended sea ice coverage into the northern North
25
ESDD
3, 801–825, 2012Deglacial ocean circulation
G. Lohmann et al.
Title Page
Abstract Introduction
Conclusions References
Tables Figures
◭ ◮
◭ ◮
Back Close
Full Screen / Esc
Printer-friendly Version Interactive Discussion
Discussion
P
a
per
|
Dis
cussion
P
a
per
|
Discussion
P
a
per
|
Discussio
n
P
a
per
|
is enhanced in transport (about 6 Sv) and volume and fills the abyssal ocean up to about 1500 m depth, representing an overturning circulation mode taken as analogue for the glacial state which experienced massive glacial ice discharge in terms of iceberg from the Northern Hemisphere ice sheets.
The experiment IS (Fig. 1b) shows a maximum Atlantic meridional overturning
cir-5
culation (AMOC) rate of about 16 Sv, only 3 Sv less than the AMOC simulated for PD conditions. While the NADW formation is close to PD conditions in amplitude and lo-cation, AABW is reduced (<1 Sv for IS instead of about 4 Sv for PD). In the following,
these two simulations are taken as background climate conditions in a transient simu-lation, which switches between the different climate states (ST and IS).
10
3.2 Glacial freshwater flux
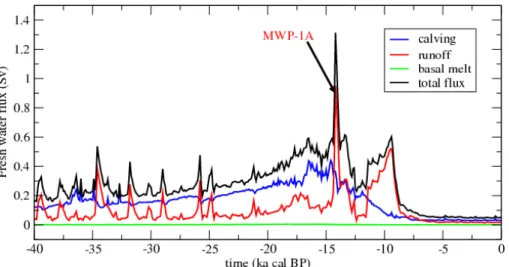
Besides the variation in lateral extent and total height of the ice sheet (Zweck and Huy-brechts, 2005), the resulting freshwater discharges from the Northern Hemisphere ice sheets during the last glacial cycle is calculated (Fig. 2). This rate is the important forc-ing when investigatforc-ing AMOC changes durforc-ing the deglaciation. The freshwater flux of
15
the Northern Hemisphere ice sheets has two main components, iceberg calving and surface runoff. Since melting at the ice sheet base is 2 to 3 orders of magnitude smaller than the other mass balance components, it is neglected in our study. In general, calv-ing at the ice margins is the dominatcalv-ing component for most of the last glacial cycle, contributing about 50–80 % of the total ice volume loss. The second component surface
20
runoffshows much higher frequency with peaking amplitudes of up to 10 times average mass loss (Fig. 2). These peaks occur during warm periods in the climate forcing that induce strong surface melting. The peaks typically last a few hundred years followed by a cold period. The outstanding feature during deglaciation is MWP-1a followed by the cold Younger Dryas.
ESDD
3, 801–825, 2012Deglacial ocean circulation
G. Lohmann et al.
Title Page
Abstract Introduction
Conclusions References
Tables Figures
◭ ◮
◭ ◮
Back Close
Full Screen / Esc
Printer-friendly Version Interactive Discussion
Discussion
P
a
per
|
Dis
cussion
P
a
per
|
Discussion
P
a
per
|
Discussio
n
P
a
per
|
3.3 The deglacial freshwater forcing
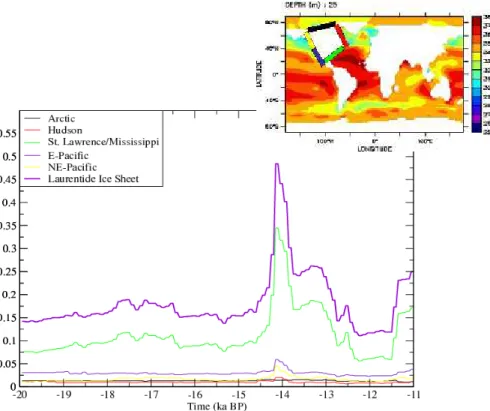
Selected time series of surface runoff originating from glacial melting are shown for the period 20 ka–11 ka BP (Fig. 3). The discharge chronology from the Laurentide Ice Sheet freshwater fluxes indicates the strongest contribution originating from the coast line between the St. Lawrence and Mississippi rivers. At about 14.6 ka MWP-1a sets in,
5
peaking at about 14 ka, which is in accordance with the timing of the Fairbanks (1989) reconstruction. In addition to glacial meltwater discharge, the modelled freshwater-flux curve contains contributions from net precipitation over the ice sheet, indicative by the higher background level of the Laurentide Ice Sheet freshwater flux. Minor contributions of total freshwater fluxes go to the east and northeast Pacific, the Arctic, and through
10
Hudson Bay. While the Fairbanks (1989) reconstruction shows a steep onset of glacial meltwater fluxes at 14.5 ka followed by a decline by 14 ka, our modelled freshwater flux rises abruptly at about 14.3 ka and declines with a lag between 14 ka and 13 ka. The net peak freshwater flux from the Laurentide Ice Sheet amounts to about 0.32 Sv at about 14.1 ka. Comparison of the modelled freshwater fluxes and sea-level change
15
with the Fairbanks (1989) reconstruction suggests that there is something missing in the model after MWP-1a.
The same course of discharge can be seen with MWP-1b at 11.6 ka; again the on-set of the freshwater peak is synchronous between model result and reconstruction (Fairbanks, 1989). However, in the model the amplitude is lower and after the peak at
20
11.6 ka, a large and prolonged freshwater flux discharges into the ocean, lasting until 9.5 ka (Fig. 2). This discharge of freshwater may have contributed to the formation of Lake Agassiz and the 8.2 ka event (Barber et al., 1999). However, the larger freshwater fluxes from the model after MWP-1b also contain a significant fraction from increased precipitation over the decaying Northern Hemisphere ice sheet. In addition, masking
25
ESDD
3, 801–825, 2012Deglacial ocean circulation
G. Lohmann et al.
Title Page
Abstract Introduction
Conclusions References
Tables Figures
◭ ◮
◭ ◮
Back Close
Full Screen / Esc
Printer-friendly Version Interactive Discussion
Discussion
P
a
per
|
Dis
cussion
P
a
per
|
Discussion
P
a
per
|
Discussio
n
P
a
per
|
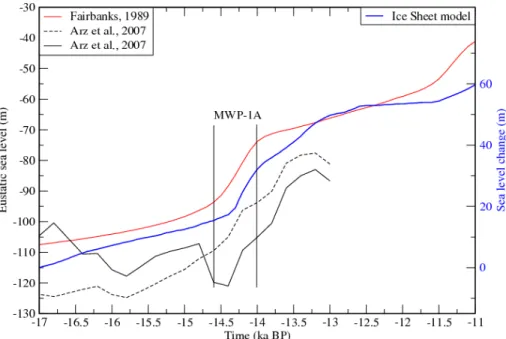
Modelled ice-volume changes expressed in sea-level changes are shown in Fig. 4 for the period 17 ka–11 ka BP. The curve displays sea-level change relative to 17 ka BP and indicates a sea-level equivalent of the Northern Hemisphere ice discharge after geomorphological correction (see Zweck and Huybrechts, 2005 for the explanation of the method). The modelled change in sea level shows the same two-step increase as
5
the global oxygen isotope record for ocean water derived from the Barbados sea-level curve by Fairbanks (1989). Since the ice model considers the Northern Hemisphere ice sheets only, the absolute amplitude is not expected to match the Fairbanks (1989) global eustatic sea-level curve. From our model results, the Northern Hemisphere contribution by MWP-1a is about 15 m which is at the lower limit of reconstructions
10
(14–20 m) (Clark et al., 1996; Fairbanks, 1989). Between 13.5 ka and 12.5 ka BP the lagged discharge chronology contributes to an enhanced sea-level rise before reach-ing a quasi-constant sea level after 12.5 ka. The increase to MWP-1b is shallower and much longer than in the reconstruction as a result of the lagged discharge instead of land storage, but higher precipitation from the ice sheets also contribute. The relative
15
sea-level change is well captured.
Here, we concentrate on the MWP-1a event in order to investigate the response of the Atlantic meridional overturning circulation to deglacial meltwater. It is possible that sediment transport plays also a role for the drainage of glacial Lake Agassiz (Clarke et al., 2009). A reconstruction by Arz et al. (2007) from the northern Red Sea shows
20
the same increase for MWP-1a but due to a 200 yr resolution a coarser discretisation of the sea-level increase.
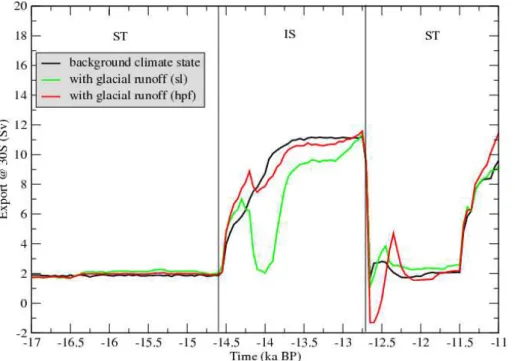
3.4 MWP-1a forcing of the North Atlantic circulation
Glacial freshwater discharge to the ocean provides a negative sea surface salinity anomaly with low density. It prevents deep water formation and can lead to a collapse
25
of the AMOC. In Fig. 5 the NADW export at 30◦S is shown as indicator for the AMOC.
ESDD
3, 801–825, 2012Deglacial ocean circulation
G. Lohmann et al.
Title Page
Abstract Introduction
Conclusions References
Tables Figures
◭ ◮
◭ ◮
Back Close
Full Screen / Esc
Printer-friendly Version Interactive Discussion
Discussion
P
a
per
|
Dis
cussion
P
a
per
|
Discussion
P
a
per
|
Discussio
n
P
a
per
|
condition has been switched to interstadial conditions. The system needs about 600– 800 yr to adapt to the boundary condition switches. Exports at 30◦S amount to about
2 Sv during stadial and 11 Sv during interstadial conditions (see Fig. 1).
The AMOC is sensitively affected by deglacial meltwater (Fig. 5, green line). Before 14.6 ka BP, the freshwater flux is about 0.15–0.2 Sv (Fig. 3) which does not seriously
5
alter the export. With the onset of the Bølling/Allerød, the freshwater flux increases to about 0.5 Sv in the model. Reaching the 14 ka peak, the AMOC collapses and NADW export reduces nearly to the late glacial state of about 2 Sv. After the peak, the AMOC recovers to a value of about 9.5 Sv, until the freshwater flux fully decreases to the pre-Bølling/Allerød rate. At 12.7 ka BP the climate switches back to stadial
con-10
ditions and the AMOC export drops to about 2.4 Sv, slightly above the state prior to the Bølling/Allerød. The stadial period lasts for about 1.3 ka (mimicking the Younger Dryas) until the interstadial climate conditions terminate the glacial period at 11.4 ka BP. Un-der freshwater forcing conditions the system takes a faster recovery in the overturning circulation than without freshwater injection during the transient phase of background
15
climate changes.
When taking hyperpycnal flows into account, the resulting NADW export at 30◦N
shows a strongly diminished response of the AMOC onto deglacial meltwater (Fig. 5, red line). The export reduced by less than 2 Sv and recovers after the peak. The over-turning circulation increases slightly faster in the initial phase relative to the background
20
climate simulation. The freshwater perturbation acts therefore on a higher overturning level, and after the freshwater peak the export rate is only less than 0.5 Sv below the background simulation.
The near surface salinity is only weakly affected by the freshwater perturbation. The signal is mixed into the bottom layers which have a much bigger thickness than the
25
ESDD
3, 801–825, 2012Deglacial ocean circulation
G. Lohmann et al.
Title Page
Abstract Introduction
Conclusions References
Tables Figures
◭ ◮
◭ ◮
Back Close
Full Screen / Esc
Printer-friendly Version Interactive Discussion
Discussion
P
a
per
|
Dis
cussion
P
a
per
|
Discussion
P
a
per
|
Discussio
n
P
a
per
|
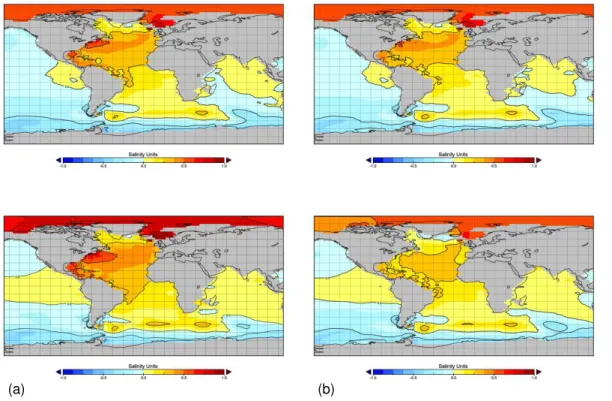
the Bølling/Allerød transition indicates a pronounced increase in glacial NADW salinity for both scenarios. The effect of the deglacial meltwater (Fig. 6b) onto salinity is only slightly decreased relative to (Fig. 6a), and salinities spread with the western boundary current to the south where this salinity signal is diluted.
4 Discussion and conclusions
5
We performed a three-dimensional ocean circulation model study forced by deglacial meltwater fluxes and changing climate background conditions. Mass loss from the ice sheet is considered in its two major components, iceberg calving and surface runoff
entering the ocean. For the Bølling/Allerød period, surface runoffhas a prevailing effect, due to peak discharge between 14.6 ka and 14 ka, associated with the MWP-1a event.
10
In order to simulate the impact of deglacial meltwater drainage on the AMOC, the idea of sediment-laden hyperpycnal flows that propagate along the sea floor as bot-tom plumes came into consideration (e.g. Tarasov and Peltier, 2006; Roche et al., 2007a). Without the effect of hyperpycnal flows, the freshwater discharge during the Bølling/Allerød forces the Atlantic Ocean circulation to cease whereas, when using
15
an extremely simplified approach simulating hyperpycnal flows, the circulation is more stable. Recovery of a freshwater perturbation takes in both cases about 500 yr and seems to be related to a threshold of about 0.25 Sv at end of the MWP-1a peak, while the full recovery to the background climate state depends on the entrainment process (top or bottom layer, without or with hyperpycnal flow). Our model results indicate that
20
freshwater when sneaking into the bottom layers (mimicking the extreme case of hy-perpycnal flows) can sustain the AMOC to a certain amount. Mixing with the ambient water reduces the density anomaly and leads to a reduced impact of freshwater flood-ing on the AMOC. We conclude, that the ocean circulation durflood-ing the Bøllflood-ing/Allerød is highly sensitive to the location and drainage depth of glacial freshwater fluxes into the
25
ESDD
3, 801–825, 2012Deglacial ocean circulation
G. Lohmann et al.
Title Page
Abstract Introduction
Conclusions References
Tables Figures
◭ ◮
◭ ◮
Back Close
Full Screen / Esc
Printer-friendly Version Interactive Discussion
Discussion
P
a
per
|
Dis
cussion
P
a
per
|
Discussion
P
a
per
|
Discussio
n
P
a
per
|
are consistent with the sensitivity study of Roche et al. (2007a), who demonstrated that hyperpycnal flows can enter the ocean in the Gulf of Mexico without ceasing the AMOC up to a certain limit of about 6 m eustatic sea-level equivalent. Therefore, our study as well the sensitivity studies of Roche et al. (2007a) and Lohmann and Schulz (2000) indicate that the deglacial warming can be reconciled with massive meltwater entering
5
the North Atlantic Ocean during the Bølling/Allerød.
Our model does certainly not reproduce all aspects of deglacial meltwater. It does not provide an enhanced deglacial meltwater drainage to the Arctic as is suggested by Tarasov and Peltier (2006) from a 3-D glacial system model calibrated against paleo-proxy data. However, this part seems to be a more important contribution during the
10
Younger Dryas than during the Bølling/Allerød which is the focus of this study. In addi-tion, the storage of meltwater on land that might have led to the formation of proglacial lakes is missing in our model set-up. Such feature could possibly delay the meltwater flux at the end of Bølling/Allerød (MWP-Ib). Our meltwater calculated by the ice sheet model captures the main features, especially the timing of the events. The simulated
15
sea-level change goes in phase with reconstructed eustatic sea-level curve, indicating a general agreement in the climate trend.
The source and causal mechanism of MWP-1a are still being explored. Based on corals drilled offshore from Tahiti, Deschamps et al. (2012) show that MWP-1a started no earlier than 14 650 yr ago and ended before 14 310 yr ago, making it coeval with
20
the Bølling/Allerød but most likely including a significant meltwater contribution from the Southern Hemisphere. Recently, Gregoire et al. (2012) found in their ice-sheet modelling simulation that the separation of the Laurentide and Cordilleran ice sheets in North America produces a meltwater pulse corresponding to MWP-1a. Stanford et al. (2006) derive that MWP-1a did not coincide with the sharp Bøllingwarming but instead
25
with the abrupt cooling of the Older Dryas with only a relatively minor 200-yr weakening of NADW flow, which is very much in line with our findings with the model.
ESDD
3, 801–825, 2012Deglacial ocean circulation
G. Lohmann et al.
Title Page
Abstract Introduction
Conclusions References
Tables Figures
◭ ◮
◭ ◮
Back Close
Full Screen / Esc
Printer-friendly Version Interactive Discussion
Discussion
P
a
per
|
Dis
cussion
P
a
per
|
Discussion
P
a
per
|
Discussio
n
P
a
per
|
the ocean water in which it enters. Hence, sneaking of meltwater into the bottom layer of the ocean is not an adhoc hypothesis, but a probable mechanism. Piper et al. (2007) es-timated a suspended sediment concentration of 40 gm l−1for the Laurentian Fan south
of Newfoundland from geophysical measurements, to be indicative for sub-glacial flood discharges, transporting gravel, sand and mud between 16–14 ka BP. Hence, such
pro-5
cesses shall be explicitely included in future Earth system models. The response of the ocean circulation to deglacial meltwater is essential for the understanding of glacial ter-minations documented by the proxy records.
Summarizing, we argue that the way how meltwater enters into the ocean (surface or bottom) provides for a first order effect for the sensitivity of the ocean circulation
10
and thus deglacial climate. For future studies, a fully coupled AOGCM-ice sheet model capturing the drainage chronology of the Laurentide Ice Sheet is being developed to shed more light on the role of deglacial meltwater on climate. The hyperpycnal flow is one candidate to explore the dramatic change at the end of the last ice age in a different way than before.
15
Acknowledgements. Discussion of the manuscript with G. Knorr is highly acknowledged. This work was funded by the German Bundesministerium f ¨ur Bildung und Forschung through the research programme DEKLIM.
References
Aharon, P.: Meltwater flooding events in the Gulf of Mexico revisited: implications from
20
rapid climate changes during the last deglaciation, Paleooceanography, 18, 1079–1092, doi:10.1029/2002PA00840, 2003. 804
Aharon, P.: Entrainment of meltwares in hyperpycnal flows during deglaciation superfloods in the Gulf of Mexico, Earth. Planet. Sc. Lett., 241, 260–270, doi:10.1016/j.epsl.2005.10.034, 2006. 804, 807
25
ESDD
3, 801–825, 2012Deglacial ocean circulation
G. Lohmann et al.
Title Page
Abstract Introduction
Conclusions References
Tables Figures
◭ ◮
◭ ◮
Back Close
Full Screen / Esc
Printer-friendly Version Interactive Discussion
Discussion
P
a
per
|
Dis
cussion
P
a
per
|
Discussion
P
a
per
|
Discussio
n
P
a
per
|
Barber, D. C., Dyke, A., Hillaire-Marcel, C., Jennings, A. E., Andrews, J. T., Kerwin, M. W., Bilodeau, G., McNeely, R., Southon, J., Morehead, M. D., and Gagnon, J. M.: Forcing of the cold event of of 8,200 years ago by catastrophic drainage of Laurentide lakes, Nature, 400, 344–348, 1999. 809
Bassett, S. E., Milne, G. A., Mitrovica, J. X., and Clark, P. U.: Ice sheet and solid Earth influences
5
on far-field sea-level histories, Science, 309, 925–928, doi:10.1126/science.1111575, 2005. 803
Bond, G., Heinrich, G. H., Broeker, W., Labeyrie, L., McManus, J., Andrews, J., Huon, S., Jantschik, R., Clasen, S., Simet, C., Tedesco, K., Klas, M., Bonani, G., and Ivy, S.: Evi-dence for massive discharges of icebergs into the North Atlantic ocean during the last glacial
10
period, Nature, 360, 245–249, 1992.
Butzin, M., Prange, M., and Lohmann, G.: Radiocarbon simulations for the glacial ocean: The effects of wind stress, Earth Plant. Sc. Lett., 235, 45–61, doi:10.1016/j.epsl.2005.03.003, 2005. 805, 806, 807
Butzin, M., Prange, M., and Lohmann, G.: Readjustment of glacial radiocarbon chronologies by
15
self-consistent three-dimensional ocean circulation modeling. Earth Planet. Sc. Lett., 317– 318, 177–184, doi:10.1016/j.epsl.2011.11.046, 2012. 806
Carlson, A. E.: Geochemical constraints on the Laurentide Ice Sheet contribution to Meltwater Pulse 1A, Quaternary Sci. Rev., 28, 1625–1630, doi:10.1016/j.quascirev.2009.02.011, 2009. 803
20
Clark, P., Alley, R., Keigwin, L., Licciardi, J., Johnsen, S., and Wang, H.: Origin of the first global meltwater pulse following the last glacial maximum, Paleoceanography, 11, 563–577, 1996. 802, 810
Clark, P. U., Mitrovica, J. X., Milne, G. A., and Tamisiea, M. E.: Sea-level fingerprint as a direct test for the source of global meltwater pulse 1A, Nature, 295, 2438–2441,
25
doi:10.1126/science.1068797, 2002a. 803
Clark, P. U., Pisias, N. G., Stocker, T. F., and Weaver, A. J.: The role of the thermohaline circu-lation in abrupt climate change, Nature, 415, 863–869, 2002b. 803
Clarke, G. K. C., Bush, A. B. G., and Bush, J. W. M.: Freshwater Discharge, Sediment Transport, and Modeled Climate Impacts of the Final Drainage of Glacial Lake Agassiz, J. Climate, 22,
30
ESDD
3, 801–825, 2012Deglacial ocean circulation
G. Lohmann et al.
Title Page
Abstract Introduction
Conclusions References
Tables Figures
◭ ◮
◭ ◮
Back Close
Full Screen / Esc
Printer-friendly Version Interactive Discussion
Discussion
P
a
per
|
Dis
cussion
P
a
per
|
Discussion
P
a
per
|
Discussio
n
P
a
per
|
CLIMAP (Project members): Seasonal reconstructions of the Earth’s surface at the last glacial maximum in Map Series, Technical Report MC-36, Geological Society of America, Boulder, Colorado, 1981. 806
Deschamps, P., Durand, N., Bard, E., Hamelin, B., Camoin, G., Thomas, A. L., Henderson, G. M., Okuno, J., and Yokoyama, Y.: Ice-sheet collapse and sea-level rise at the Bølling warming
5
14,600 years ago, Nature, 483, 559–564, doi:10.1038/nature10902, 2012. 813
Fairbanks, R. G.: A 17,000-year glacio-eustatic sea level record: influence of glacial melting rates on the Younger Dryas event and deep ocean circulation, Nature, 342, 637–642, 1989. 802, 809, 810, 823
Flower, B., Hastings, D., Hill, H., and Quinn, T.: Phasing of deglacial warming and Laurentide
10
meltwater in the Gulf of Mexico, Geology, 32, 597–600, doi:10.1130/G20604.1, 2004. 803 Gregoire, L. J., Payne, A. J., and Valdes, P. J.: Deglacial rapid sea level rises caused by
ice-sheet saddle collapses, Nature, 487, 219–222, doi:10.1038/nature11257, 2012. 803, 813 Heinrich, H.: Origin and consequence of cyclic ice rafting in the northeast Atlantic-Ocean during
the past 130,000 years, Quatern. Res., 29, 142–152, 1988.
15
Hesse, T., Butzin, M., Bickert, T., and Lohmann, G.: A model-data comparison ofδ13C in the glacial Atlantic Ocean, Paleoceanography, 26, PA3220, doi:10.1029/2010PA002085, 2011. 806, 807
Huybrechts, P.: Sea-level changes at the LGM from ice-dynamic reconstructions of the Green-land and Antarctic ice sheets during the glacial cycles, Quaternary Sci. Rev., 21, 203–231,
20
2002. 804, 809
Huybrechts, P., and T’siobbel, S.: A three-dimensional climate/ ice-sheet model applied to the Last Glacial Maximum, Ann. Glaciol., 25, 333–339, 1997. 807
Knorr, G. and Lohmann, G.: Rapid transitions in the Atlantic thermohaline circulation triggered by global warming and meltwater durinbg the last deglaciation, Geochem. Geophy. Geosy.,
25
8, Q12006, doi:10.1029/2007GC001604, 2007. 803
Liu, Z., Otto-Bliesner, B. L., He, F., Brady, E. C., Tomas, R., Clark, P. U., Carlson, A. E., Lynch-Stieglitz, J., Curry, W., Brook, E., Erickson, D., Jacob, R., Kutzbach, J., and Cheng, J.: Tran-sient Simulation of Last Deglaciation with a New Mechanism for Bølling-Allerød Warming, Science, 325, 310–314, 2009. 803
30
ESDD
3, 801–825, 2012Deglacial ocean circulation
G. Lohmann et al.
Title Page
Abstract Introduction
Conclusions References
Tables Figures
◭ ◮
◭ ◮
Back Close
Full Screen / Esc
Printer-friendly Version Interactive Discussion
Discussion
P
a
per
|
Dis
cussion
P
a
per
|
Discussion
P
a
per
|
Discussio
n
P
a
per
|
Lohmann, G. and Lorenz, S.: On the hydrological cycle under paleoclimate conditions as de-rived from AGCM simulations, J. Geophys. Res., 105, 17417–17436, 2000. 806
Lohmann, G. and Schulz, M.: Reconciling Bølling warmth peak deglacial meltwater discharge, Paleooceanography, 15, 537–540, 2000. 804, 813
Maier-Reimer, E., Mikolajewicz, U., and Hasselmann, K.: Mean circulation of the Hamburg LSG
5
OGCM and its sensitivity to the thermohaline surface forcing, J. Phys. Oceanogr., 23, 731– 757, 1993. 805
Manabe, S. and Stouffer, R. J.: Coupled ocean/atmosphere model response to freshwater input: Comparison to Younger Dryas event, Paleooceanography, 12, 321–336, 1997. 803
McManus, J. F., Francois, R., Gherardi, J.-M., Keigwin, L. D., and Brown-Leger, S.: Collapse
10
and rapid resumption of Atlantic meridional circulation linked to deglacial climate changes, Nature, 428, 834–837, doi:10.1038/nature02494, 2004. 803, 806
Otto-Bliesner, B. L. and Brady, E. C.: The sensitivity of the climate response to the magnitude and location of freshwater forcing: last glacial maximum experiments, Quaternary Sci. Rev., 29, 56–73, 2010. 803
15
Paul, A. and Sch ¨afer-Neth, C.: Modeling the water mass of the Atlantic Ocean during Last Glacial Maximum, Paleooceanography, 18, 1058, doi:10.1029/2002PA000783, 2003. 806 Peltier, W. R.: Global glacial isostasy and the surface of the ice-age Earth: The
ICE-5G (VM2) Model and GRACE, Annu. Rev. Earth Planet. Sci., 32, 111–149, doi:10.1146/annurev.earth.32.082503.144359, 2004. 803
20
Piper, D. J. W., Shaw, J., and Skene, K. I.: Stratigraphic and sedimentological evidence for late Wisconsian sub-glacial outburst floods to Laurentian Fan, Paleogeogr. Paleocl., 246, 101– 119, 2007. 804, 814
Prange, M., Romanova, V., and Lohmann, G.: The glacial thermohaline circulation: stable or unstable?, Geophys. Res. Lett., 29, 2028, doi:10.1029/2002GL015337, 2002. 806
25
Prange, M., Lohmann, G., and Paul, A.: Influence of vertical mixing on the thermohaline hys-teresis: Analyses of an OGCM, J. Phys. Oceanogr., 33, 1707–1721, 2003. 805
Quadfasel, D., Kudrass, H., and Frische, A.: Deep-water renewable by turbidity currents in the Sulu Sea, Nature, 348, 320–322, 1990. 813
Rahmstorf, S. and Willebrand, J.: The role of temperature feedback in stabalizing the
thermo-30
ESDD
3, 801–825, 2012Deglacial ocean circulation
G. Lohmann et al.
Title Page
Abstract Introduction
Conclusions References
Tables Figures
◭ ◮
◭ ◮
Back Close
Full Screen / Esc
Printer-friendly Version Interactive Discussion
Discussion
P
a
per
|
Dis
cussion
P
a
per
|
Discussion
P
a
per
|
Discussio
n
P
a
per
|
Roeckner, E., Arpe, K., Bengtsson, L., Brinkop, S., D ¨umenil, L., Esch, M., Kirk, E., Lunkeit, F., Ponater, M., Rockel, B., Sausen, R., Schlese, U., Schubert, S., and Windelband, M.: Simulation of present-day climate with the ECHAM model: Impact of model physics and resolution, MPI Report No. 93, Max-Planck-Institut f ¨ur Meteorologie, Hamburg, Germany, 171 pp., 1992. 806
5
Roche, D. M., Renssen, H., Weber, S. L., and Goosse, H.: Could meltwater pulse have sneaked unnoticed into the deep ocean during the last glacial?, Geophys. Res. Lett., 24, L24708, doi:10.1029/2007GL032064, 2007a. 804, 805, 812, 813
Roche, D. M., Dokken, T. M., Goosse, H., Renssen, H., and Weber, S. L.: Climate of the Last Glacial Maximum: sensitivity studies and model-data comparison with the LOVECLIM
cou-10
pled model, Clim. Past, 3, 205–224, doi:10.5194/cp-3-205-2007, 2007b.
Romanova, V., Prange, M., and Lohmann, G.: Stability of the glacial thermohaline circula-tion and its dependence on the background hydrological cycle, Clim. Dynam., 22, 527–538, 2004.
Sarnthein, M., Winn, K., Jung, S. J. A., Duplessy, J.-C., Labeyrie, L., Erlenkeuser, H., and
15
Ganssen, G.: Changes in East Atlantic Deepwater Circulation over the Last 30,000 years: Eight Time Slice Reconstructions, Paleoceanography, 9, 209–267, 1994. 803
Sarnthein, M., Gersonde, R., Niebler, S., Pflaumann, U., Spielhagen, R., Thiede, J., Wefer, G., and Weinelt, M.: Overview of Glacial Atlantic Ocean Mapping (GLAMAP 2000), Paleo-ceanography, 18, 1030, doi:10.1029/2002PA000769, 2003. 806
20
Shin, S.-I., Liu, Z., Otto-Bliesner, B. L., Kutzbach, J. E., and Vavrus, S. J.: Southern Ocean sea-ice control of the glacial North Atlantic thermohaline circulation, Geophys. Res. Lett., 30, 1096, doi:10.1029/2002GL015513, 2003.
Stanford, J. D., Rohling, E. J., Hunter, S. E., Roberts, A. P., Rasmussen, S. O., Bard, E., Mc-Manus, J., and Fairbanks, R. G.: Timing of meltwater pulse 1a and climate responses to
melt-25
water injections, Paleoceanography, 21, PA4103, doi:10.1029/2006PA001340, 2006. 803, 804, 813
Stocker, T. F., Wright, D. G., and Mysak, L. A.: A zonally averaged, coupled ocean-atmosphere model for paleoclimate studies, J. Climate, 5, 773–797, 1992. 803
Tarasov, L. and Peltier, W.: A calibrated deglacial drainage chronology for the North American
30
ESDD
3, 801–825, 2012Deglacial ocean circulation
G. Lohmann et al.
Title Page
Abstract Introduction
Conclusions References
Tables Figures
◭ ◮
◭ ◮
Back Close
Full Screen / Esc
Printer-friendly Version Interactive Discussion
Discussion
P
a
per
|
Dis
cussion
P
a
per
|
Discussion
P
a
per
|
Discussio
n
P
a
per
|
Weaver, A. J., Saenko, O. A., Clark, P. U., and Mitrovica, J. X.: Meltwater pulse 1A from Antarctica as a trigger of the Bølling/Allerød warm interval, Science, 299, 1709–1712, doi:10.1126/science.1081002, 2003. 803
Zweck, C. and Huybrechts, P.: Modeling of the northern hemisphere ice sheets dur-ing the last glacial cycle and glaciological sensitivity, J. Geophys. Res., 110, D07103,
5
ESDD
3, 801–825, 2012Deglacial ocean circulation
G. Lohmann et al.
Title Page
Abstract Introduction
Conclusions References
Tables Figures
◭ ◮
◭ ◮
Back Close
Full Screen / Esc
Printer-friendly Version Interactive Discussion
Discussion
P
a
per
|
Dis
cussion
P
a
per
|
Discussion
P
a
per
|
Discussio
n
P
a
per
|
(a)
(b)
ESDD
3, 801–825, 2012Deglacial ocean circulation
G. Lohmann et al.
Title Page
Abstract Introduction
Conclusions References
Tables Figures
◭ ◮
◭ ◮
Back Close
Full Screen / Esc
Printer-friendly Version Interactive Discussion
Discussion
P
a
per
|
Dis
cussion
P
a
per
|
Discussion
P
a
per
|
Discussio
n
P
a
per
|
(a) (b)