Gender Gap in the ERASMUS Mobility
Program
Lucas Böttcher1
*, Nuno A. M. Araújo2, Jan Nagler1, José F. F. Mendes3, Dirk Helbing4,
Hans J. Herrmann1,5
1Computational Physics for Engineering Materials, Institute for Building Materials, ETH Zurich, Zurich, Switzerland,2Departamento de Física, Faculdade de Ciências and Centro de Física Teórica e
Computacional, Universidade de Lisboa, Lisboa, Portugal,3Departamento de Física and I3N, Universidade de Aveiro, Aveiro, Portugal,4Professorship of Computational Social Science, ETH Zurich, Zurich,
Switzerland,5Departamento de Física, Universidade Federal do Ceará, Fortaleza, Brazil
Abstract
Studying abroad has become very popular among students. The ERASMUS mobility pro-gram is one of the largest international student exchange propro-grams in the world, which has supported already more than three million participants since 1987. We analyzed the mobil-ity pattern within this program in 2011-12 and found a gender gap across countries and subject areas. Namely, for almost all participating countries, female students are over-rep-resented in the ERASMUS program when compared to the entire population of tertiary stu-dents. The same tendency is observed across different subject areas. We also found a gender asymmetry in the geographical distribution of hosting institutions, with a bias of male students in Scandinavian countries. However, a detailed analysis reveals that this latter asymmetry is rather driven by subject and consistent with the distribution of gender ratios among subject areas.
Introduction
Statistical analyses of big data sets have revealed interesting patterns related to human mobility. For example, from the trajectory of mobile phone users, it was possible to identify temporal and spacial regularity in the mobility patterns, with a characteristic travel distance and a small set of frequently visited locations for each individual [1]. Using data from global connectivity and epidemic spreading, Brockmann and Helbing could successfully predict the disease arrival time and/or sources for different diseases [2]. Also, from the database of airports and alterna-tive connections between these airports it was possible to reveal a core-periphery structure in the World Airline Network, consisting of a strongly connected core and a weakly connected, tree-like, periphery [3]. Here, we use similar tools to evaluate possible gender differences in the mobility pattern of ERASMUS students.
ERASMUS is an European Unity exchange program that provides financial support to European students to study abroad. It brings together more than four thousand academic insti-tutions and companies across 33 countries and aims at boosting the participants x2019; job
OPEN ACCESS
Citation:Böttcher L, Araújo NAM, Nagler J, Mendes JFF, Helbing D, Herrmann HJ (2016) Gender Gap in the ERASMUS Mobility Program. PLoS ONE 11(2): e0149514. doi:10.1371/journal.pone.0149514
Editor:Matjaz Perc, University of Maribor, SLOVENIA
Received:November 10, 2015
Accepted:February 1, 2016
Published:February 22, 2016
Copyright:© 2016 Böttcher et al. This is an open access article distributed under the terms of the
Creative Commons Attribution License, which permits unrestricted use, distribution, and reproduction in any medium, provided the original author and source are credited.
Data Availability Statement:All relevant data are within the paper and its Supporting Information files.
Funding:The authors acknowledge financial support from the ETH Risk Center, the Brazilian Institute INCT-SC (Instituto Nacional de Ciência e Tecnologia de Sistemas Complexos), ERC Advanced grants numbers FP7-319968 and FP7-3242247 of the European Research Council, and the Portuguese Foundation for Science and Technology (FCT) under contract no. IF/00255/2013 and UID/FIS/00618/2013.
prospects by encouraging international mobility and promoting the development of personal skills, such as intercultural awareness, openness, and flexibility [4–8]. The participation in the ERASMUS program has increased impressively, from a mere three thousand participants in 1987 to 252827 in 2012 [4,6]. The number of participants in the 2011–12 edition corresponds
to almost 1% of all tertiary students [9]. This impressive level of participation makes the ERAS-MUS program an excellent example to study the enrollment of students in exchange programs and to identify mobility patterns.
A comparative study of ERASMUS and non-ERASMUS students concludes that the deci-sion to participate is mainly affected by profesdeci-sional aspects and personal preferences, although a financial barrier is also identified [10]. Studies of the network of ERASMUS institutions show that the choice for a country is positively correlated to its number of top ranked universities [11] and that students are typically biased towards institutions that were previously selected by their home-university fellows [12]. The personal motivation for par-ticipating in mobility programs should be interpreted in the context of the social environ-ment, personal experiences, and the macroeconomic situation in the country of residence [13]. So far, however, gender differences have not been thoroughly studied. The number of female students in tertiary education is definitely on the rise [14]. According to the EURO-STAT tertiary education statistics, the number of female students in EU-28 countries even surpassed the number of their male fellows [9]. Are the mobility patterns of male and female students the same or different? Here we show that, in the ERASMUS program in 2011–12,
female students are consistently over-represented, even when considering their majority in tertiary education. This result is in sharp contrast to the labor market, where empirical stud-ies suggest that the mobility of female workers is lower than the one of their male counter-parts [15].
Materials and Methods
The ERASMUS student mobility data set for the 2011–12 edition contains the list of all
partici-pants and their home- and host-institution/country, gender, age, nationality and subject area. Home- and host-academic institutions are represented by their institution code that is uniquely defined. We have the list of codes and names for 4466 institutions. For 1915 of them, there is no information available about their official name and therefore we decided to remove them from the list. The resulting data set consists of 2551 universities and 199488 participants. We provide the entire data set asS1 File.
The data set also contains information about the type of mobility: mobility for study (between two academic institutions), industrial placement (between universities and industrial partners) or combinations of both. In the latter case we considered only the university as the host-institution. In the data, there are 204744 university exchanges, 48083 industrial place-ments and only 438 combined exchanges.
Additional statistical information about the ERASMUS program was obtained from the sta-tistical reports of the European Union [6]. The tertiary education statistics in the ERASMUS countries was obtained from EUROSTAT [9].
Results
In 2011–12, 153468 ERASMUS participants (about 61%) were female students. This
percent-age is even 1.13 times higher than the fraction of female students attending tertiary education in the ERASMUS countries. This higher rate of participation is practically the same for indus-trial internships and university exchanges. Note that, if participants were randomly drawn from the entire population of 24606715 tertiary students, the expected number of female par-ticipants (136527) would differ from the actually observed one (153468) more than 60 times the standard deviation (251). Thus, it is highly improbable that the over-representation of female students is a mere statistical fluctuation. Below we analyze this gender patterns across subject areas and countries.
According to theInternational Standard Classification of Education(ISCED), the popula-tion of tertiary students is divided into eight subject areas:education;humanities and arts;
social sciences, business and law;sciences, mathematics and computing;engineering,
manufacturing and construction;agriculture and veterinary medicine;health and welfare; and
services.Fig 1shows the participation rate over these subject areas for the ERASMUS program and for the entire tertiary education population in the ERASMUS countries. One sees that cer-tain subjects are clearly over-represented in the ERASMUS program. For example,humanities and artsrank second in terms of ERASMUS participants while they rank fourth in the total population of tertiary students. By contrast, the participation ofeducationstudents is very low.
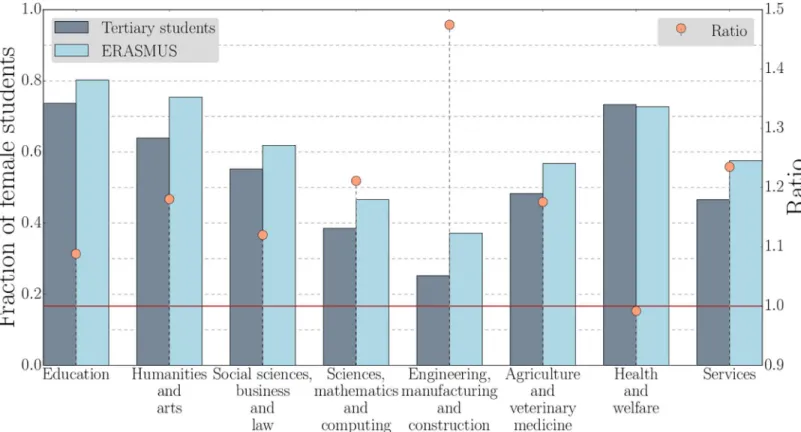
Fig 2shows the fractions of female students in tertiary education and ERASMUS together with
Fig 1. The participation rate in the ERASMUS program depends on the subject area.Participation rate in different subject areas in the 2011–12
ERASMUS program (light blue) and in tertiary education in the participating countries in 2011 (dark blue). The orange circles are the ratios of these fractions. Whilehumanities and arts,social sciences, business and law,engineering, manufacturing and constructionare over-represented in the ERASMUS program, the others are under-represented.
the ratio between them. In line with the agglomerated data, females are over-represented in the ERASMUS program across all subject areas, except forhealth and welfare. Forengineering, manufacturing and construction, an area typically dominated by male students, the ratio is almost 1.5 times higher.
The same gender asymmetry is observed across countries.Fig 3contains the fraction of female students in the ERASMUS program, in tertiary education for all ERASMUS countries, and the ratio between them. Only seven out of 33 countries have a balanced fraction: Iceland, Italy, Sweden, France, Belgium, Portugal, and Spain. For all the other countries, female students are clearly over-represented in the ERASMUS program in comparison to the tertiary student population. The largest ratios are for Cyprus, Greece, Finland, Latvia, and Germany.
Let us now focus on the mobility between countries. For simplicity, we only consider ERAS-MUS exchanges between academic institutions, disregarding industrial placements (seeMaterials and Methods). In this way, one can keep track of institution names since they are uniquely defined, which is very important to geographically localize them.Table 1contains the top five countries sending and receiving students in the ERASMUS program, ranked by the absolute num-ber of ERASMUS outgoing and incoming students, respectively. Spain ranks first in both lists. In fact, approximately 30% of all ERASMUS students are either coming from or moving to Spain. The most popular university in the entire program is the University of Granada (Spain) that hosts roughly 2% of all ERASMUS students. If we normalize the number of outgoing students by the total number of tertiary students in the country, Spain ranks third (1.7% of tertiary students), being surpassed by Luxembourg (7.8% of tertiary students) and Liechtenstein (3.4%).
Fig 2. The over-representation of female students in the ERASMUS program is systematic across subject areas.Fraction of female students in different subject areas in the 2011–12 ERASMUS program (light blue) and in tertiary education in the participating countries in 2011 (dark blue). The orange
circles are the ratios of these fractions. For almost all subject areas, female students are over-represented in the ERASMUS program. The only exception is health and welfare, where the ratio is balanced.
FromTable 1one concludes that, for the top sending and receiving countries, female stu-dents are systematically over-represented. But, are there geographical regions that are preferred by female students more than by their male fellows? The maps inFig 4show the geographical distribution of the top 30 academic institutions ranked by the number of outgoing and incom-ing (a) female and (b) male students, revealincom-ing gender differences in the mobility pattern. Scan-dinavian universities are definitely more attractive to male students than to female ones. To understand this effect we analyze the mobility pattern of ERASMUS participants in thesocial sciences, business and lawandnatural sciences, mathematics and computing. For simplicity, we refer to them associal scienceandsciencegroups, respectively. The social science group consists
Fig 3. The over-representation of female students in the ERASMUS program is systematic across countries.Fraction of female students in the 2011–
12 ERASMUS program (light blue) and in tertiary education in 2011 (dark blue) for the 33 participating countries. The orange circles are the ratios of these fractions. For Iceland, Italy, Sweden, France, Belgium, Portugal, and Spain, the fractions are similar. For all the other countries, female students are over-represented in the ERASMUS program in comparison to the tertiary student population.
doi:10.1371/journal.pone.0149514.g003
Table 1. Rank of sending and receiving countries.Top five countries with the highest number of outgoing (sending) and incoming (receiving) students in the ERASMUS program for academic exchange, i.e., study mobility. The fraction of female students is shown in brackets.
Top sending Top receiving
Spain: 33634 (55%) Spain: 30938 (67%)
Germany: 27106 (62%) France: 22887 (69%)
France: 24250 (57%) Germany: 20885 (59%)
Italy: 19757 (59%) United Kingdom: 17697 (64%)
Poland: 11878 (71%) Italy: 17028 (65%)
of 50496 female and 32011 male students. The science group is more balanced, with 7335 female and 8603 male students.Fig 5shows the geographical distribution of the two different groups. Within the same subject area there are no significant gender differences. However, the patterns are significantly different between the two subject areas. This suggests that the observed gender differences in the geographical distribution of the top ranked institutions are rather driven by subject and not by gender.
Discussion
The analysis of the mobility in the 2011–12 edition of the ERASMUS program reveals that
female students tend to be over-represented, when compared to their participation in tertiary education. This over-representation is largely consistent across subject areas and countries. The study of the geographical distribution of home- and host-institutions also hints at a gender asymmetry, suggesting that Scandinavian institutions are more attractive to male students than to female ones. However, a more detailed analysis shows that the geographical asymmetry is driven by subject area and consistent with the distribution of gender ratios among subject areas.
In the present a study we aim to analyze the existing data without assuming any previous postulates. This study raises several social questions. What is the reason for this interesting gender gap in ERASMUS participation? Further studies are necessary. One direction for future work might be to investigate how social connections among participants affect their choice for the host-institution. For example, are friends applying for the same university to travel together? Could this be the mechanism underlying the geographical asymmetry? Also, empiri-cal studies of the labor market suggest the opposite, namely that female workers are less mobile than their male partners [15], a gender gap that even increases for less-educated workers. The
Fig 4. There is a gender asymmetry in the geographical distributionof involved institutions.Map of the top 30 academic institutions ranked by the number of outgoing and incoming (a) female and (b) male students. Red circles represent the sending institutions and green squares the receiving ones. The size of the symbols is proportional to the ratio of the number of ERASMUS students to the total number of ERASMUS students in the 30 academic
institutions. The overall fraction of receiving students in each country is indicated by the intensity of the color of the country. The Scandinavian universities are much more attractive to male students than to female ones.
reason for this inversion is still elusive. It is also noteworthy that students fromsciences, mathe-matics and computinggo to Scandinavia more than they do for Spain and Italy together. This is in sharp contrast to the agglomerated data, which suggests that Spain and Italy are very popular countries.
Fig 5. The geographical gender asymmetry is driven by subject area.Map of the top 30 academic institutions ranked by the number of outgoing and incoming (a,c) female and (b,d) male students, for (a,b)social sciences, business and lawand (c,d)natural sciences, mathematics and computing. Red circles represent the sending institutions and green squares the receiving ones. The size of the symbols is proportional to the ratio of the number of ERASMUS students to the total number of ERASMUS students in the 30 academic institutions. The overall fraction of hosted students in each country is indicated by the intensity of the color of the country. When the ERASMUS participants are split into two groups (social sciences and sciences), the female and male mobility patterns are consistent.
Supporting Information
S1 File. ERASMUS data.Data set of ERASMUS participants.
(ZIP)
Acknowledgments
We would like to thank Olivia Woolley-Meza for fruitful discussions and acknowledge finan-cial support from the ETH Risk Center, the Brazilian Institute INCT-SC, ERC Advanced grants numbers FP7-319968 and FP7-3242247 of the European Research Council, and the Portuguese Foundation for Science and Technology (FCT) under contract no. IF/00255/2013 and UID/ FIS/00618/2013. Geographical shape data for mobility pattern maps were taken from the NUTS 2010 shapefile © EuroGeographics for the administrative boundaries.
Author Contributions
Conceived and designed the experiments: LB NAMA JN JM DH HH. Performed the experi-ments: LB NAMA JN JM DH HH. Analyzed the data: LB NAMA JN JM DH HH. Wrote the paper: LB NAMA JN JM DH HH.
References
1. González MC, Hidalgo CA, Barabási AL. Understanding individual human mobility patterns. Nature. 2008; 453:779–782. doi:10.1038/nature06958PMID:18528393
2. Brockmann D, Helbing D. The Hidden Geometry of Complex, Network-Driven Contagion Phenomena. Science. 2013; 342:1337–1342. doi:10.1126/science.1245200PMID:24337289
3. Verma T, Araújo NAM, Herrmann HJ. Revealing the structure of the world airline network. Sci Rep. 2014; 4:5638. doi:10.1038/srep05638PMID:25005934
4. European Commission. Erasmus—Facts, Figures & Trends. The European Union support for student
and staff exchanges and university cooperation in 2012–13; 2014.
5. European Commission. The ERASMUS Impact Study; 2014.
6. European Commission. A Statistical Overview of the ERASMUS Programme in 2011–12; 2013.
7. Parey M, Waldinger F. Studying Abroad and the Effect on International Labour Market Mobility: Evi-dence from the Introduction of ERASMUS. Econ J. 2011; 121(551):194–222. doi:10.1111/j.1468-0297.
2010.02369.x
8. Bracht O, Engel C, Janson K, Over A, Schomburg A, Teichler U. The Professional Value of ERASMUS Mobility. International Centre for Higher Education Research, University of Kassel. 2006;.
9. [Tertiary students (ISCED 5–6) by field of education and sex]; 2015. Available from:http://appsso.
eurostat.ec.europa.eu/nui/show.do?dataset=educ_enrl5&lang=en.
10. Souto-Otero M, Huisman J, Beerkens M, de Wit H, VujićS. Barriers to International Student Mobility Evidence From the Erasmus Program. Educ Res. 2013; 42(2):70–77. doi:10.3102/
0013189X12466696
11. González CR, Bustillo Mesanza R, Mariel P. The determinants of international student mobility flows: an empirical study on the Erasmus programme. High Educ. 2011; 62(4):413–430. doi:10.1007/
s10734-010-9396-5
12. Derzsi A, Derzsy N, Káptalana E, Néda Z. Topology of the Erasmus student mobility network. Physica A. 2011; 390(13):2601–2610. doi:10.1016/j.physa.2011.02.041
13. Van Mol C, Timmerman C. Should I Stay or Should I Go? An Analysis of the Determinants of Intra-Euro-pean Student Mobility. Popul Space Place. 2014; 20(5):465–479. doi:10.1002/psp.1833
14. Vincent-Lancrin S. The Reversal of Gender Inequalities in Higher Education: An On-going Trend. vol. 1. OECD Publishing; 2008.
15. Theodossiou I, Zangelidis A. Should I stay or should I go? The effect of gender, education and unem-ployment on labour market transitions. Labour Econ. 2009; 16:566–577. doi:10.1016/j.labeco.2009.01.