ALEXANDER HUAMÁN MERA
STRUCTURE AND GENETIC DIVERSITY OF Cedrela
(MELIACEAE) ON THE UPPER PARANA RIVER
Dissertation submitted to the Universidade Federal de Viçosa, as part of the requirements of the Post Graduate Course in Botany for obtention of the title Magister Scientiae.
VIÇOSA
i
ALEXANDER HUAMÁN MERA
STRUCTURE AND GENETIC DIVERSITY OF Cedrela
(MELIACEAE) ON THE UPPER PARANA RIVER
Dissertation submitted to the Universidade Federal de Viçosa, as part of the requirements of the Post Graduate Course in Botany for obtention of the title Magister Scientiae.
Approved: February 24, 2014.
_________________________________ _________________________________ João Augusto Alves Meira Neto Christina Cléo Vinson
__________________________________________ Luiz Orlando de Oliveira
ii
To my parents, Mardóneo and Yolanda,
to my family, to my country, Peru,
to my new family in Brazil
iii
ACKNOWLEDGMENTS
To the Organization of American States (OAS) for selection as a candidate for the master‟s program in Brazil.
To the Coimbra Group of Brazilian Universities Association (GCUB), which through the Alliance Program for Education and Training (PAEC) allowed me to have an opportunity in Brazil.
To the Federal University of Viçosa (UFV) for this opportunity to realize this Master course in Botany through the development of the current work.
To CAPES and CNPq for the grants and scholarship funding, The Laboratory of Biotechnology of Coffee, for the use of the sequencer, Dani for help with the sequencer. To Érica Mangaravite who collected part of the material for this work, as well as a huge thanks for the botanical material, for her friendship and scientific support for the development of this work.
To Professor Luiz Orlando de Oliviera for the guidance, dedication and especially by stimulated my interest in the Molecular Phylogeography. To Christina Cleo Vinson for helping and supporting scientifically and to all teachers who contributed to my academic and professional training in these two years in Brazil.
iv
BIOGRAPHY
ALEXANDER HUAMÁN MERA, son of Mardóneo Huamán Chávez and Yolanda Mera Cayao, born in Chomza Alta, La Peca, Bagua, Amazonas – Peru, 25th July 1983.
He completed his primary education in 1996 and high school in 1999 at the "Juan Pablo Guzmán y Vizcardo Zea" high school in La Victoria - Chiclayo - Peru.
He graduated from the Faculty of Biological Sciences, at "Pedro Ruiz Gallo" National University, Lambayeque - Peru, in the specialization of Botany in October 2006 when he received the grade of bachelor in Biology and in July 2011 he obtained the Professional title in Biology - Botany.
v
SUMMARY
RESUMO ... vi
ABSTRACT ... vii
INTRODUCTION ... 1
MATERIALS AND METHODS ... 7
1. Plant sampling ... 7
2. DNA extraction and microsatellite markers analyzes ... 7
3. Data analyses ... 12
3.1. Analyses within Populations ... 12
3.2. Analyses among Populations ... 12
RESULTS ... 14
1. Genetic diversity of microsatellite loci ... 14
2. Differentiation between populations ... 14
3. Population Genetic Structure ... 16
DISCUSSION ... 23
1. Genetic diversity among and within populations ... 23
2. Genetic diversity and structure among and within Bayesian groups ... 24
3. Refugia and conservation implications ... 25
CONCLUSIONS ... 28
vi
RESUMO
HUAMÁN MERA, Alexander. M.Sc. Universidade Federal de Viçosa, Fevereiro de 2014. Estrutura e diversidade genética de Cedrela (Meliaceae) no alto do rio
Paraná. Orientador: Luiz Orlando de Oliveira.
Cedrela (Meliaceae) é um gênero monofilético que inclui 17 espécies florestais no Neotropico. A sua diversificação se intensificou no Mioceno tardio e Plioceno cedo. Muitas espécies de Cedrela possuem distribuição restrita, entretanto Cedrela fissilis Vell. e amplamente distribuída. No Brasil C. fissilis Vell. acontece geralmente associada a florestas úmidas e estacionais. Esta espécie esta considerada “em perigo” pela lista vermelha da IUCN. É formada por duas linhagens filogenéticas que não são um clado monofilético, Cedrela fissilis Vell. e Cedrela odorata L., contendo além, sequências de C. balansae, chamando-se de complexo C. fissilis. O rio Paraná se espalha pelo Cerrado, um importante hotspot de biodiversidade; provavelmente manteve-se estável e formaram um único grande refúgio durante o final do Pleistoceno, onde ocorreram mudanças climáticas importantes. Ferramentas moleculares irão contribuir para a compreensão do processo histórico de dispersão de genes. Florestas estacionais são fortes ecossistemas ameaçados, a pesar de ser consideradas áreas de endemismo. O objetivo deste estudo foi caracterizar a diversidade genética dentro e entre populações de Cedrela ao longo do alto do Rio Paraná. Dez microssatélites foram utilizados para a genotipagem de 192 indivíduos; obtiveram-se valores de HO=0,65 e
HE=0,78 e valores positivos da FIS (FIS=0,18). Para AMOVA, 84,93 % da variação
estavam dentro das populações e 15,07% estavam entre as populações, com valores de divergência genética (FST=0,151). O grupo da Cedrela fissilis linhagem 1 mostrou-se
mais diverso, com 22 dos 54 alelos privados encontrados. Ele apresentou valor FST (FST
= 0,111) menor do que as populações do grupo Cedrela sp. (FST=0,188). Verificou-se
vii
ABSTRACT
HUAMÁN MERA, Alexander. M.Sc. Universidade Federal de Viçosa, February, 2014.
Structure and genetic diversity of Cedrela (Meliaceae) on the upper Parana river.
Adviser: Luiz Orlando de Oliveira.
Cedrela (Meliaceae) is a monophyletic genus and includes 17 tree species in the Neotropics. Its diversification intensified in the Late Miocene and Early Pliocene. Most Cedrela species have restricted distribution ranges, however Cedrela fissilis Vell. is widespread. In Brazil C. fissilis Vell. occurs associated with Seasonal and Moist Forest. This species is "endangered" on the red list of the IUCN. Cedrela fissilis is formed by Cedrela fissilis Vell. and Cedrela odorata L., two phylogenetic lineages that are not a monophyletic clade, comprising moreover sequences of C. balansae, called C. fissilis complex. The upper Paraná River spreads into the Cerrado, an important biodiversity hotspot; it is probably remained stable and formed a single large Cerrado refugium during the late Pleistocene, where occurred important climatic changes that could influence in the spread of species. Molecular tools will contribute for understanding the historical process of gene dispersal since the Pleistocene. Seasonal forests are strong threatened ecosystems. The knowledge about seasonal forest has been increased since they are considered as areas of endemism. The aim of this study was to characterize the genetic diversity within and among populations of Cedrela along upper Parana River. Ten microsatellites were used to genotype 192 individuals, then it was obtained high values of heterozygosis (HO=0.65, HE=0.78), with positive values of FIS (FIS=0.18). For
AMOVA, 84.93% of the variation were within populations and 15.07% were among populations which also reflected into the values of genetic divergence (FST=0.151). The
Cedrela fissilis lineage 1 group showed more diverse, with 22 of 54 private alleles found. It presented FST value (FST=0.111) lower than the populations of Cedrela sp.
group (FST=0.188). It has been found strong population structure showing a number of
1
INTRODUCTION
Cedrela (Meliaceae) is a monophyletic genus and includes 17 species with a distribution range in the Neotropics, from Central to South America (PENNINGTON & MUELLNER, 2010). The diversification started in the Oligocene and Early Miocene and intensified in the Late Miocene and Early Pliocene (MUELLNER et al., 2010). Most Cedrela species have restricted distribution ranges, however to species of Cedrela, Cedrela fissilis Vell. and C. odorata L., they are widespread (Colombia to Brazil), occur in diverse forest types from semideciduos forests to gallery forest and Cerrado vegetation in Brazil (GARCIA et al., 2011, MUELLNER et al., 2010). Cedrela fissilis occurs throughout South America (PENNINGTON, 1981), but its presence in Central America (Costa Rica and Panamá) is uncertain (PENNINGTON and MUELLNER, 2010). Cedrela fissilis shows an alternative characteristic, heliophilous or deciduous, these characteristics were important for colonization of seasonal forest (LORENZI, 2002). Cedrela fissilis behaves as an initial secondary or late secondary colonizer species in forests; it occur either in primary forest, mainly in the forest edge or in open spaces, or in secondary forest (CARVALHO, 2003). With habitat loss added to the high economic value of the timber, C. fissilis is listed as being „Endangered A1acd+2cd‟ in the IUCN Red List of species (International Union for Conservation of Nature) (IUCN, 2013). Cedrela odorata has provided one of the most important timber resources for Latin America and the international market today, showing a species to be considered within the red list of „Vulnerable A1cd +2cd', according to the International Union for Conservation of Nature (IUCN, 2013).
2
presented in Garcia et al (2011), Brazilian specimens identified as C. odorata group together with specimens identified as C. fissilis; both form a derived clade. Meanwhile, C. odorata from the Caribbean region and from Northern South America form a distant, basal clade. Therefore, the fact that clustering of Brazilian specimens takes place according to geography brings doubts about the true identity of these specimens and support Garcia‟s suggestion that a species complex exist in Brazil (GARCÍA et. al., 2011). Herein, we will follow GARCIA et al. (2011) and referred to the species “C. fissilis” as the Cedrela fissilis complex.
Figure 1. Geographical distribution of the main two lineages of Cedrela fissilis
complex split by Cerrado. Chiquitano (green) and Atlantico ( Blue). (Garcia et al, 2010)
The upper Paraná River is located inside two ecoregions, the Paraná-paraníba interior forest and the Cerrado (OLSON et. al., 2001). The Cerrado is the second largest Neotropical biome and is an important biodiversity hotspot; it is a „diagonal of open formations‟ (WERNECK et al., 2012). During Quaternary climatic and vegetation fluctuations the central and north-eastern Cerrado were probably disturbed by Caatinga expansions and, in contrast, the southern and western (e.g. Upper Paraná basin, Brasilia region, Chapada dos Veadeiros) probably remained stable and formed a single large Cerrado refugium during the late Pleistocene (AB‟SÁBER, 1983).
3
survived the glaciations responded by contracting into remnant habitat (refugia) during glacial maxima, and expanding during the interglacial periods. (AVISE, 2000).
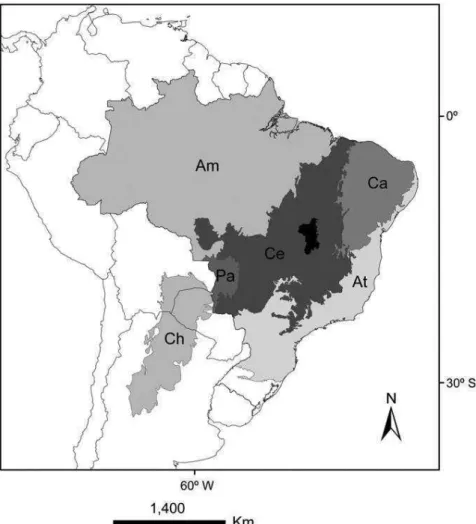
Figure 2. Georeferenced location of Cerrado (Ce), Chaco (Ch), and Caatinga SDTF
nucleus (Ca) relative to other biomes (Amazon forest [Am], Atlantic forest [At], and Pantanal [Pa]). In black the Paranã River Valley, the major SDTF enclave region within the Cerrado biome in central Brazil. (Werneck, 2011)
4
Figure 3. General distribution of rainforests, Seasonally Dry Tropical Forests (SDTFs)
and other South American dry vegetation formations. SDTFs: 1. northeast Brazil (Caatinga); 2. southeast Brazilian seasonal forests; 3. Misiones Nucleus; 4. Bolivian Chiquitano region; 5. Piedmont Nucleus; 6. Bolivian inter Andean valleys; 7. Peruvian and Ecuadorian inter-Andean valleys; 8. Pacific coastal Peru and Ecuador; 9. Caribbean coast of Colombia and Venezuela; 10. Mexico and Central America; 11. Caribbean Islands (small islands colored black are not necessarily covered by SDTFs); 12. Florida. Savannas: (A) Cerrado; (B) Bolivian savannas; (C) Amazonian savannas (smaller areas not represented); (D) coastal (Amapá, Brazil to Guyana); (E) Rio Branco-Rupununi; (F) Llanos; (G) Mexico and Central America; (H) Cuba. Ce: Cerrado, Ch: Chaco (Pennington, et al, 2006b)
Knowledge about the status of the world´s rainforests, and particularly those in the Americas, is highly concentrating on wetlands, such as rain forests of the Amazon and Atlantic Forest biomes. Although the seasonal forests cover great part of the tropics, only 14% of the biodiversity studies were performed in these forest formations (SÁNCHEZ-AZOFEIFA et al. 2005). Recently, interest in seasonal Neotropical forests has increased since they have been diagnosed as areas of endemism (PRADO 2000; PENNINGTON et al. 2004) and are threatened by high levels of destruction due to urban expansion, conversion to agricultural use and wildfires (Fundação SOS Mata Atlântica and INPE 2009).
5
fragments, the origins of the disjunction, and for understanding the processes of gene dispersal that may have occurred among the disjunction forest fragments. Molecular data can provide important information of historical process because demographic change will be reflected in the distribution and abundance of genetic diversity. Identifying and conserving the locations of high intraspecific genetic diversity is one a strategy needed to ensure that the evolutionary potential of a species is preserved for the future (SCOBLE, LOWE; 2010)
The knowledge of how genetic variation is partitioned among populations has important implications not only in evolutionary biology and ecology, but also in conservation biology (BALLOUX & LUGON-MOULIN, 2002). Genetic diversity is an important factor for the survival of populations in variable environments, and is recognized as a fundamental component of biodiversity (MACE et al., 1996). Studying genetic diversity in tree species is critical, because of the importance they have in structuring ecosystems and the fact of species with reduced genetic diversity, exhibiting risk of survival in the face biotic or abiotic stress.
Microsatellite markers are important tools which have been widely used to study genetic diversity of populations and demographics questions (ESTOUP et al., 1998). Microsatellite markers (LITT & LUTY, 1989) are short sequences of one to six base pairs, tandemly repeated, and are also called SSR (Simple Sequence Repeats, JACOB et al., 1991) or STR (Short Tandem Repeats, EDWARDS et al., 1991). Microsatellite presents randomization and scattered distribution (104 – 105) in the genome (TAUTZ, 1993). They are very abundant in the genomes of plants (DELSENY et al., 1983; TAUTZ & RENZ, 1984), are multi-allelic, have high degree of length polymorphism (ZANE et al., 2002), are codominant, are selectively neutral and have a high mutation rate. Thus, these markers are highly informative and recognized as being among the most efficient markers commonly used nowadays (ESTOUP et al., 1998; KALIA et al., 2011).
6
7
MATERIALS AND METHODS
1. Plant sampling
We considered the ranges where the main lineages of Cedrela fissilis complex are established (Chiquitano, Central and Atlantic ranges) (Table 1).
We evaluated 192 specimens of Cedrela that were assigned to either C. fissilis or Cedrela spp. in the upper Parana River, Brazil. Theses specimens were sampled in 17 populations and the mean size was 11,3 individuals per population. 04 populations were collected in the Atlantic range (PEU, PRD, PSB, and CAP), east of the Cerrado; 13 populations were collected along the upper Paraná River in the Central range; 02 of these populations (ANA and FR1) were considered as a group genetically distinct unit (Cedrela sp.) because these populations showed morphological and phenotypical features distinct from common Cedrela. Individuals up to 50 km distant were grouped in the same population (Figure 4, Table 1). Leaf samples were stored in silica gel for subsequent DNA extraction.
2. DNA extraction and microsatellite markers analyzes
DNA was extracted according to the protocol of Cota-Sánchez et al. (2006) with modifications of Riahi et al. (2010).
We genotyped the Cedrela samples using 11 microsatellite loci. Eight markers (Ced2, Ced18, Ced41, Ced44, Ced54, Ced65, Ced95 and Ced131) were obtained from Cedrela odorata species (HERNÁNDEZ et al., 2008) and two markers (CF26, CF34 and CF66) were obtained from Cedrela fissilis (GANDARA, 2009). The primer pair CF66 amplified two loci (CF66A and CF66B) (Table 2), the primer pair CF34 revealed a tetraploid profile. For the 11 loci, the average percentage of lost data was 12.21% (ranging from 0.18%, for P66A, to 4.85%, for Ced95).
8
Biotechnology). We used the following PCR program: 96°C for 2 minutes, 30 cycles of 94° C for 1 minute, annealing temperature 53° - 55 °C for 1 minute and 72 °C for 1 minute; and 72 °C for 20 minutes.
The forward primers were labeled with the fluorescence 6-FAM, HEX (MWG-Biotech) and NED (Applied Biosystems).The fragments were separated on a 96 capillary sequencer ABI PRISM 3130x1 DNA Analyzer (Applied Biosystems). The fragments were measured using Rox 500 size standard (Applied Biosystems) and analyzed in GeneMapper software v. 4.0 (Applied Biosystems).
Additionally, SSR dataset of 12 populations were added to our analyses from Mangaravite (2012). These 29 populations were used for running analyses of Population Structure (Figure 5 and 7, Table 1)
9
Table 1. Populations of Cedrela used in this work, 12 populations were taken from Mangaravite (2012) and 17 populations were
collected for this work, every population has information about their respective terrestrial ecoregions, codes, geographic coordinates and sample size. Color code: green: Moist Forest; Orange: Seasonal Forest.
Ecoregions Population (code) Latitude Longitude Sample size
Chiquitano Distribution Range
NT0135 Alta Floresta/MT (ALT)* -09 53‟ 56,97” -56 09‟ 16,12” 21
NT0212 Figueirópolis D‟Oeste/MT (FIG)* -15 26‟ 43,80” -58 44‟ 25,73” 22
NT0705 Tocantins (TOC)* -07 12‟ 26,92” -47 45‟ 49,04” 9
NT0907 Poconé/MT (POC)* -16 19‟ 08,50” -56 31‟ 52,50” 22
Central Distribution Range
NT0150 Anaurilândia/MG(ANA)** -22 12' 51.10'' -52 50' 37.20'' 24
NT0150 Hidroeletrica1/ (HD1) -21 45' 52.40'' -51 15' 47.70'' 13
NT0150 Hidroeletrica2/ (HD2) -21 44' 52.10'' -52 15' 41.80'' 7
NT0150 Cecalpina/ (CEC) -21 15' 26.80'' -51 58' 24.20'' 7
NT0704 Hidroeletrica3/ (HD3) -21 11' 07.70'' -51 51' 51.40'' 7
NT0704 Cecalpina-Hidroeletrica/ (C-H) 2
NT0150 Foz Rio Aguapei1/ (FR1)** -21 08' 10.00'' -51 47' 27.60'' 11
NT0150 Foz Rio Aguapei2/ (FR2) -21 07' 25.10'' -51 44' 29.70'' 5
NT0150 Iturama/ (ITU) -20 00' 40.90'' -50 21' 45.60'' 18
NT0150 Paraiba/(PAR) -19 43' 00.70'' -51 05' 37.10'' 15
NT0150 Uberlândia1/ (UB1) -18 06' 43.00'' -48 37' 00.00'' 11
NT0704 Uberlândia2/ (UB2) -18 11' 45.00'' -47 57' 21.00'' 16
NT0704 Uberlândia3/ (UB3) -18 58' 45.00'' -48 02' 12.00'' 19
NT0704 Brasília/DF (BRA)* -15 46‟ 47,00” -47 55‟ 47,00” 2
NT0150 Itaporã/MS (ITA)* -22 00‟ 09,68” -54 42‟ 52,59” 9
NT0202 Januária/MG (JAN)* -15 11‟ 22,56” -44 12‟ 24,48” 9
Legend (*) Populations collected and SSR dataset obtained by Mangaravite (2012). (**) Populations belong to a genetically distinct unit.
10
Table 01 (continued)
Ecoregions Population (code) Latitude Longitude Sample size
Atlantic Distribution Range
NT0160 Blumenau/SC (BLU)* -26 55‟ 07,51” -49 03‟ 57,69” 18
NT0150 Campinhos/PR (CAM)* -25 2‟ 17,00” -49 5‟ 26,00” 7
NT0104 Caparaó1/MG (CAP1)* -20 31‟ 45,60” -41 55‟ 14,10” 35
NT0150 Palotina/PR (PAL)* -24 18‟ 34,29” -53 54‟ 32,15” 26
NT0704 Diamantina/MG (DIA)* -18 24‟ 33,60” -43 29‟ 24,70” 8
NT0104 Parque Estadual Rio Doce/MG (PRD) -19 42' 48.05'' -42 43' 55.30'' 3
NT0104 Parque Estadual Uaimií/MG (PEU) -20 14' 57.41'' -43 34' 16.76'' 17
NT0104 Parque Serra Do Brigadeiro/MG (PSB) -20 41' 01.00'' -42 26' 41.00'' 10
NT0104 Caparaó/MG (CAP) -20 27' 38.86'' -41 50' 14.70'' 7
TOTAL 378
11
Table 2. Information of the eleven microsatellite loci used in this work: Reference, locus, primers sequences,
Annealing Temperature (T° C), microsatellite repeats, fluorescently labeled primers, total number of alleles per locus (NA) and allelic range in base pairs (bp).
Reference Locus Primer Sequences (5’-3’) T(°C) Repetition Fluorescence NA
Allelic range (pb)
NC
B
I, 2011
Ced2 R: AACTTTCGAATTGGTTAAGG F: TTTGCTTTGAGAAACCTTGT 55 (GA)20 6-FAM 30 131-241
Ced18 F: CAAAGACCAAGATTTGATGC R: ACTATGGGTGGCACAACTAC 55 (GA)23 HEX 22 113-161
Ced41 R: GTGGGAAAGATTGTGAAGAA F: TCATTCTTGGATCCTGCTAT 55,5 (TC)18 HEX 22 110-158
Ced44 F: ACTCCATTAACTGCCATGAA R: ATTTTCATTCCCTTTTAGCC 55,5 (TG)14(AG)17 6-FAM 30 162-224
Ced54 F: GATCTCACCCACTTGAAAAA R: GCTCATATTTGAGAGGCATT 55 (GA)15(AG)6G(GA)5 6-FAM 20 172-218
Ced65 F: GAGTGAGAAGAAGAATCGTGATAGC R: GAGGTTCGATCAGGTCTTGG 55,5 (GA)7(CA)14 HEX 24 157-193
Ced95 R:TTATCATCTCCCTCACTCCA F:ATTTTCATTCCCTTTTAGCC 55 (CT)17(AC)13 27 80-120
Ced131 R: GGAGATATTTTTGGGGTTTT F: CTCGTAATAATCCCATTCCA 55 (CT)16 NED 19 66-128
Gan
d
ar
a, 2009
CF26 F: CCAAATTCCAGAGGAGAG R: GTTCTGCTTCATCGAAGG 56 (AG/TC)13 6-FAM 0 139-187
CF66A
F: CAGCAGTTCTGAAACAGTAA R: ATTCAGCAACTTGAGAGC
56 (AG/TC)13
6-FAM
28 113-175
12
3. Data analyses
3.1. Analyses within Populations
The frequency of null alleles and scoring errors were estimated for our 17 populations using the software MICROCHEKER v. 2.2.3 (OOSTERHOUT et al. 2004). The statistical significance of deviation from Hardy–Weinberg equilibrium (HWE); the linkage disequilibrium loci, beyond the zero offset (proportions of genotypes in HWE), was assessed by allelic permutations within populations according to the Fisher exact test described by Weir (1996) were calculated according to the software FSTAT version 2.9.3.2 (GOUDET, 1995). For descriptive analyzes of genetic diversity was used the GDA program version 1.0 (d16c) (LEWIS; ZAYKIN, 2001). We computed for each population the average number of alleles per locus (A/loco), the number of private alleles (APRIV.); the expected heterozygosity (HE); the observed heterozygosity (HO); and
the inbreeding coefficient (FIS) (WRIGHT, 1951).
3.2. Analyses among Populations
Parameters of fixation indexes within populations (FIS); total fixation index
(FIT) and genetic divergence among populations (FST) described by Weir and
Cockerham (1984), GST index (NEI, 1973) and the estimated RST (SLATKIN, 1995)
were estimated using the FSTAT version 2.9.3.2 software (GOUDET, 1995). These analyses were calculated for 17 populations and also separately for the different ranges along the upper Parana River (Table 1). For these analyses, the bootstrap resampling procedure was used with 1000 permutations and 95% confidence interval. The GST rate
is analogous to FST, which assumes a infinite allele model (IAM). Whereas RST is based
on the size of the allele (stepwise mutation model, SMM). RST is expected to be greater
than the FST index whether the SMM contribute more to differentiation.
13
We calculated the pairwise FST (WEIR; HILL, 2002) among the 17 populations
using the software Arlequin version 3.1 (EXCOFFIER et al., 2006). The average gene flow was estimated assuming Nm = [1/(FST -1)]/4 (WHITLOCK; MCCAULEY, 1999),
the absolute number of migrants (M = 2Nm) between populations was also estimated on the basis of FST, using the program Arlequin version 3.1 (EXCOFFIER et al., 2006).
The genetic relationships among populations were assessed through a Neighbor-Joining tree generated based on the DA genetic distance (NEI et al., 1983)
using the software Populations 1.2.30 (LANGELLA 1999). The significance of best topology was estimated with 1000 permutations.
14
RESULTS
1. Genetic diversity of microsatellite loci
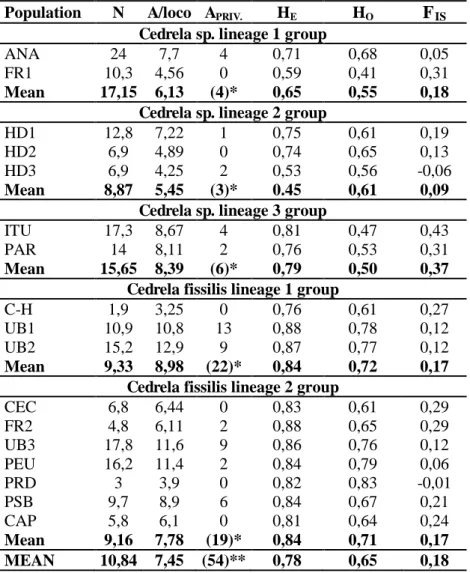
The 11 loci exhibited small to moderate frequency of null alleles, from - 0.0082 (P66A) to 0.1424 (P66B) for all 17 populations. The primers CF26 and CF34 were removed from subsequent analyses, the first one because showed a frequency of null alleles of 0.1886 in all populations and the second one because showed tetrapliod characteristics and the software do not support tetraploid data. The linkage disequilibrium probability in all populations showed no associations between loci. We identified a total of 249 alleles for the 10 loci assessed; the number of alleles for each locus ranged from 19 (CED131) to 30 (CED44 and CED2), with an average of 25 alleles per locus (Table 2). Eleven populations exhibited a total of 54 private alleles. A population located in Central Brazil (UB1) exhibited the highest number of private allele (APRIV.= 13) and populations HD2, CEC, C-H, FR1, PRD, and CAP exhibited no
private allele. The expected heterozygosity (HE) varied from 0.53 (HD3) to 0.88 (UB1),
with an average of 0.78 (± DP) (± 0.079); HE was higher than the observed
heterozygosity (HO), which varied from 0.41 (FR1) to 0.83 (PRD), with an average of
0.65 ± 0.073. Overall, the inbreeding coefficient (FIS) reached positive values, except
for the populations HD3 (FIS=-0.06) and PRD (FIS=-0.01). It varied from -0.06 (HD3) to
0.43 (ITU), with 0.18 as the average; indicating an excess of homozygotes (Table 3).
2. Differentiation between populations
Indexes of diversity showed small to moderate differences between the 17 populations assessed (GST=0,094; FST=0,111; RST=0,1344); a certain level of endogamy
is also present ( FIS = 0.171). Overall, the RST (0.1344) was higher than the FST (0.111),
which suggests a high contribution of stepwise mutation model to the current differentiation (Table 4).
15
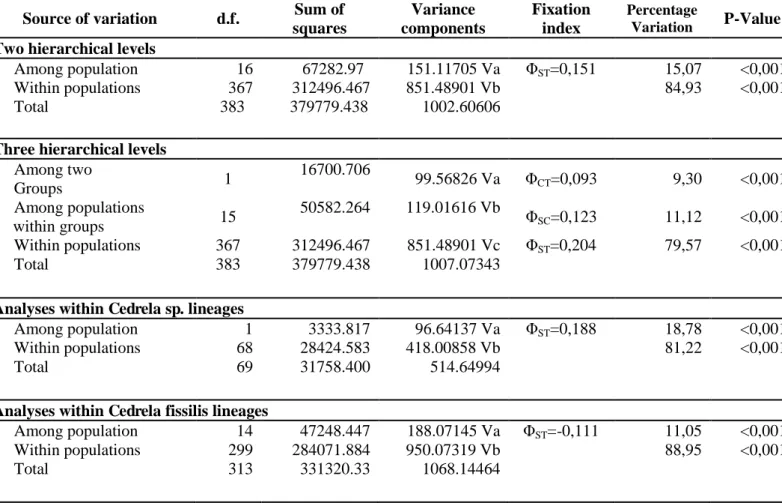
Likewise, the AMOVA considering three hierarchical levels, populations were grouped in C. fissilis and Cedrela sp., also exhibited a high genetic variation within populations (79,57%, ΦST=0,204, P<0,001). Posteriorly, the AMOVA was calculated for every
group and all cases showed a high genetic variation within populations. The group Cedrela fissilis exhibited (88,95%, ΦST=0,111, P<0,001) and the group Cedrela sp.
showed (81,22%, ΦST=0,188, P<0,001) (Table 5).
Between the 136 comparisons of pairs of FST (WEIR; HILL, 2002) among
populations, 32,35% of data were no significant (P<0,05). The significance pairs ranged from 0,038 (PEU x UB2) to 1 (FR1 x C-H). In this analyses the populations HD3 (pairwise FST ranging from 0,1968 to 0,7269), FR1 (pairwise FST ranging from 0,1729 to
1,1031) and ANA (pairwise FST ranging from 0,1739 to 0,7675) were more divergent
than the others populations. (Lower part of the Table 6).
The upper half of the table 6 shows the analyses of absolute number of migrants among the populations. The absolute number of migrants ranged to proximately 1 (C-H x FR1) to 13 (UB2 x PEU) and a value of 3. Comparing the two groups, we could see that within C. fissilis the mean absolute number of migrants was 3.2, while between the two populations from Cedrela sp. The mean absolute number of migrants was 1.6, this value is smaller than compare with C. fissilis. These results showed a greater genetic flow among populations of C. fissilis than populations of Cedrela sp. (Upper half of the Table 6), yet this result showed low levels of migrants.
We assessed the genetic relationships among 29 populations (12 taken from Mangaravite, 2012) through a Neighbor-Joining tree generated based on the DA genetic
16
3. Population Genetic Structure
17
Table 3. Genetic diversity for the 17 populations using microsatellite polymorphic loci: mean
sample size over all loci (N); average number of alleles per locus (A/locus); number of private alleles (APRIV.); expected heterozygosis (HE); observed heterozygosis (HO); and inbreeding
coefficient (FIS) (WRIGHT, 1951).
Population N A/loco APRIV. HE HO FIS Cedrela sp. lineage 1 group
ANA 24 7,7 4 0,71 0,68 0,05
FR1 10,3 4,56 0 0,59 0,41 0,31
Mean 17,15 6,13 (4)* 0,65 0,55 0,18
Cedrela sp. lineage 2 group
HD1 12,8 7,22 1 0,75 0,61 0,19
HD2 6,9 4,89 0 0,74 0,65 0,13
HD3 6,9 4,25 2 0,53 0,56 -0,06
Mean 8,87 5,45 (3)* 0.45 0,61 0,09
Cedrela sp. lineage 3 group
ITU 17,3 8,67 4 0,81 0,47 0,43
PAR 14 8,11 2 0,76 0,53 0,31
Mean 15,65 8,39 (6)* 0,79 0,50 0,37
Cedrela fissilis lineage 1 group
C-H 1,9 3,25 0 0,76 0,61 0,27
UB1 10,9 10,8 13 0,88 0,78 0,12
UB2 15,2 12,9 9 0,87 0,77 0,12
Mean 9,33 8,98 (22)* 0,84 0,72 0,17
Cedrela fissilis lineage 2 group
CEC 6,8 6,44 0 0,83 0,61 0,29
FR2 4,8 6,11 2 0,88 0,65 0,29
UB3 17,8 11,6 9 0,86 0,76 0,12
PEU 16,2 11,4 2 0,84 0,79 0,06
PRD 3 3,9 0 0,82 0,83 -0,01
PSB 9,7 8,9 6 0,84 0,67 0,21
CAP 5,8 6,1 0 0,81 0,64 0,24
Mean 9,16 7,78 (19)* 0,84 0,71 0,17
MEAN 10,84 7,45 (54)** 0,78 0,65 0,18
18
Table 4. Genetic Diversity Indexes GST (NEI, 1973); FIT, FST and FIS (WEIR; COCKERHAM, 1984) and RST (SLATKIN, 1995) for all data (17 populations) and different data grouped in five groups.
Group (size) GST FIT FST FIS RST
All (17) 0,094 0,263** 0,111** 0,171** 0,1344
Cedrela lineage 1 (02) 0,046 0,191** 0,087** 0,114** 0,2277
Cedrela lineage 2 (03) 0,065 0,184** 0,063** 0,129** 0,0647
Cedrela lineage 3 (02) 0,016 0,396** 0,031** 0,376** 0,0523
Cedrela fissilis lineage 1 (03) 0,032 0,134** 0,025** 1,112** 0,0416
Cedrela fissilis lineage 2 (07) 0,020 0,177** 0,028** 0,153** 0,0527
Legend: Statistically significant (*) P<0,05; (**) P<0,01.
Table 5. AMOVA analyses for genetic structure of population with two and three hierarchical
levels. The populations was grouped into Cedrela sp. lineages and Cedrela fissilis lineages
Source of variation d.f. Sum of squares Variance components Fixation index Percentage Variation P-Value
Two hierarchical levels
Among population 16 67282.97 151.11705 Va ΦST=0,151 15,07 <0,001
Within populations 367 312496.467 851.48901 Vb 84,93 <0,001
Total 383 379779.438 1002.60606
Three hierarchical levels
Among two
Groups 1
16700.706
99.56826 Va ΦCT=0,093 9,30 <0,001
Among populations
within groups 15
50582.264 119.01616 Vb Φ
SC=0,123 11,12 <0,001
Within populations 367 312496.467 851.48901 Vc ΦST=0,204 79,57 <0,001
Total 383 379779.438 1007.07343
Analyses within Cedrela sp. lineages
Among population 1 3333.817 96.64137 Va ΦST=0,188 18,78 <0,001
Within populations 68 28424.583 418.00858 Vb 81,22 <0,001
Total 69 31758.400 514.64994
Analyses within Cedrela fissilis lineages
Among population 14 47248.447 188.07145 Va ΦST=-0,111 11,05 <0,001
Within populations 299 284071.884 950.07319 Vb 88,95 <0,001
19
Table 6. Matrix of pairs of FST (WEIR; HILL, 2002) among populations (lower half) and absolute migrants number (M=2Nm) among populations (upper half) generated based on FST values.
ANA HD1 HD2 CEC HD3 C-HD FR1 FR2 ITU PRN UB1 UB2 UB3 PEU PRD PDB CAP
ANA 0.81841 0.886 1.483 0.726 0.651 2.162 1.707 2.353 0.982 0.922 2.874 2.212 1.878 1.087 2.570 2.613
HD1 0.6109* 222.535 4.007 2.541 - 0.884 1.684 2.902 6.927 6.437 3.884 3.317 3.430 1.632 1.613 2.917
HD2 0.5638* 0.0023 2.168 53.366 14.106 0.834 1.604 2.250 3.028 3.929 3.669 2.929 2.194 1.203 1.679 2.200
CEC 0.3370* 0.1247* 0.2305* 1.087 7.425 1.666 7.714 12.986 20.165 23.449 34.827 14.678 111.836 11.297 3.040 34.897
HD3 0.6880* 0.1967* 0.0093 0.4596* 1.541 0.687 1.407 1.086 1.117 1.696 1.823 1.807 1.040 0.711 1.206 1.228
C-HD 0.7675* 0 0.0354 0.0673 0.3244 0.453 1.556 2.835 144.906 - 25.228 8.428 7.171 1.462 2.173 1.807
FR1 0.2311* 0.5651* 0.5992* 0.2999* 0.7269* 1.000* 2.295 2.003 1.172 1.784 2.996 2.410 1.417 0.505 2.892 1.313
FR2 0.2928* 0.2968* 0.3116* 0.0648 0.3551* 0.3212 0.2177* 3.397 2.418 7.711 47.999 - 3.651 2.420 4.850 14.711
ITU 0.2124* 0.1722* 0.2221* 0.0385 0.4603* 0.1763 0.2496* 0.1471 7.318 4.505 9.821 5.806 6.589 1.717 3.455 4.023
PRN 0.5087* 0.0721* 0.1650* 0.0247 0.4475* 0.0034 0.4265* 0.2067* 0.0683 - 6.755 6.648 5.662 1.639 1.966 2.561
UB1 0.5423* 0.0776* 0.1272* 0.0213 0.2947* 0 0.2802* 0.0648 0.1109* 0 7.917 11.564 5.060 2.894 2.746 5.407
UB2 0.1739* 0.1287* 0.1362* 0.0143 0.2742* 0.0198 0.1668* 0.0104 0.0509* 0.0740* 0.0631* - 13.277 3.389 4.377 25.099
UB3 0.2259* 0.1507* 0.1706* 0.0340 0.2766* 0.0593 0.2074* 0 0.0861* 0.0752* 0.0432 0 14.754 5.153 4.109 22.203
PEU 0.2662* 0.1457* 0.2278* 0.0044 0.4804* 0.0697 0.3528* 0.1369* 0.0758* 0.0883* 0.0988* 0.0376* 0.0338 88.435 3.264 19.870
PRD 0.4598* 0.3062* 0.4153 0.0442 0.7030* 0.3419 0.9887* 0.2065 0.2910* 0.3048* 0.1727* 0.1475* 0.0970 0.0056 2.856 16.243
PSB 0.1945* 0.3098* 0.2977* 0.1644* 0.4143* 0.2300* 0.1728* 0.1030* 0.1447* 0.2542* 0.1820* 0.1142* 0.1216* 0.1531* 0.1750* 7.820
CAP 0.1913* 0.1713* 0.2272* 0.0143 0.4071* 0.2765 0.3806* 0.0339 0.1242* 0.1952* 0.0924 0.0199 0.0225 0.0251 0.0307 0.0639
20
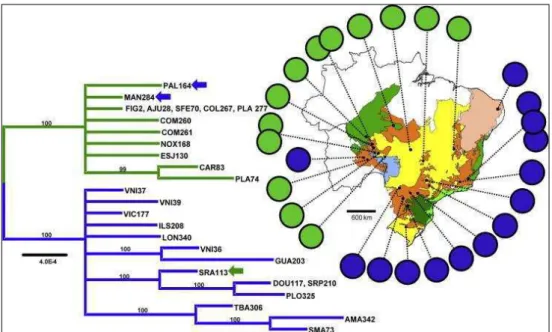
Figure 5. Unrooted tree of Neighbor-Joining generated based on the DA genetic
distance (NEI et al., 1983). In green ellipsoid, populations of the Chuquitano range; in light blue, populations of the Atlantic range; in red, orange and yellow, the new lineages exhibited in this work for the Central range, In dark green lines are shown admixtured individuals; names in square, the 17 populations from the present study; the values greater than 60 bootstrapping are shown.
21
Figure 7. Figure obtained by the analysis of STRUCTURE with K ranging from 2 to 5, each
group is represented by a color; each individual is represented by a vertical bar.
Figure 8. Graph of the correspondence between (A) Highlight the graph with K=5 (Cedrela sp.
22
23
DISCUSSION
1. Genetic diversity among and within populations
Similar results found in our study was observed by Mangaravite (2012) (HE=0,81) using SSR markers for the Cedrela fissilis complex and where her study
bears out the hypothesis of Chiquitano and Atlantic ranges. Values of high heterozygosis using microsatellite was found by Sánchez (2008), in Cedrela odorata in central America (HE=0,85), and by García et al. (2004), em Entandrophragma
cylindricum (HE=0,85). In others species of Meliaceae family, using microsatellite
markers: Swietenia humilis (HE=0,528, WHITE; POWELL, 1997; HE=0,548, WHITE et
al., 1999); Carapa guianensis (HE=0,644, DAYANANDAN et al., 1999; HE=0,69,
VINSON et al., 2005; HE=0,71, CLOUTIER et al., 2007); Swietenia macrophylla
(HE=0,781, LEMES et al., 2003; HE=0,657, NOVICK et al., 2003; HE=0,518,
CÉSPEDES et al., 2003; HE=0,799, LEMES et al., 2007; HE=0,639 e HE=0,176,
LEMES et al., 2010); and Khaya senegalensis (HE=0,636, SEXTON et al., 2010;
HE=0,739, KARAN et al., 2012). According to Hamrick et al. (1979), there is a
relationship between high levels of genetic variability and species of wide distribution with long time of generation which could be attributed to Cedrela fissilis,
Despite the high genetic diversity observed in these 17 populations of Cedrela fissilis collected along to the Paraná River basin in Brazil, we observed positives levels of inbreeding and positives values of FIS (mean FIS = 0.18), indicating an excess of
homozygotes, these values are higher than observed by Mangaravite (2012) (mean FIS =
0,11). In addition, was observed the highest values of FIS in this work (FIS = 0,43 and
FIS =0,31) corresponding for the populations ITU, PAR respectively. According
Frankham et al. (2002), deficiency of heterozygotes indicates that populations are not randomly crossing, and this can be expected for these data due to the large distances between populations.
The genetic structure among populations was slightly higher in populations of Cedrela sp. (FST=0,087; GST=0,046) than in populations of Cedrela fissilis (FST=0,071;
GST=0,065), this result also was observed in the AMOVA analyses (Table 5). This
24
(Chiquitano and Atlantic range) study by Mangaravite (2012) (FST=0,075; GST=0,085).
Our results showed interpopulation differences, these results were similar and slightly higher than those observed for Cedrela odorata from Central America (FST=0,08,
SÁNCHEZ, 2008); Swietenia macrophylla (FST=0,097, LEMES et al., 2003; FST=0,176,
LEMES et al., 2010; FST=0,117, NOVICK et al., 2003; FST=0,063, CÉSPEDES et al.,
2003); Swietenia humilis (FST=0,036, WHITE; POWELL, 1997; FST=0,032, WHITE et
al., 1999); Carapa guianensis (RST=0,017, DAYANANDAN et al., 1999). In constrats
with our results species of Meliaceae showed higher levels of proximity. This moderate to slightly high differentiation observed in our results with the populations spread in a small geographical scale covered in the central range (HAMRICK et al., 1979) is in contrast with observed by Mangaravite (2012) that the populations were collected in large geographical scale covered; moreover, it could be observed highest levels of interpopulational diversity due to the presence of two distinct genetically units (Cedrela fissilis and Cedrela sp.), with the presence of low levels of historic gene flow among populations (FUCHS; HAMRICK, 2010), observed in the low migrations in the central range among populations (Upper half . Table 6).
2. Genetic diversity and structure among and within Bayesian groups
The obtaining of a K=5, unlike the Mangaravite (2012) presviously work, K=2 for the Cedrela fissilis complex, could be to explain by the presence of material more diverse but structured, besides the existence of materials from different genetically units, observed in the individuals in these groups remained as K values were increased; despite having used of a robust marker with higher mutational rate than rate of base substitution (SCHLÖTTERER, 2000). Other factors may have influenced the high K, such as hybridization, which has importance in variability (ROBERTSON et al., 2010). For our work done in the central range and some areas in the Atlantic range, apart from the heterogeneity of the age of the collected trees, this would add to the moderate to great morphological and phenological diversity of individuals in populations were grouped by geographic extent (50 km.), generated the value of K observed, with groups well-supported, this add a structured diversity (WHITE et al., 2007).
25
and Chiquitano ranges, as described by Garcia et al. (2011) and bear out for C. fissilis complex studied by Mangaravite (2012). This could be explained by addition of that is spread out in areas of gathering and migration between the two main lineages (Chiquitano and Atlantic ranges). These have been a remnant given by the migration attempt between the two regions during drier periods (PRADO; GIBBS, 1993). The formation of last groups could be explained by the presence of different groups in addition to the two main lineages (Chiquitano and Atlantic ranges). As suggested by Mangaravite (2012) our work with major sampling along to the Paraná River basin served to confirm facts.
The analyses by groups of taxa showed differences between them. Populations of C. fissilis exhibited higher structure and more heterogeneous than populations of Cedrela sp., populations of C. fissilis showed higher APRIV., HE, HO, e lower FIS as for
descriptive analyses as AMOVA and fixation indexes (GST, FST, RST & FIT). In contrast
with the results of Mangaravite (2012) the values of APRIV. were higher only for the
populations that correspondence to Central range, and in total values, 54, higher than Mangaravite (2012) results, moreover the area where correspondence populations of UB1, UB2 and UB3 (Uberlândia) exhibited 30 of APRIV., higher than the population of
CAP (Caparao), 8 reported by Mangaravite (2012) and also showed higher values of HE,
HO, and lower FIS. This could be a new paradigm about refugia areas for this taxon, our
work suggests to increase the analyses about relax molecular clock to aim to date evolutionary process about recent colonization.
3. Refugia and conservation implications
High levels of genetic diversity (HE, APRIV.) in the populations of Cedrela fissilis
26
out the presence of genetic material from the Chiquitano range in the same populations which will be sharing genetic material from Atlantic range, this event suggest that this area is considered a refugia (GARCIA et. al., 2011; MANGARAVITE, 2012).
The presence of genetic material from Chiquitano and Atlatic ranges could explain the high diversity and private alleles in populations of UB1, UB2, and UB3 found in our study, could also explain the connectivity and the presence of historical forest refugia in the Atlantic region in the Pleistocene. In addition the high genetic diversity with presence of great number of private alleles of the populations of the Atlantic range for this in previous studies suggests this region could be a re-colonization area, received migrations from contiguous refugia (TZEDAKIS et al., 2002). In contrast with philogeographical studies where stable refugia and recently colonized areas expected to have different genetic signatures (CARNAVAL; MORITZ, 2008). Thus, as occur in the populations of Atlantic range, which are occurred altitude areas where constituted refugia areas because of the genetic flux maintains around the hills, this condition being a true genetic isolation (SHI et al., 2011); show higher levels of diversity and a single genetic material, as informed by Cavers et al. (2003) for populations of C. odorata in Costa Rica.
With the loss of habitats and overexploitation of species, is vital to generate the necessary resources to develop programs to protect habitats and ecosystems in areas where genetic diversity studies constitute a „hotspots‟ to preserve species for the future. In this case habitat loss added to the high economic value of the timber, C. fissilis is listed as being „Endangered A1acd+2cd‟ in the IUCN Red List of species (International Union for Conservation of Nature) (IUCN, 2013). In general as observed by Frankham (2002) threatened species and populations have lower genetic diversity compared with non-threatened species with large population size. Not always applying for all species, in our taxa due to the huge economic importance it is „endangered‟.
27
areas today exists efforts to preserve the ecosystems and habitats, further contributing with our results.
The climatic changes occurred in the Quaternary were the force to form standard spatial models of Meliaceae, especially in Pleistocene and Pliocene (MUELLNER et al., 2006). It is proven that the current climate change has a negative effect on species C. odorata from Costa Rica (ESMAIL; OELBERMANN, 2011) and C. montana from Bolívia (PACHECO et al., 2010). According Muellner et al. (2010), diversity in the genus Cedrela was apparently given during the Oligocene and early Miocene, with more intensified in the late Miocene and early Pliocene. However, these plants experienced a strong selection pressure for cold tolerance after surviving the last ice age millions of years ago, with the implication that the heat-tolerant genes, as well as many species, may have been eliminated (COLWELL; RANGEL, 2010).
28
CONCLUSIONS
Populations of Cedrela exhibited high intrapopulational genetic diversity and low inter populational distance.
The populational structure exhibited five groups in the best ∆K (K=5); three groups of these five constitute new lineages never before sampled which will contain rare or unique genetic material when compared with those already existing. The taxon Cedrela sp. grouped in this study by populations of ANA and FR1 constitute one of those three groups, thus, our morphological, phenological and together with our molecular evidence by microsatellite markers, suggests, the presence of a new taxon, which will be botanically described. As well as non-admixture specimens of the last two lineages need to be botanically exanimated.
The three new lineages found on the upper Parana River in Brazilian territory sharing genetic material information with the two main lineages (Chiquitano and Atlantic ranges). This information should be tested with the inclusion of major number of samples obtained from others areas that improved the data until now sampled.
29
REFERENCES
AB‟SÁBER, A.N. (1983) O domínio dos cerrados: introdução ao conhecimento.
Revista do Serviço Público, 111, 41–55.
AVISE J.C. 2000. Phylogeography: the history and formation of species. Harvard Univ. Press, Cambridge. 447pp.
BALLOUX, F.; LUGON-MOULIN, N., 2002 The estimation of population differentiation with microsatellite markers. Molecular Ecolology 11:155–165.
BESNARD, G.; GARCIA-VERDUGO, C.; CASAS, R. R.; TREIER, U. A.; GALLAND, N.; VARGAS, P. 2008. Polyploidy in the Olive Complex (Olea europaea): Evidence from Flow Cytometry and Nuclear Microsatellite Analyses.
Annals of Botany. 101: 25-30.
CARNAVAL, A. C.; HICKERSON, M. J.; HADDAD, C. F. B.; RODRIGUES, M. T.; MORITZ, C. 2009. Stability Predicts Genetic Diversity in the Brazilian Atlantic Forest Hotspot. Science, 323, 785-789.
CARNAVAL, A. C.; MORITZ, C. 2008. Historical climate modeling predicts patterns of current biodiversity in the Brazilian Atlantic forest. Journal Biogeography. 35, 1187-1201.
CARVALHO, P. E. R. 1994. Espécies Florestais Brasileiras. Recomendações silviculturais, potencialidades e uso da madeira. EMBRAPA-CNPF, Brasília. 640p. CARVALHO, P. E. R. 2003. Espécies Arbóreas Brasileiras, Vol. 1, Ed: Embrapa Florestas. 1040 p.
CAVERS, S.; NAVARRO, C.; LOWE, A. J. 2003. Chloroplast DNA phylogeography reveals colonization history of a Neotropical tree, Cedrela odorata L., in Mesoamerica.
Molecular Ecolology 12:1451–1460.
CÉSPEDES, M.; GUTIERREZ, M. V.; HOLBROOK, N. M.; ROCHA, O. J. 2003. Restoration of genetic diversity in the dry forest tree Swietenia macrophylla (Meliaceae) after pasture abandonment in Costa Rica. Molecular Ecology. 12, 3201-3212.
CLOUTIER, D.; KANASHIRO, M.; CIAMPI, A. Y.; SHOEN, D. J. 2007. Impact of selective logging on inbreeding and gene dispersal in an Amazonian tree population of Carapa guianensis Aubl. Molecular Ecology 16: 797-809.
COLWELL, R. K.; RANGEL, T. F. 2010. A stochastic, evolutionary model for range shifts and richness on tropical elevational gradients under Quaternary glacial cycles.
Philos. Trans. R. Soc. B 365, 3695– 3707..
30
CUI, Y. et al. 2011. Slow release of fossil carbon during the Palaeocene– Eocene Thermal Maximum. Nat. Geosci. 4, 481–485.
DAYANANDAN, S.; DOLE, J.; BAWA, K.; KESSELI, R. 1999. Population structure delineated with microsatellite markers in fragmented populations of a tropical tree, Carapa guianensis (Meliaceae). Molecular Ecology 8: 1585-1592.
DELSENY, M.; LAROCHE, M.; PENON, P. 1983. Detection of sequences with Z-DNA forming potential in higher plants. Biochem Biophys Res Commun 116:113– 120.
EDWARDS, A.; CIVITELLO, A.; HAMMOND, H. A.; CASKEY, C. T. 1991. DNA typing and genetic mapping with trimeric and tetrameric tandem repeats. Am J Hum
Genet 49:746–756.
ESMAIL, S. E.; OELBERMANN, M. 2011. The impact of climate change on the growth of tropical agroforestry tree seedlings. Agroforest Syst 83:235–244.
ESTOUP, A., ROUSSET, F.; MICHALAKIS, J.; CORNUET, M.; ADRIAMANGA, M. 1998. Comparative analysis of microsatellite and allozyme markers: a case study investigating microgeographic differentiation in brown trout (Salmo trutta). Mol. Ecol. 7: 339– 353.
EVANNO, G.; REGNAUT, S.; GOUDET, J. 2005. Detecting the number of clusters of individuals using the software STRUCTURE: a simulation study. Molecular Ecology. 14, 2611–2620
EXCOFFIER, L.; LAVAL, G.; SCHNEIDER, S. 2006. ARLEQUIN version 3.01: an integrated software package for population genetics data analysis. Bern: University of
Bern, Zoological Institute.
FALUSH, D.; STEPHENS, M.; PRITCHARD, J. K. 2003. Inference of population structure using multilocus genotype data: linked loci and correlated allele frequencies.
Genetics, 164, 1567–1587.
FALUSH, D.; STEPHENS, M.; PRITCHARD, J. K. 2007. Inference of population structure using multilocus genotype data: dominant markers and null alleles. Molecular
Ecology Notes.
FRANKHAM, R.; BALLOU, J. D.; BRISCOE, D. A. 2002. Introduction to
conservation genetics. Cambridge, UK. Cambridge University Press. 617 p.
NOVICK, R.; BALLOU, J. D.; BRISCOE, D. A. 2002. Introduction to conservation
genetics. Cambridge, UK. Cambridge University Press. 617 p.
FUCHS, E. J.; HAMRICK, J. L. 2010. Genetic Diversity in the Endangered Tropical Tree, Guaiacum sanctum (Zygophyllaceae). Journal of Heredity 101 (3): 284-291. FUNDAÇÃO SOS Mata Atlântica; INPE, 2010. Atlas dos Remanescentes Florestais
da Mata Atlântica. Período de 2008-2010. Relatório Parcial. Fundação SOS Mata
31
GANDARA, F. B. 2009. Diversidade genética de populações de Cedro (Cedrela
fissilis Vell. (Meliaceae)) no Centro-Sul do Brasil. Tese de doutorado. Universidade
de São Paulo, Piracicaba.
GARCIA, F.; NOYER, J.-L.; RISTERUCCI, A.-M.; CHEVALLIER, M.-H. 2004. Genotyping of Mature Trees of Entandrophragma cylindricum with Microsatellites.
Journal of Heredity. 95 (5): 454-457.
GARCIA MG. 2010. Filogeografia molecular de Cedrela fissilis Vell. e C. odorata L.
(Meliaceae) no Brasil e Bolivia. Tese de doutorado. Universidade Federal de Viçosa.
Viçosa.
GARCIA, M. G., SILVA, R. S.; CARNIELLO, M. A.; VELDMAN, J. W.; ROSSI, A. A. B.; OLIVEIRA, L. O. 2011. Molecular evidences of cryptic speciation, historical range expansion, and recent intraspecific hybridization in the Neotropical seasonal forest tree Cedrela fissilis (Meliaceae). Molecular Phylogenetics and Evolution. 61: 639–649.
GOUDET J. 1995. FSTAT (Version 1.2): a computer program to calculate F-statistics.
Journal of Heredity 86: 485–486.
HAMRICK, J. L.; LINHART, Y. B.; MITTON, J. B. 1979. Relationships between life history characteristics and electrophoretically detectable genetic variation in plants.
Ann. Rev. Ecol. Syst. 10:173-200.
HERNÁNDEZ, G.; BUONAMICI, A.; WALKER, K.; VENDRAMIN, G. G.; NAVARRO, C.; CAVERS, S. 2008. Isolation and characterization of microsatellite markers for Cedrela odorata L. (Meliaceae), a high value neotropical tree. Conserv.
Genet. 9: 457-459.
IUCN. 2013. Red list of threatened species. Disponível em: http://www.redlist.org/. JACOB, H. J.; LINDPAINTNESR, K.; KUSUMIR, E. L.; BUNKERY, K.; MAO, I. P.; GANTENV, D.; DZAU, J.; LANDER, E. S. 1991. Genetic mapping of a gene causing hypertension in the stroke-prone spontaneously hypertensive rat. Cell 67:213–224. KALIA, R. K.; RAI, M. K.; KALIA, S.; SINGH, R.; DHAWAN, A. K. 2011. Microsatellite markers: an overview of the recent progress in plants. Euphytica. 177: 309–334.
KARAN, M.; EVANS, D. S.; REILLY, D.; SCHULTE, K.; WRIGHT, C.; INNES, D.;¶ HOLTON, T. A.; NIKLES, D. G.; DICKINSON, G. R. 2012. Rapid microsatellite marker development for African mahogany (Khaya senegalensis, Meliaceae) using next-generation sequencing and assessment of its intra-specific genetic diversity
Molecular Ecology. 12, 344-353.
LANGELLA O. 1999. Populations, 1.2.30. Disponível em: <http://www. bio-ormatics.org/~tryphon/populations/.>
32
Structure in Mahogany (Swietenia macrophylla King, Meliaceae) from Amazonia and Central America. Tropical Plant Biology, 3: 40-49.
LEMES, M. R.; GRATTAPAGLIA, D.; GROGAN, J.; PROCTOR, J.; GRIBEL, R. 2007. Flexible mating system in a logged population of Swietenia macrophylla King (Meliaceae): implications for the management of a threatened neotropical tree species.
Plant Ecol 192(2):169–179.
LEMES, M. R.; GRIBEL, R.; PROCTOR, J.; GRATTAPAGLIA, D. 2003. Population genetic structure of mahogany (Swietenia macrophylla King, Meliaceae) across the Brazilian Amazon, based on variation at microsatellite loci: implications for conservation. Molecular Ecolology 12:2875–2883.
LEWIS, P. O.; E ZAYKIN, D. 2001. GDA – Genetic Data Analysis: Computer program for the analysis of allelic data. Version 1.0 (d16c). Free program distributed by the authors over the internet from http://lewis.eeb.uconn.edu/lewishome/software.html LITT, M.; LUTY, J. A. 1989 A hypervariable microsatellite revealed by in vitro amplification of a dinucleotide repeat within the cardiac muscle actin gene. Am J Hum
Genet 44: 397–401
LORENZI, H. 2002. Árvores Brasileiras - manual de identificação e cultivo de
plantas arbóreas nativas do Brasil, Vol. 01, 4ª edição. Nova Odessa, SP: Instituto
Plantarum. 384 p.
MACE, G. M.; SMITH, T. B.; BRUFORD, M. W.; WAYNE, R. K. 1996. An overview of the issues. In: Molecular genetic approaches in conservation. Eds. Smith, T. B.; Wayne, R. K. Oxford University Press, New York, 3-12.
MANGARAVITE, E, 2012. Estrutura e diversidade genética no complexo Cedrela
Fissilis (Meliaceae) no Brasil e Bolívia estimadas com marcadores microssatélites.
Tese de mestradoo. Universidade Federal de Viçosa. Viçosa.
MILES, L.; NEWTON, A. C.; DEFRIES, R. S.; RAVILIOUS, C.; MAY, I.; BLYTH, S.; KAPOS, V.; GORDON, J. E. 2006. A global overview of the conservation status of tropical dry forests. Journal of Biogeography, v. 33, n. 3, p. 491-505.
MUELLNER, A. N.; PENNINGTON, T. D.; KOECKE, A. V.; RENNER, S. S. 2010. Biogeography of Cedrela (Meliaceae, Sapindales) in Central And South America. Am.
J. Botany, 97, 511-518.
MUELLNER, A. N.; SAVOLAINEN, V.; SAMUEL, R.; CHASE, M. W. 2006. The mahogany family “out-of-Africa”: Divergence time estimation, global biogeographic patterns -erred from plastid rbcL DNA sequences, extant, and fossil distribution of diversity. Molecular Phylogenetics and Evolution. 40: 236–250.
NCBI. National Center for Biotechnology Information. 2011. Cedrela fissilis microsatellite.
NEI, M. 1973. Analysis of Gene Diversity in Subdivided Populations. Proc. Nat. Acad.
33
NEI, M.; TAJIMA, F.; TATENO, Y. 1983. Accuracy of estimated phylogenetic trees from molecular data II. Gene frequency data. Journal of Molecular Evolution 19: 153–170.
OLIVEIRA-FILHO, A. T.; FONTES, M. A. L.; 2000. Patterns of floristic differentiation among atlantic forests in southeastern Brazil and the -luence of climate.
Biotropica, 32, 793-810.
OLIVEIRA-FILHO, A. T.; SCOLFORO, J. R. S.; MELLO, J. M. 1994. Composição florística e estrutura de um remanescente de floresta semidecidual montana em Lavras, MG. Revista Brasileira de Botânica 17, 167-182.
OLSON, D. M.; DINERSTEIN, E.; WIKRAMANAYAKE, E. D.; BURGESS, N. D.; POWELL, G. V. N.; UNDERWOOD, E. C.; D‟AMICO, J. A.; ITOUA, I.; STRAND, H. E.; MORRISON, J. C.; LOUKS, C. J.; ALLNUTT, T. F.; RICKETTS, T. H.; KURA, Y.; LAMOREUX, J. F.; WETTENGEL, W. W.; HEDAO, P.; KASSEM, K. R. 2001. Terrestrial ecoregions of the world: a new map of life on earth. BioScience 51, 933– 938.
OOSTERHOUT, C. V.; HUTCHINSON, W. F.; WILLS, D. P. M.; SHIPLEY, P. 2004. MICRO-CHECKER: software for identifying and correcting genotyping errors in microsatellite data Molecular Ecology Notes. 4, 535–538
PACHECO, S.; MALIZIA, L. R.; CAYUELA, L. 2010. Effects of climate change on subtropical forests of South America. Tropical Conservation Science. 3 (4):423-437. PENNINGOTN, W.D., 1981. Subductions of the eastern Panama basin and seismotectoniccs of northwestern South America: Journal of Geophysical Research, v. 86, p. 10, 753-10,770.
PENNINGTON RT, LAVIN M, PRADO DE, PENDRY CA, PELL SK, BUTTERWORTH CA. 2004. Historical climate change and speciation: neotropical seasonally dry forest plants show patterns of both Tertiary and Quaternary diversification. Philos. T. Roy. Soc. B 359: 515-538.
PENNINGTON, R.T., LEWIS, G.P., RATTER, J.A., 2006b. An overview of the plant diversity, biogeography and conservation of Neotropical Savannas and Seasonally Dry Forests. In: Pennington, R.T., Lewis, G.P., Ratter, J.A. (Eds.), Neotropical Savannas and Seasonally Dry Forests: Plant Diversity, Biogeography and Conservation. CRC Press Taylor & Francis Group, Boca Raton, London, New York, pp. 1e29
PENNINGTON, DT. AND AN MUELLNER. 2010. A monograph of Cedrela (Meliaceae). DH Books, Sherborne, UK.
PRADO DE. 2000. Seasonally dry forests of tropical South America: from forgotten ecosystems to a new phytogeographic unit. Edinburgh Journal of Botany, 57, 437-461.
PRADO, D. E.; GIBBS, P. E. 1993. Patterns of species distribution in the dry seasonal forest of South America. Ann. Mo. Bot. Gard. 80, 902-927.
34
RIAHI, M.; ZARRE, S.; MAASSOUMI, A. A.; ATTAR, F. E.; OSALOO, S. K. 2010. An inexpensive and rapid method for extracting papilionoid genomic DNA from herbarium specimens. Genetics and Molecular Research. 9 (3): 1334-1342.
ROBERTSON, A.; RICH, T. C. G.; ALLEN, A. M.; HOUSTON, L.; ROBERTS, C.; BRIDLE, J. R.; HARRIS, S. A.; HISCOCK, S. J. 2010. Hybridization and polyploidy as drivers of continuing evolution and speciation in Sorbus. Molecular Ecology. 19, 1675-1690.
SÁNCHEZ, L. G. H. 2008. Genetic diversity and mating system analysis of Cedrela
odorata L. (Meliaceae) populations under different human dominated landscapes and primary forests. Tesis de Magister Scientiae en Manejo y Conservación de
Bosques Naturales y Biodiversidad. Turrialba, Costa Rica.
SÁNCHEZ-AZOFEIFA G.A., Quesada M., Rodriguez J.P.., Nassar J. M. Stoner K.E., Castillo A, Garvin T.,Zent E.L., Calvo – Alvarado J.C., Kalacska M.E.R., Fajardo L., Gamon J.A., Cuevas – Reyes P., 2005. Research priorities for neotropical dry
forests. Biotropica 37, 477 – 485.
SCHLÖTTERER C. 2000. Evolutionary dynamics of microsatellite DNA.
Chromosoma 109: 365–371.
SCOBLE, L. & LOWE, A.J. 82010). A case for incorporating phylogeography and landscape genetics into species distribution modelling approaches to improve climate adaptation and conservation planning. Diversity and Distributions, 16, 343-453. SEXTON, G. J.; FRERE, C. H.; DIETERS, M. J.; GODWIN, I. D.; PRENTIS, P. J. 2010. Development and characterization of microsatellite loci for khaya senegalensis (meliaceae). American Journal of Botany. e111-e113.
SHI, M-M.; MICHALSKI, S. G.; CHEN, X.-Y.; DURKA, WALTER. 2011. Isolation by Elevation: Genetic Structure at Neutral and Putatively Non-Neutral Loci in a Dominant Tree of Subtropical Forests, Castanopsis eyrei. Plos One. 6 (6) e21302. SLATKIN, M. A. 1995. Measure of population subdivision based on microsatellite allele frequencies. Genetics 139, 457–462.
TAUTZ, D. 1993 Notes on the definition and nomenclature of tandemly repetitive DNA sequences. In: PENA, S. D. J.; CHAKRABORTY, R.; EPPLEN, J. T.; JEFFREYS, A. J. (eds) DNA fingerprinting: state of the science. Birkhaiiser Verlag, Basel, pp 21–28. TAUTZ, D.; RENZ, M. 1984 Simple sequences are ubiquitous repetitive components of eukaryotic genomes. Nucleic Acids Res 12:4127–4138.
TZEDAKIS, P. C.; LAWSON, I. T.; FORGLEY, M. R.; HEWITT, G. M. 2002. Buffered tree population changes in a Quaternary refugium: evolutionary implications.
35
VELOSO, H. P.; RANGEL-FILHO, A. L. R.; LIMA, J. C. A. 1991. Classificação da
Vegetação Brasileira, Adaptada de um Sistema Universal. Instituto Brasileiro de
Geografia e Estatística, Rio de Janeiro.
VINSON, C. C.; AZEVEDO, V. C. R.; SAMPAIO, I.; CIAMPI, A. Y. 2005. Developement of microsatellite markers for Carapa guianensis (Aublet), a tree species from the Amazon forest. Molecular Ecology Notes 5: 33-34
WEIR, B. S. 1996. Genetic Data Analysis II: Methods for discrete population genetic data. Sinauer Associates, Sunderland. 445p.
WEIR, B. S.: HILL, W. G. 2002. Estimating F-statistics. Annu Rev Genet. 36, 721-750.
WEIR, B. S.; COCKERHAM, C. C. 1984.Estimating F-statistics for the analysis of population structure. Evolution, Lancaster, v. 38, n. 6, p. 1358-1370.
WERNECK, F.P., NOGUEIRA, C., COLLI, G.C., SITES JR., J.W., COSTA, G.C. (2012): Climatic stability in the Brazilian Cerrado: implications for biogeographical connections of South American savannas, species, richness, and conservation in a biodiversity hotspot. Journal of Biogeography 39: 1695–1706
WHITE, G. M.; BOSHIER, D. H.; POWELL, W. 1999. Genetic variation within a fragmented population of Swietenia humilis Zucc. Molecular Ecology. 8, 1899-1909. WHITE, G. M.; POWELL, W. 1997. Isolation and characterisation of microsatellite loci in Swietenia humilis (Meliaceae): an endangered tropical hardwood species. Molecular
Ecology, 6, 851–860.
WHITE, T. L.; ADAMS, W. T.; NEALE, D. B. 2007. Forest Genetics. CABI: London, UK. 682p.
WHITLOCK, M.C.; MCCAULEY, D.E. 1999. Indirect measures of gene flow and migration: FST _1/(4Nm +1). Heredity, v.82, p. 117-125.
WRIGHT, S. 1951. The genetical structure of populations. Annual Eugenics. 15: 223-354.